 Gabon
Gabon
Feedback welcome
Our aim is to use the best data to inform our analysis. See our About page for information on the IFs forecasting platform. We appreciate your help and references for improvements via our feedback form.
In this entry, we first describe the Current Path forecast for Gabon as it is expected to unfold to 2043, the end of the third ten-year implementation plan of the African Union’s Agenda 2063 long-term vision for Africa. The Current Path in the International Futures (IFs) forecasting model initialises from country-level data that is drawn from a range of data providers. We prioritise data from national sources.
The Current Path forecast is divided into summaries on demographics, economics, poverty, health/WaSH and climate change/energy. A second section then presents a single positive scenario for potential improvements in stability, demographics, health/WaSH, agriculture, education, manufacturing/transfers, leapfrogging, free trade, financial flows, infrastructure, governance and the impact of various scenarios on carbon emissions. With the individual impact of these sectors and dimensions having been considered, a final section presents the impact of the Combined Agenda 2063 scenario.
We generally review the impact of each scenario and the Combined Agenda 2063 scenario on gross domestic product (GDP) per person and extreme poverty except for Health/WaSH that uses life expectancy and infant mortality.
The information is presented graphically and supported by brief interpretive text.
All US$ numbers are in 2017 values.
Summary
- Current Path forecast
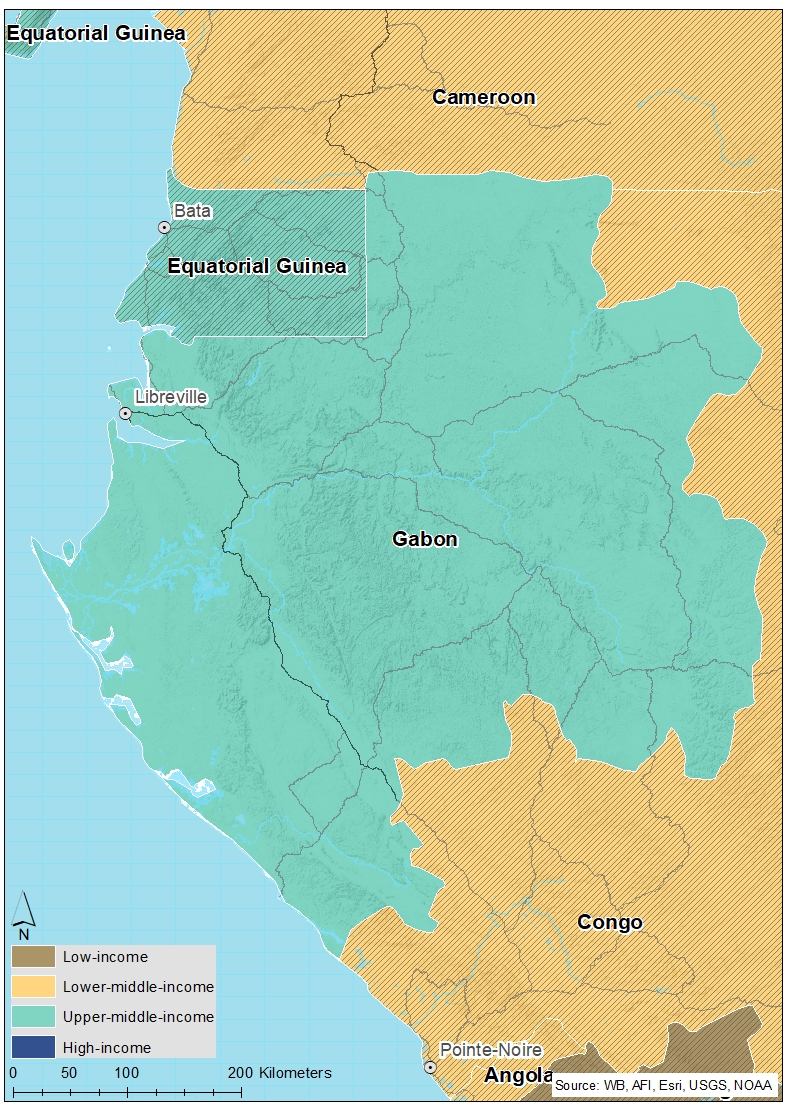
- Gabon is situated on the west coast of Central Africa and spans an area of approximately 270 000 km2. Owing to abundant petroleum deposits and subsequent foreign direct investment, Gabon is one of the most prosperous countries in sub-Saharan Africa. However, inequality levels are high. Jump to Current Path forecast
- Gabon had an estimated population of 2.2 million people in 2019. With 90% of the population living in urban areas, it is Africa’s most urbanised country. In the Current Path forecast, Gabon’s population will grow by 55%, to about 3.4 million people, by 2043. Jump to Demographics: Current Path
- In 2019, the size of Gabon’s economy stood at US$25.6 billion, and on the back of strong oil revenues the economy is projected to grow to US$50.9 billion by 2043. GDP per capita was US$17 440 in 2019, which classifies Gabon as an upper middle-income country. In the Current Path forecast, GDP per capita will grow to US$20 525 by 2043, greater than the average of its upper middle-income peer group on the continent (US$17 743). Jump to Economics: Current Path
- Gabon is expected to reduce its poverty rate by close to 20 percentage points — from 43.5% in 2019 to 23.7% in 2043 — with the number of people living on less than US$5.50 dropping from 940 000 to 800 000 in this period. Jump to Poverty: Current Path
- Gabon emitted 1.8 million tons of carbon in 2019. On the Current Path, carbon emissions are forecast to increase to 4.3 million tons by 2043. Jump to Carbon emissions/energy: Current Path
- Sectoral scenarios
- In the Stability scenario, the share of the population living in extreme poverty is expected to be 23% compared with 23.7% on the Current Path. Jump to Stability scenario
- The interventions in the Demographic scenario are expected to accelerate Gabon’s demographic transition. The ratio between workers and dependants will increase from 1.44 in 2019 to 1.86 by 2043, compared with a ratio of 1.68 on the Current Path. Jump to Demographic scenario
- In the Health/WaSH scenario, life expectancy in Gabon will increase from 66.9 years in 2019 to 72.1 years by 2043, one year more than in the Current Path forecast. Jump to Health/WaSH scenario
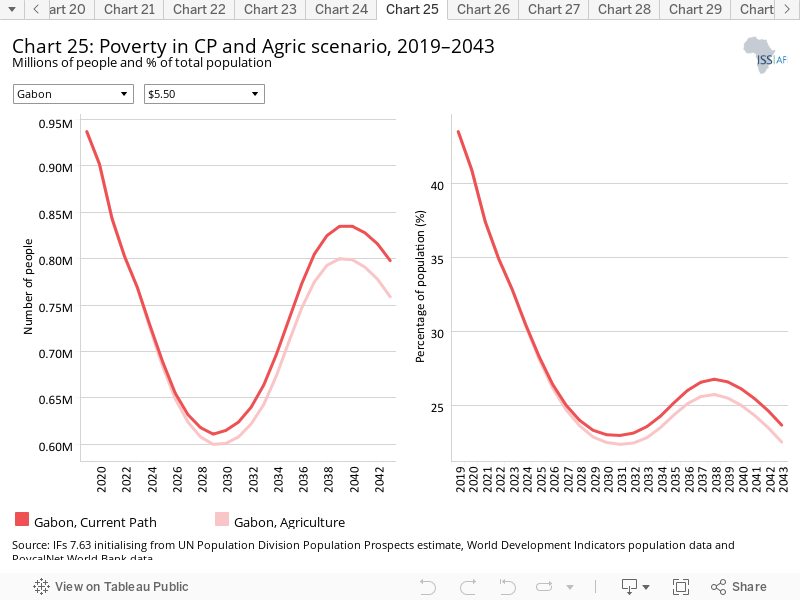
- In the Agriculture scenario, yields could increase by more than 73% versus 40% on the Current Path, and keep import dependence at 2019 levels. Jump to Agriculture scenario
- The Education scenario translates to Gabon’s GDP per capita increasing to US$20 525 by 2043, instead of US$21 004 as in the Current Path forecast for that year. Jump to Education scenario
- In the Manufacturing/Transfers scenario, government welfare transfers are forecast to more than double, from US$1.74 billion in 2019 to close to US$4 billion by 2043, compared with US$3.2 billion on the Current Path. Jump to Manufacturing/Transfers scenario
- In 2019, 92% of Gabon’s population had access to electricity. In the Leapfrogging scenario, electricity access is projected to increase to almost universal access (98.5%) compared with 93.6% on the Current Path. Jump to Leapfrogging scenario
- In the Free Trade scenario, Gabon’s GDP per capita is expected to experience a larger increase than on the Current Path: from US$17 440 in 2019 to US$21 342 versus US$20 525 by 2043. Jump to Free Trade scenario
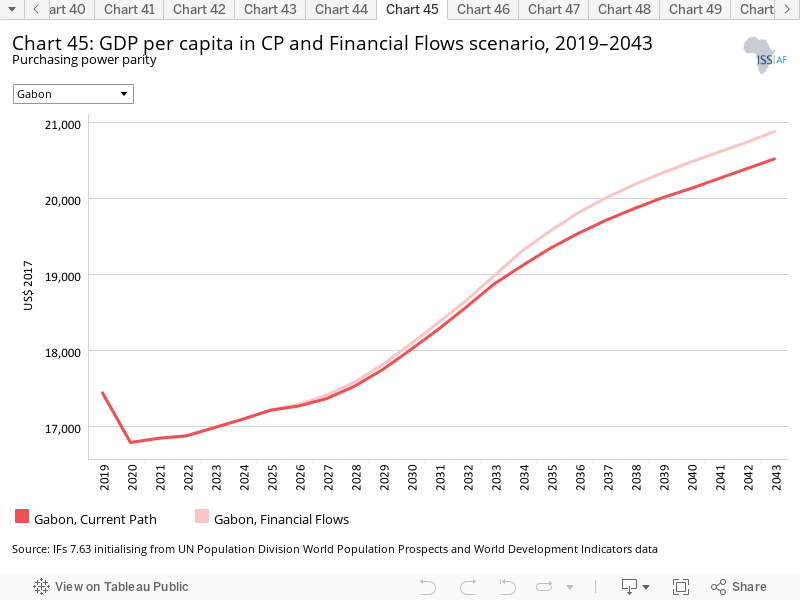
- By 2043, FDI flows are set to account for 4% of Gabon’s GDP in the Financial Flows scenario compared with 3% in the Current Path forecast. Jump to Financial Flows scenario
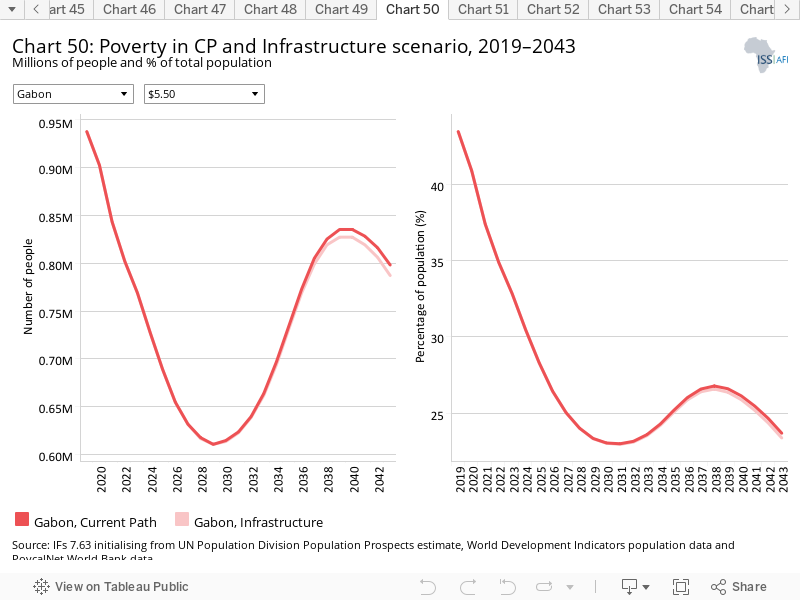
- The interventions in the Infrastructure scenario could increase Gabon’s overall electricity access rate to 95.4% by 2043 compared with 93.6% on the Current Path. Jump to Infrastructure scenario
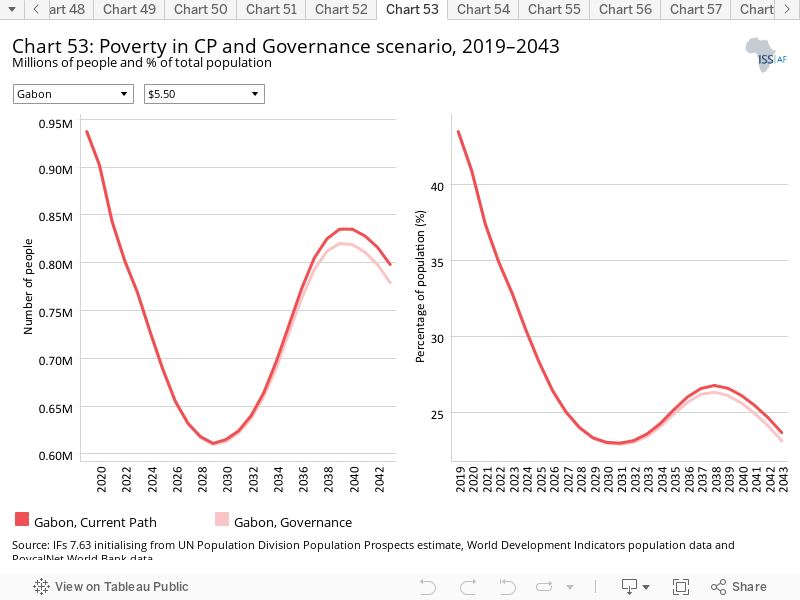
- In the Governance scenario, Gabon could reduce the share of the population living below the poverty line to 23.1% by 2043, compared with 23.7% on the Current Path. Jump to Governance scenario
- Among the sectoral interventions, the Free Trade, Manufacturing/Transfers and the Financial Flows scenarios are expected to have the greatest impact on carbon emissions by 2043, resulting in emissions of about 4.4 million tons each. Jump to Impact of scenarios on carbon emissions
- Combined Agenda 2063 Jump to Agenda 2063 Scenario
- This scenario could see Gabon’s economy reach US$66.7 billion by 2043, a difference of US$15.8 billion compared with the Current Path forecast for that year. GDP per capita is expected to rise by additional US$4 839, reaching US$25 364 by 2043 compared with US$20 525 on the Current Path.
- In this scenario, extreme poverty could halve by 2043, reaching 12.7% (410 000 people) versus 23.7% (800 000 people) on the Current Path.
- Carbon emissions are set to increase from 1.8 million tons in 2019 to 4.8 million tons by 2043, compared with 4 million tons in the Current Path forecast.
All charts for Gabon
- Chart 1: Political map of Gabon
- Chart 2: Population structure in CP, 1990–2043
- Chart 3: Urban and rural population in CP, 1990–2043
- Chart 4: Population density map for 2019
- Chart 5: GDP in CP, 1990–2043
- Chart 6: GDP per capita in CP, 1990–2043
- Chart 7: Informal sector value in CP, 2015–2043
- Chart 8: Value added by sector in CP, 2015–2043
- Chart 9: Agriculture production/demand in CP, 1990–2043
- Chart 10: Poverty in CP, 2015–2043
- Chart 11: Energy production by type in CP, 1990–2043
- Chart 12: Carbon emissions in CP, 1990–2043
- Chart 13: Governance security in CP and Stability scenario, 2019–2043
- Chart 14: GDP per capita in CP and Stability scenario, 2019–2043
- Chart 15: Poverty in CP and Stability scenario, 2019–2043
- Chart 16: Demographic dividend in CP and Demog scenario, 2019–2043
- Chart 17: Infant mortality in CP and Demog scenario, 2019–2043
- Chart 18: GDP per capita in CP and Demog scenario, 2019–2043
- Chart 19: Poverty in CP and Demog scenario, 2019–2043
- Chart 20: Life expectancy in CP and Health/WaSH scenario, 2019–2043
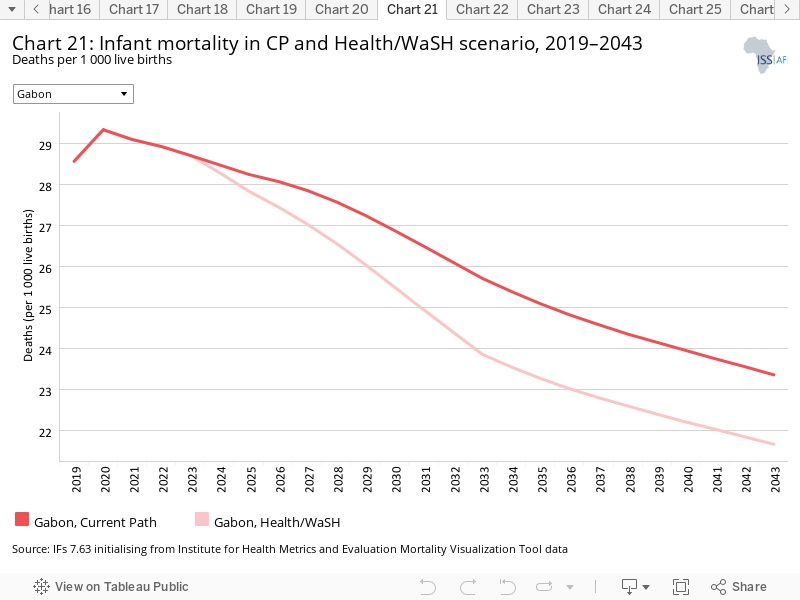
- Chart 21: Infant mortality in CP and Health/WaSH scenario, 2019–2043
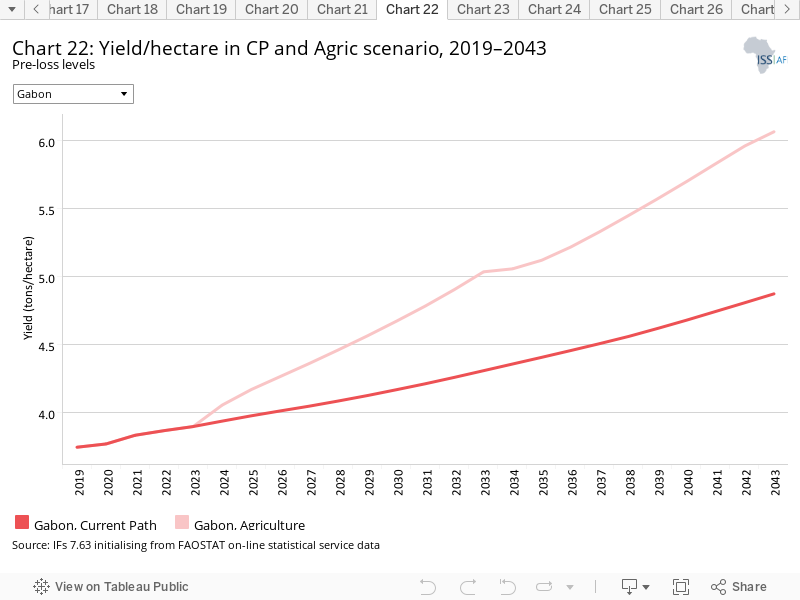
- Chart 22: Yield/hectare in CP and Agric scenario, 2019–2043
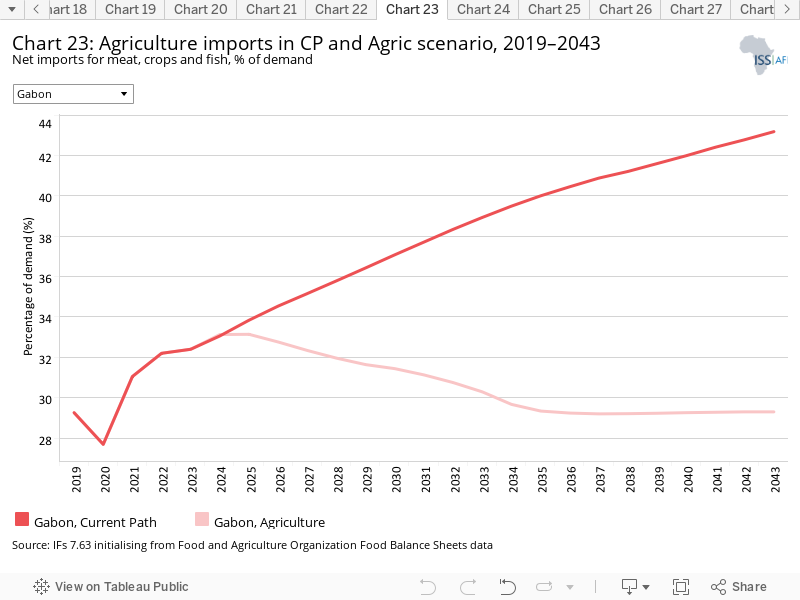
- Chart 23: Agriculture imports in CP and Agric scenario, 2019–2043
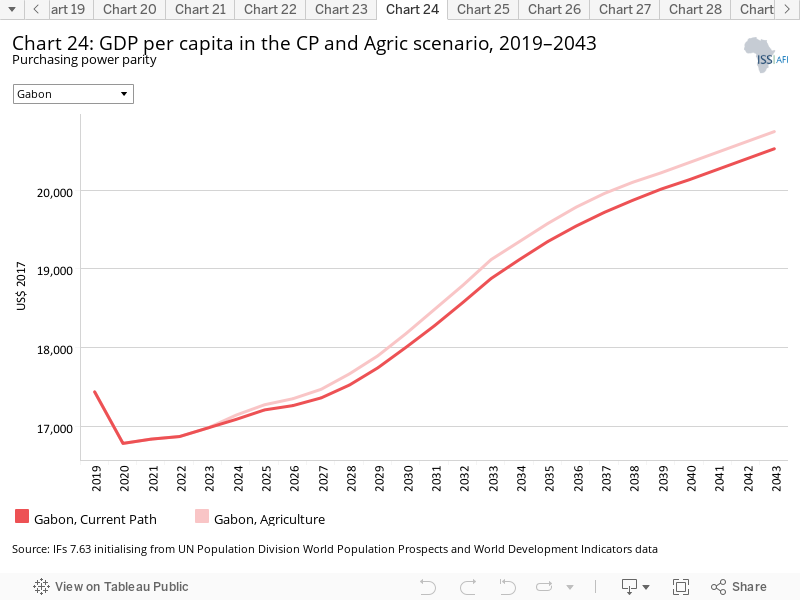
- Chart 24: GDP per capita in the CP and Agric scenario, 2019–2043
- Chart 25: Poverty in CP and Agric scenario, 2019–2043
- Chart 26: Mean years of education in CP and Educ scenario, 2019–2043
- Chart 27: Education quality in CP and Educ scenario, 2019–2043
- Chart 28: GDP per capita in CP and Educ scenario, 2019–2043
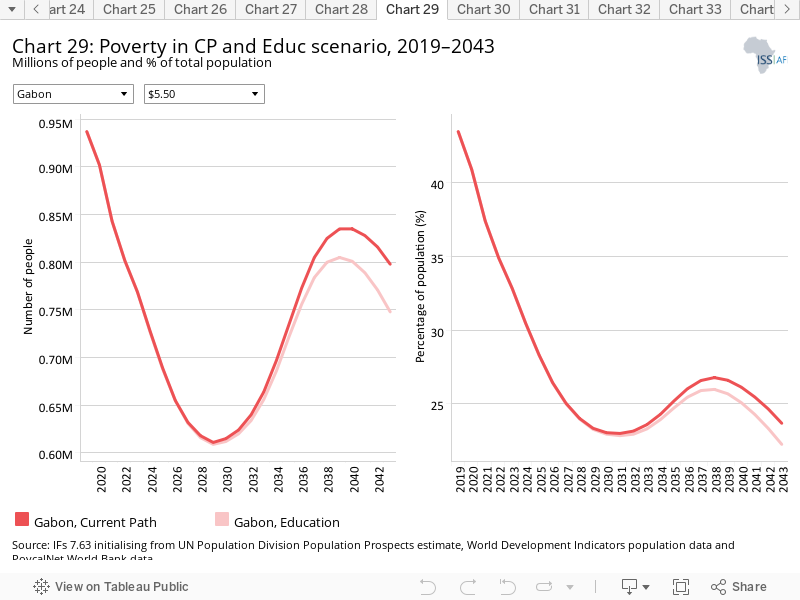
- Chart 29: Poverty in CP and Educ scenario, 2019–2043
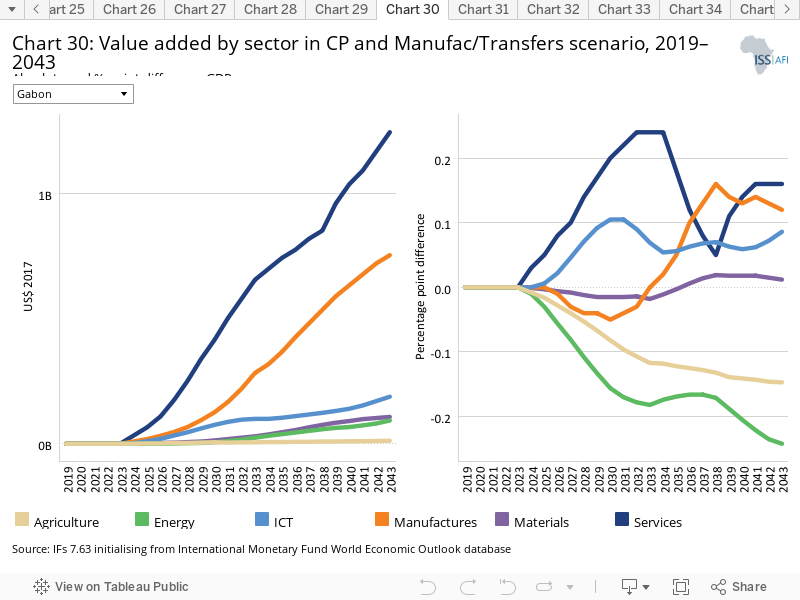
- Chart 30: Value added by sector in CP and Manufac/Transfers scenario, 2019–2043
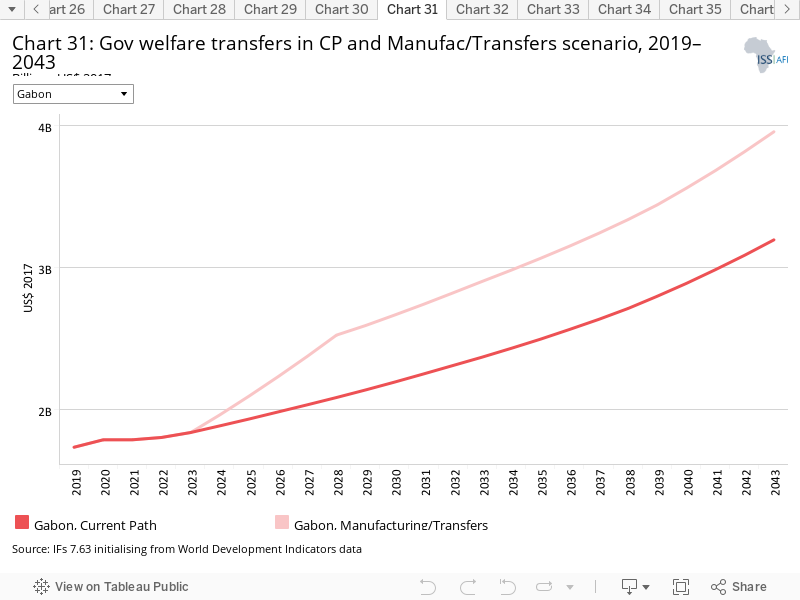
- Chart 31: Gov welfare transfers in CP and Manufac/Transfers scenario, 2019–2043
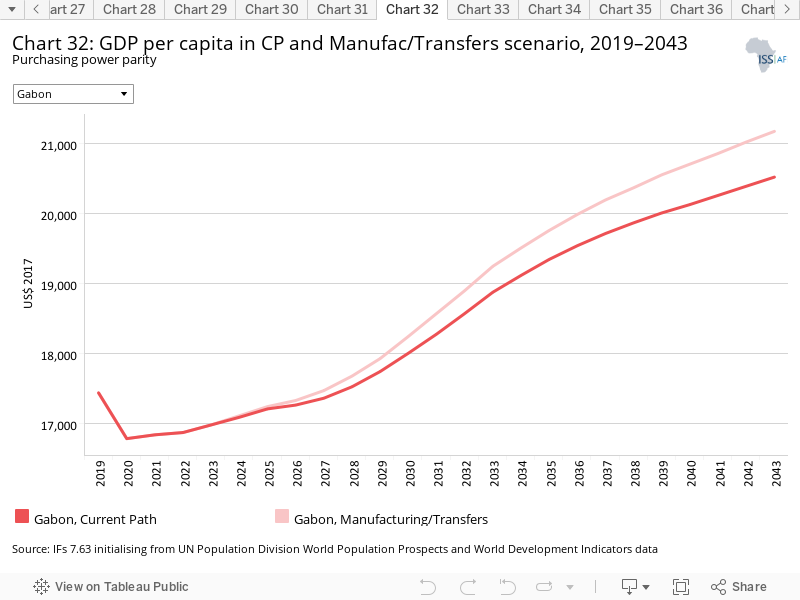
- Chart 32: GDP per capita in CP and Manufac/Transfers scenario, 2019–2043
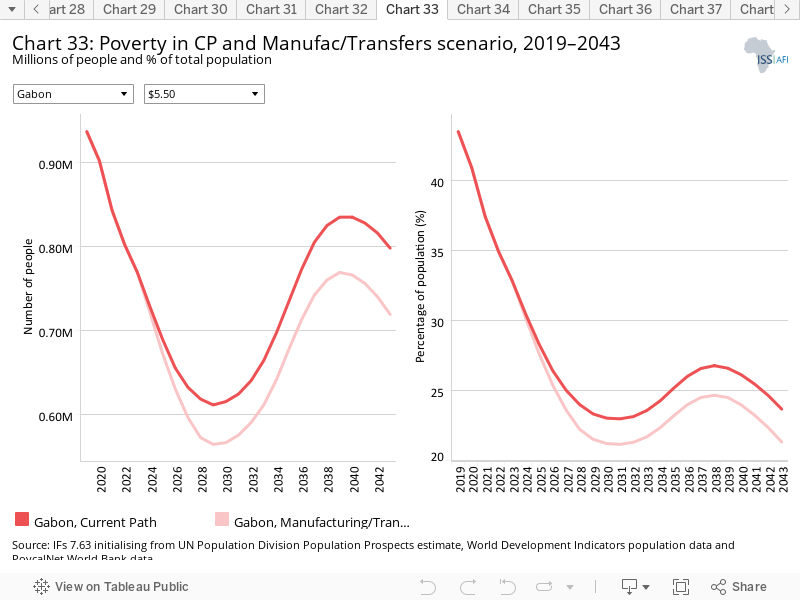
- Chart 33: Poverty in CP and Manufac/Transfers scenario, 2019–2043
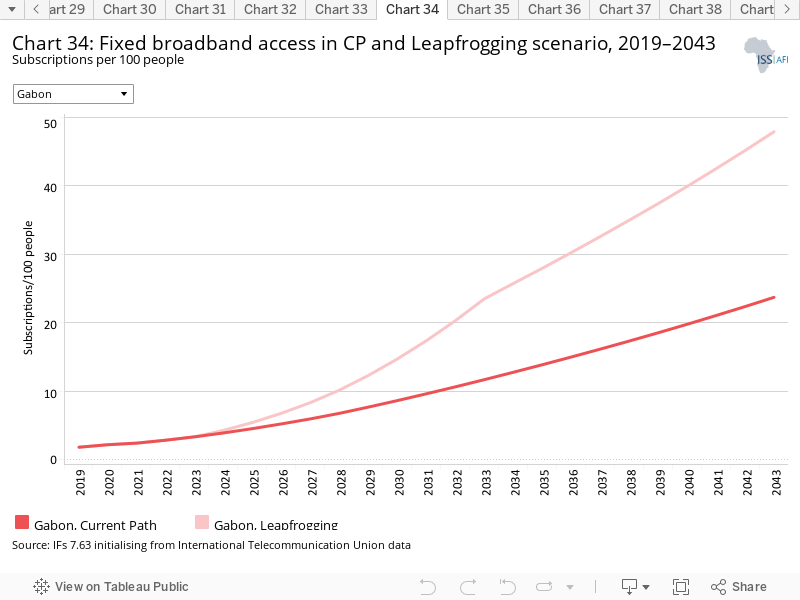
- Chart 34: Fixed broadband access in CP and Leapfrogging scenario, 2019–2043
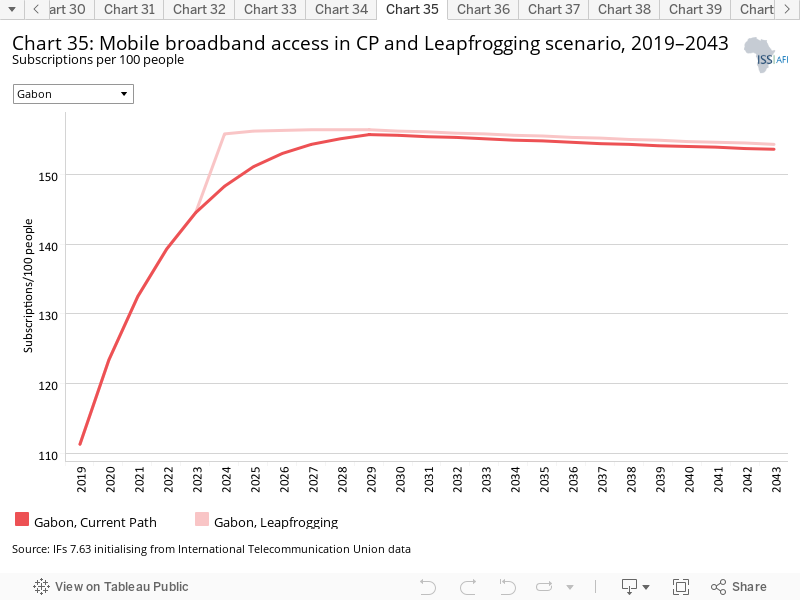
- Chart 35: Mobile broadband access in CP and Leapfrogging scenario, 2019–2043
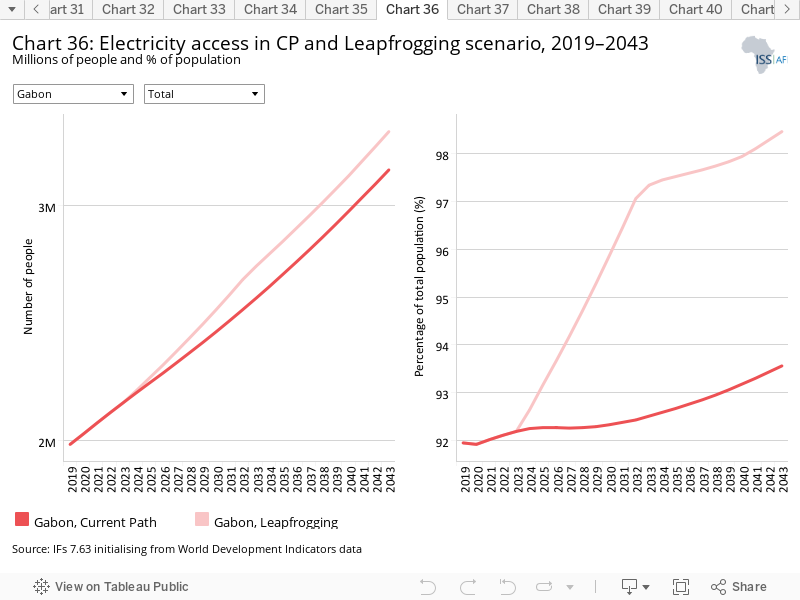
- Chart 36: Electricity access in CP and Leapfrogging scenario, 2019–2043
- Chart 37: GDP per capita in CP and Leapfrogging scenario, 2019–2043
- Chart 38: Poverty in CP and Leapfrogging scenario, 2019–2043
- Chart 39: Trade balance in CP and Free Trade scenario, 2019–2043
- Chart 40: GDP per capita in CP and Free Trade scenario, 2019–2043
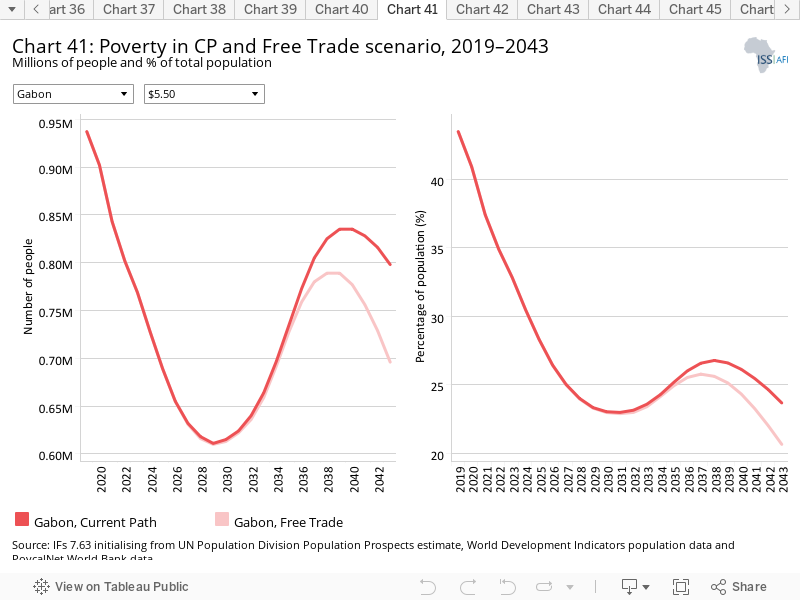
- Chart 41: Poverty in CP and Free Trade scenario, 2019–2043
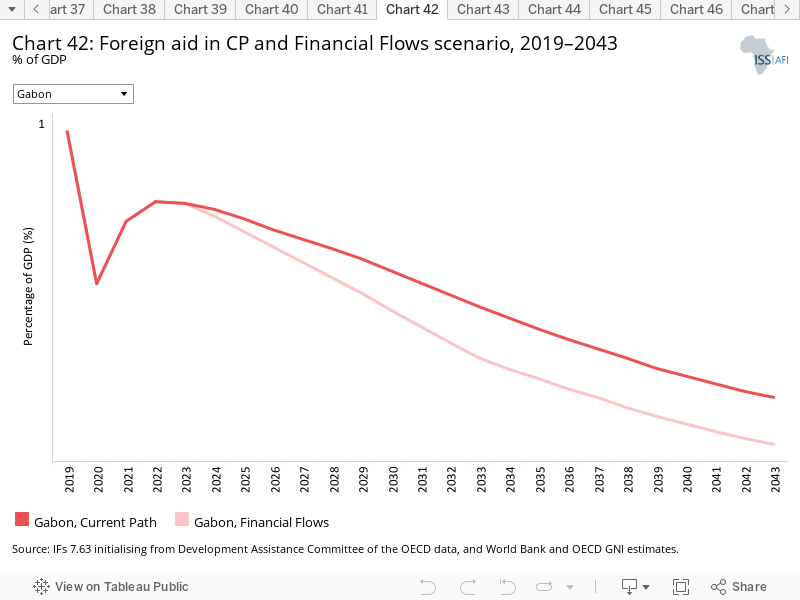
- Chart 42: Foreign aid in CP and Financial Flows scenario, 2019–2043
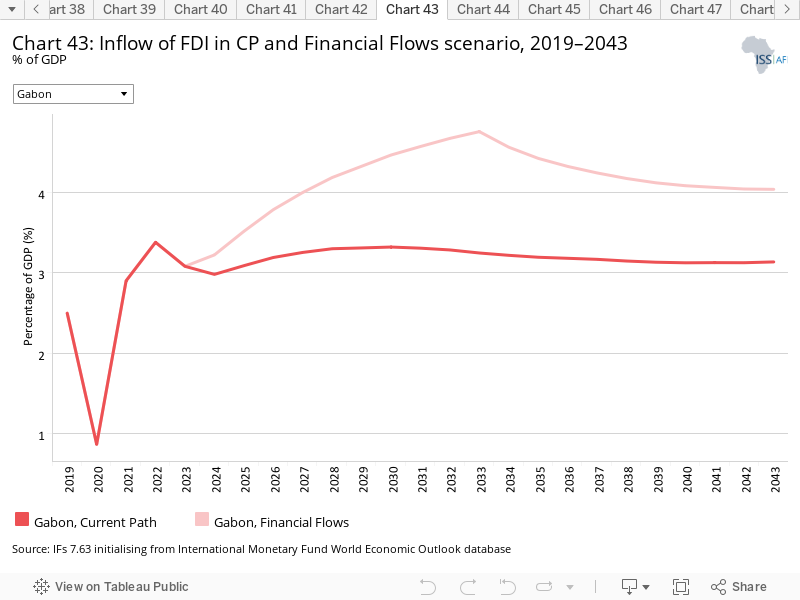
- Chart 43: Inflow of FDI in CP and Financial Flows scenario, 2019–2043
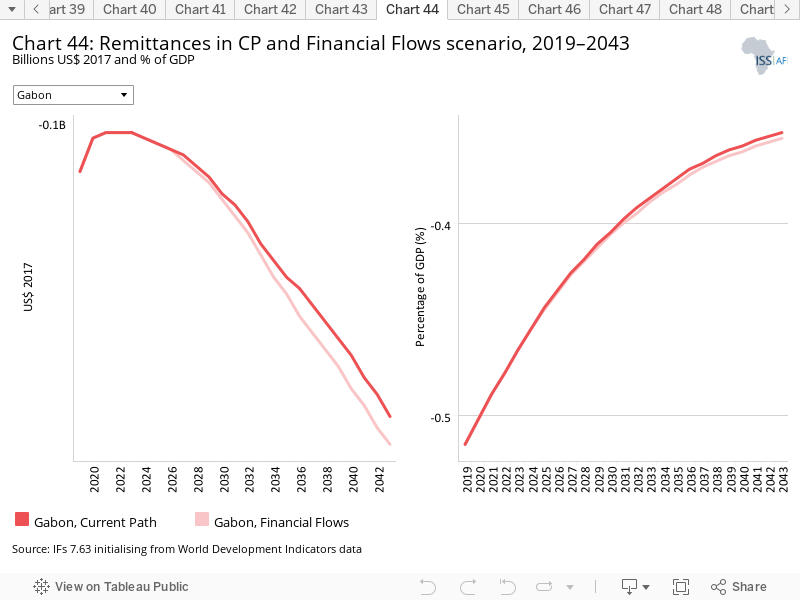
- Chart 44: Remittances in CP and Financial Flows scenario, 2019–2043
- Chart 45: GDP per capita in CP and Financial Flows scenario, 2019–2043
- Chart 46: Poverty in CP and Financial Flows scenario, 2019–2043
- Chart 47: Electricity access in CP and Infrastructure scenario, 2019–2043
- Chart 48: Rural road access in CP and Infrastructure scenario, 2019–2043
- Chart 49: GDP per capita in CP and Infrastructure scenario, 2019–2043
- Chart 50: Poverty in CP and Infrastructure scenario, 2019–2043
- Chart 51: Gov effectiveness in CP and Governance scenario, 2019–2043
- Chart 52: GDP per capita in CP and Governance scenario, 2019–2043
- Chart 53: Poverty in CP and Governance scenario, 2019–2043
- Chart 54: Carbon emissions in CP and scenarios, 2019–2043
- Chart 55: GDP per capita in CP and scenarios, 2019–2043
- Chart 56: GDP per capita in CP and Combined scenario, 2019–2043
- Chart 57: Poverty in CP and Combined scenario, 2019–2043
- Chart 58: Value added by sector in CP and Combined scenario, 2019–2043
- Chart 59: GDP in CP and Combined scenario, 2019–2043
- Chart 60: Carbon emissions in CP and Combined scenario, 2019–2043

This page provides an overview of the key characteristics of Gabon along its likely (or Current Path, CP) development trajectory. The Current Path forecast from the International Futures forecasting (IFs) platform is a dynamic scenario that imitates the continuation of current policies and environmental conditions. The Current Path is therefore in congruence with historical patterns and produces a series of dynamic forecasts endogenised in relationships across crucial global systems. We use 2019 as a standard reference year and the forecasts generally extend to 2043 to coincide with the end of the third ten-year implementation plan of the African Union’s Agenda 2063 long-term development vision.
Gabon lies on the equator, along the west coast of Central Africa. The country covers an area of about 270 000 km2 and had an estimated population of 2.2 million people in 2019. It is bordered by Equatorial Guinea to the northwest, Cameroon to the north, the Republic of the Congo to the east and south and the Gulf of Guinea to the west. There are four ecoregions: Atlantic Equatorial Coastal forest; Central African mangroves; the Gulf of Guinea central region; and the northwestern Congolian lowland forest. Gabon's capital and largest city is Libreville. The official language is French.
The Kingdom of Orungu formed in Gabon by the 18th century and became a powerful trading centre, mainly due to the slave trade. Since its independence from France in 1960, the sovereign state of Gabon has had three presidents. In the early 1990s, the country introduced a multi-party system and a new democratic constitution, which allowed for a more transparent electoral process and reformed many governmental institutions.
In 1975, Gabon became a full member of the Organization of Petroleum Exporting Countries (OPEC). The country cancelled its membership in 1995, but rejoined the organisation in 2016.
Abundant petroleum and foreign direct investment turned Gabon into one of the most prosperous countries in sub-Saharan Africa. However, because of inequality in income distribution, a significant share of the population remains poor.
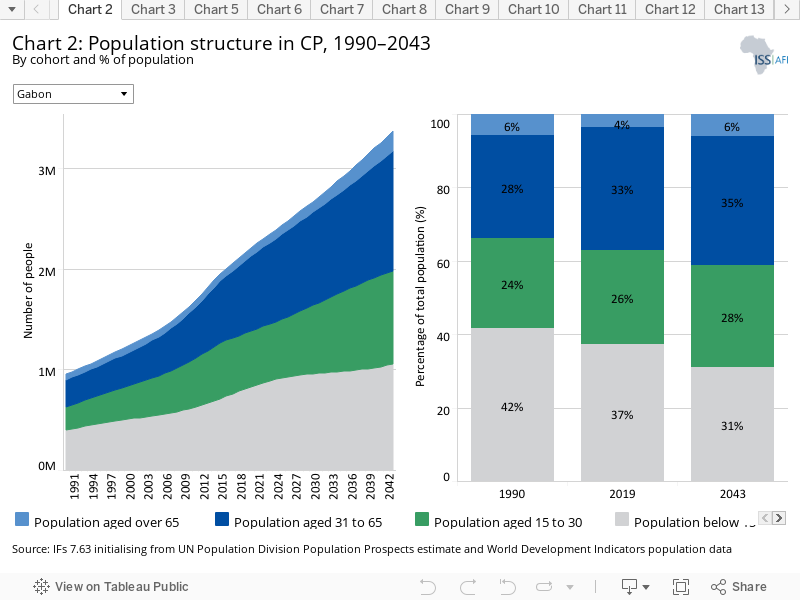
From a baseline of hardly a million people in 1990, Gabon’s population had more than doubled – to about 2.2 million people – by 2019. The country’s population is expected to increase to approximately 3.4 million people over the next two decades. In 2019, the population growth rate stood at 2.4%, 11th lowest in Africa and third lowest among upper middle-income economies in Africa.
Regardless, Gabon’s population is relatively young. In 2019, half of the population was younger than 22.4 years and 37% was younger than 15. On the Current Path, Gabon’s age structure is expected to mature further. By 2043, the share of the population under 15 years old will drop to 31%, with the older age cohorts constituting a larger share of the overall population.
Gabon has a total fertility rate of 3.9, which, by 2043, is expected to have dropped to 3.5 births per woman. As a consequence, the median age is projected to increase to 25 years.
In 2019, the country’s average life expectancy was 66.9 years. On average, women lived to 68.6 years and men to 66.9 years. Life expectancy of Gabonese citizens is expected to increase to 71.1 years over the next two decades along the Current Path, above the average life expectancy of 70 years for Africa’s upper middle-income economies.
A higher life expectancy would be a boost to Gabon’s workforce. By 2043, the country’s working-age population is expected to account for about 62.7% of the population, up from 59% in 2019. Indeed, the ratio of people of working age relative to the dependent population is improving and expected to reach its demographic ‘sweet spot’ in 2043 (from 1.4 in 2019 to 1.7 in 2043).
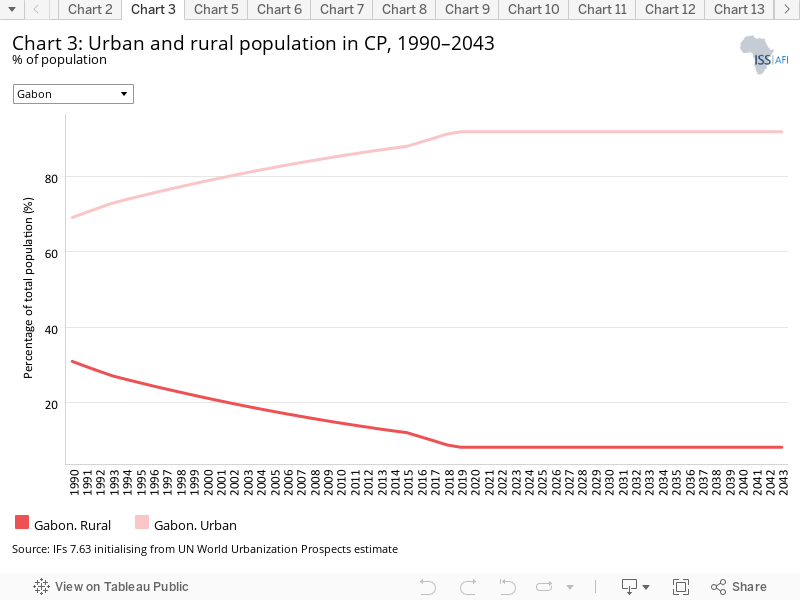
Gabon is the most urbanised country in Africa. In 2019, 92% of the country’s population lived in urban areas. The average African upper middle-income country has a ratio of 68.4% urban versus 31.6% rural citizens. Gabon’s high rate of urbanisation is not forecast to change over the coming decades.
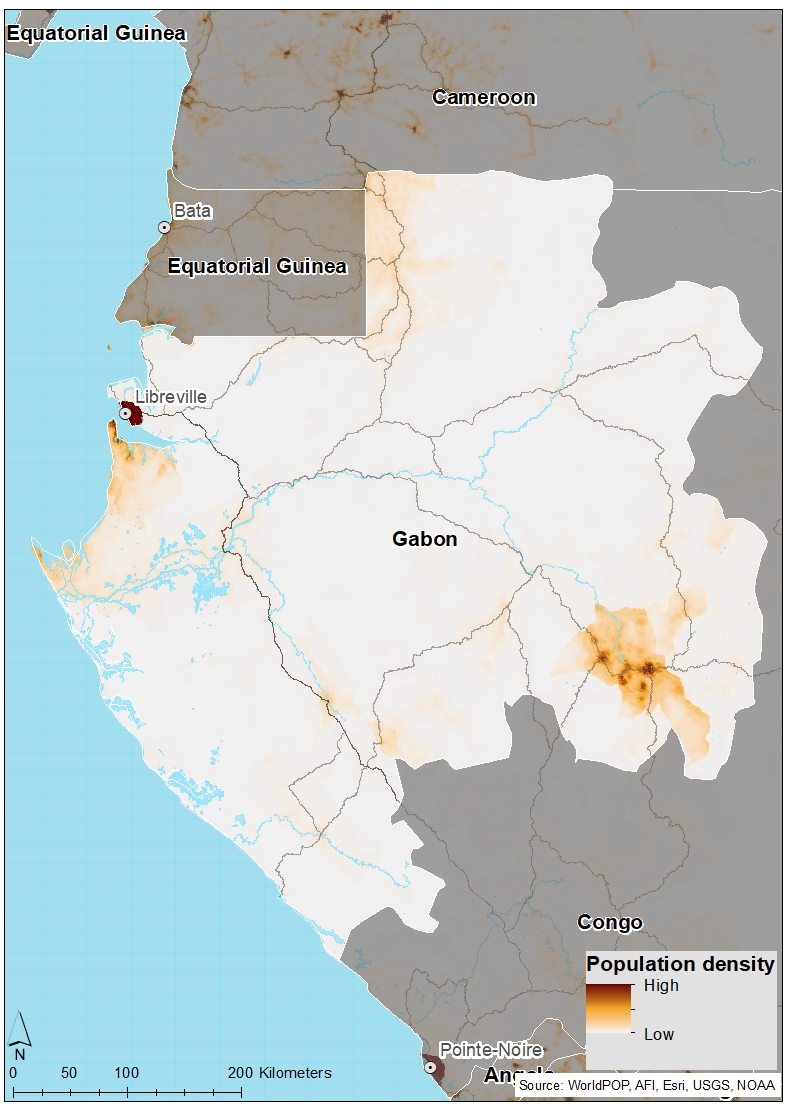
Of the approximately 2.2 million people in Gabon in 2019, about a quarter were concentrated in the country’s capital, Libreville (578 000 inhabitants) according to the World Population Review. Libreville is in the northwestern province of Estuaire. The second largest city is Port-Gentil, with close to 110 000 residents, followed by Franceville with about 43 000 residents, and Oyem and Moanda with about 30 000 residents each. At 8.4 persons per square kilometre, population density in Gabon is low. The largest ethnic group in Gabon are the Fang people, representing about a third of the country’s population.
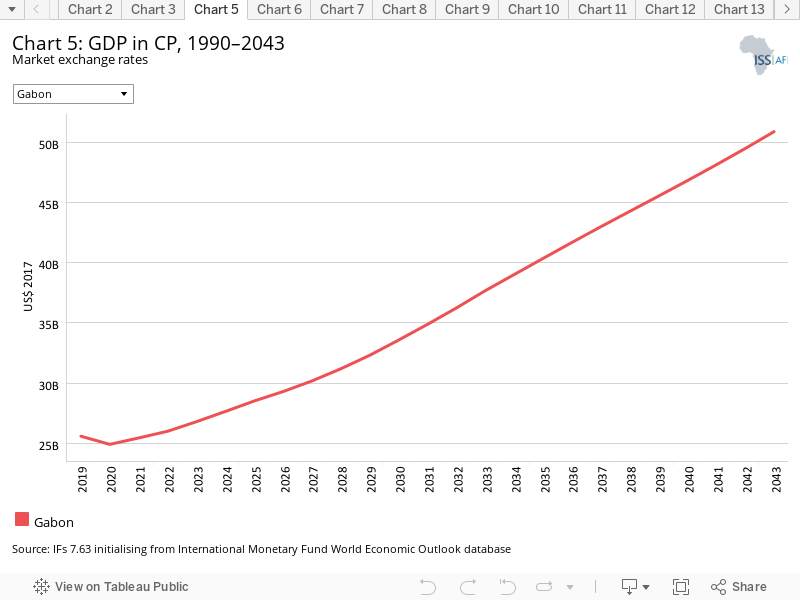
Gabon’s GDP nearly doubled between 1990 and 2019, from US$13.7 billion to US$25.6 billion. The country ranks fourth out of eight African upper middle-income economies, with Mauritius and Libya being the lead economies. In 2043, Gabon’s GDP is forecast to reach US$50.9 billion, essentially double its size in 2019.
Gabon is Africa’s fifth largest oil producer and a net oil exporter. In addition, the country possesses abundant primary materials and also has growing agriculture and tourism sectors. Other notable exports are timber, uranium and manganese.
Gabon’s oil industry started gaining attention in 1931 when several oil deposits were discovered in regions neighbouring the capital Libreville. In addition to the oil industry, the fishing industry is an important economic sector of Gabon.
Gabon is currently classified as an upper middle-income country by the World Bank, although its oil wealth has not benefited the overall population. Poverty levels are far too high given its economic status. Poverty is exacerbated by high levels of inequality. Gabon’s oil dependency for revenue makes it vulnerable to fluctuations in the global oil price.
Although many of the charts in the sectoral scenarios also include GDP per capita, this overview is an essential point of departure for interpreting the general economic outlook of Gabon.
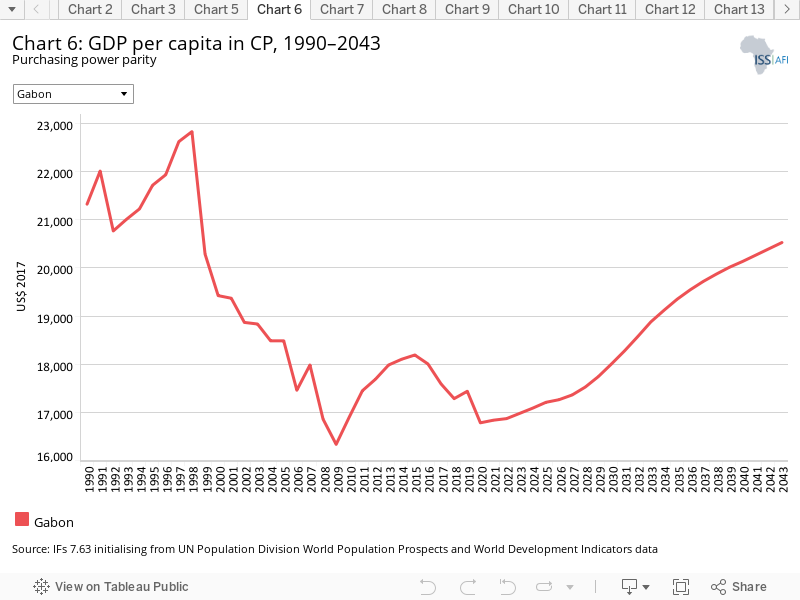
In 2019, Gabon’s GDP per capita was US$17 440, more than US$3 000 above the African upper middle-income group average of US$14 235. On the Current Path, Gabon’s per capita income will rise to US$20 525 by 2043.
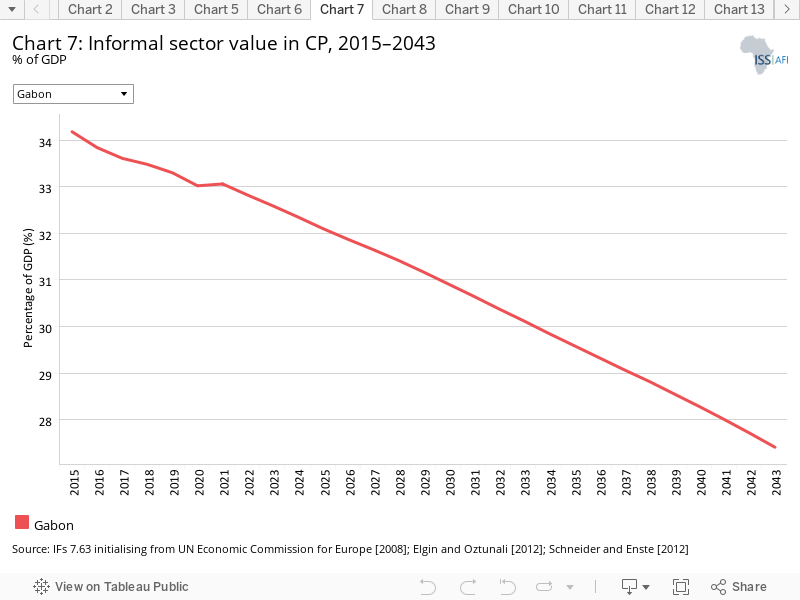
In 2019, Gabon’s informal sector contributed approximately 33% to GDP, the highest share among its upper middle-income peer economies in Africa. In Botswana, which ranks second, the informal sector accounts for only 18.7% of GDP, and the group’s average is 14%.
By 2043, Gabon’s informal sector is forecast to account for 28.9% of GDP, likely reflecting improvements in overall state capacity, including for taxation and higher incomes. However, in oil-exporting economies such as Gabon, the link between higher incomes and better governance is typically weaker than in non-oil dependent economies.
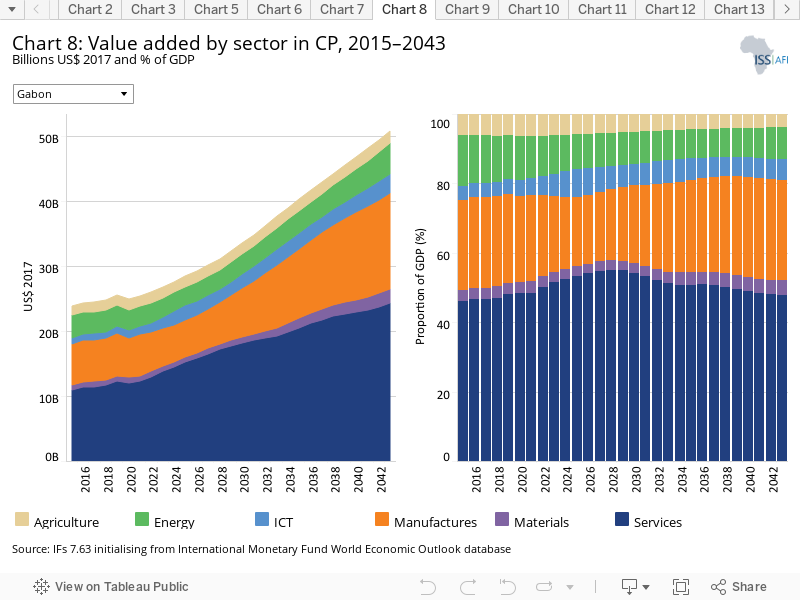
The IFs platform uses data from the Global Trade and Analysis Project (GTAP) to classify economic activity into six sectors: agriculture, energy, materials (including mining), manufactures, services and information and communications technology (ICT). Most other sources use a threefold distinction between only agriculture, industry and services with the result that data may differ.
In 2019, Gabon’s service sector accounted for 46% of GDP, the equivalent of US$12.3 billion, followed by manufactures, which represented about 26.1% (US$6.2 billion). Agriculture contributed US$1.4 billion, representing 6.1% of GDP, followed by energy at 14.8% (US$3.5 billion). In the future, the service sector is expected to remain the most important contributor to Gabon’s GDP, forecast to account for 48% of GDP by 2043 at a value of US$24.4 billion. The manufacturing sector is also expected to remain more or less at 2019 levels (28% of GDP; US$14.7 billion). The contribution of the energy sector is forecast to drop to 9.3% of GDP (US$4.7 billion).
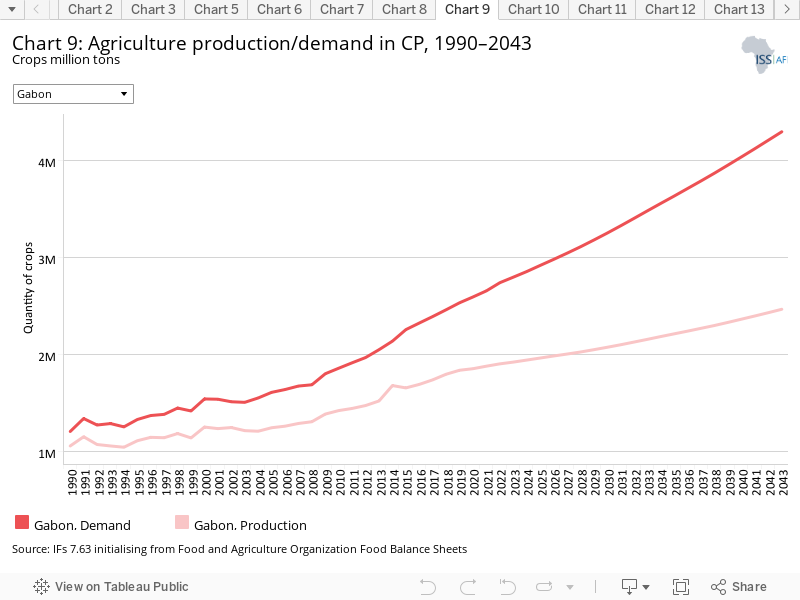
The data on agricultural production and demand in the IFs forecasting platform initialises from data provided on food balances by the Food and Agriculture Organization (FAO). IFs contains data on numerous types of agriculture but aggregates its forecast into crops, meat and fish, presented in million metric tons. Chart 9 shows agricultural production and demand as a total of all three categories.
In 2019, Gabon’s crop yield was 1.8 million metric tons per hectare. It is expected to increase to 2.5 million metric tons per hectare by 2043.
Gabon’s agricultural production does not meet its current domestic demand, which stood at 2.5 million metric tons in 2019. The current gap of almost 0.7 million metric tons is expected to increase to 1.8 million metric tons by 2043. Population growth is fuelling agricultural demand.
There are numerous methodologies and approaches to defining poverty. We measure income poverty and use GDP per capita as a proxy. In 2015, the World Bank adopted the measure of US$1.90 per person a day (in 2011 international prices), also used to measure progress towards the achievement of Sustainable Development Goal 1 of eradicating extreme poverty. To account for extreme poverty in richer countries occurring at slightly higher levels of income than in poor countries, the World Bank introduced three additional poverty lines in 2017:
- US$3.20 for lower middle-income countries
- US$5.50 for upper middle-income countries
- US$22.70 for high-income countries.
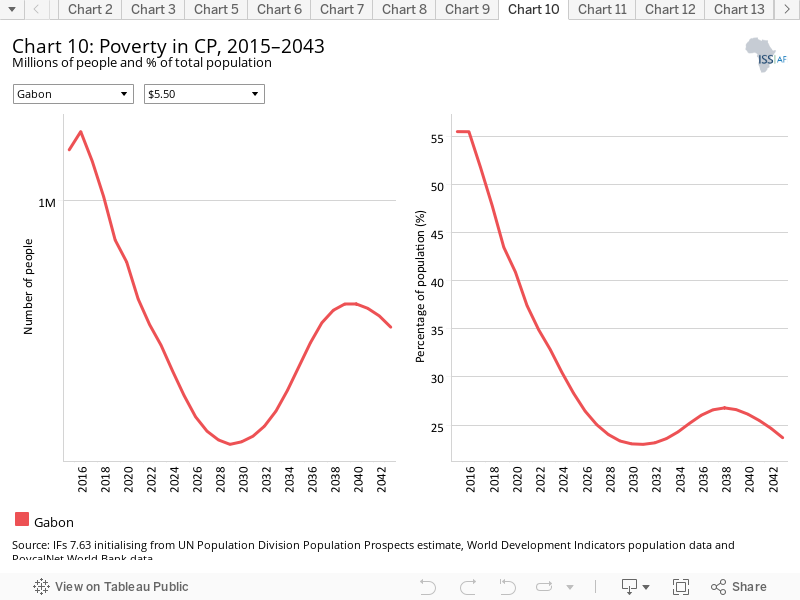
As an upper middle-income country, Gabon uses the US$5.50 benchmark to define extreme poverty. The country’s poverty burden is high considering its GDP per capita. In 2019, 43.5% of the population was living below the poverty line, corresponding to 940 000 people. However, Gabon’s poverty rate lies 2.4 percentage points below the average of its upper middle-income peer group on the continent (45.91%).
On the Current Path, the number of people living in extreme poverty in Gabon will drop to 800 000 people by 2043, representing a poverty rate of 23.7%. This is a reduction of more than 45 percentage points. The average African upper middle-income country will have a poverty rate of 39.7% by 2043. In 2019, Gabon had the fourth highest poverty rate among Africa’s upper middle-income economies.
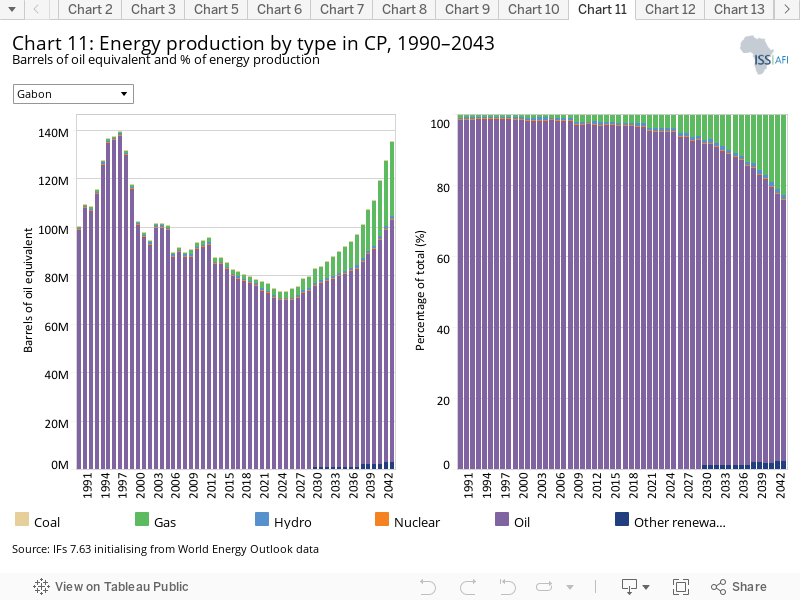
The IFs platform forecasts six types of energy, namely oil, gas, coal, hydro, nuclear and other renewables. To allow comparisons between different types of energy, the data is converted into billion barrels of oil equivalent (BOE). The energy contained in a barrel of oil is approximately 5.8 million British thermal units (MBTUs) or 1 700 kilowatt-hours (kWh) of energy.
In 2019, Gabon’s total energy production was about 99 million barrels of oil, estimated to increase marginally to 100 million barrels by 2043. The country’s current energy mix is heavily reliant on oil, which accounted for over 99% of total production in 2019. In 2043, it will still account for 74%, with gas making up the rest.
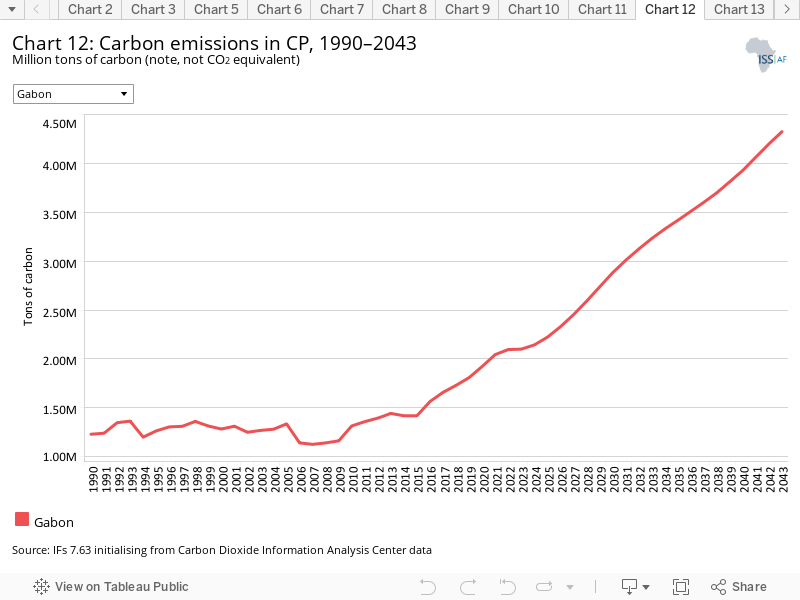
Carbon is released in many ways, but the three most important contributors to greenhouse gases are carbon dioxide (CO2), carbon monoxide (CO) and methane (CH4). Since each has a different molecular weight, IFs uses carbon. Many other sites and calculations use CO2 equivalent.
Gabon emitted 1.8 million tons of carbon in 2019. Carbon emissions are forecast to increase to 4.3 million tons by 2043.
Sectoral Scenarios for Gabon
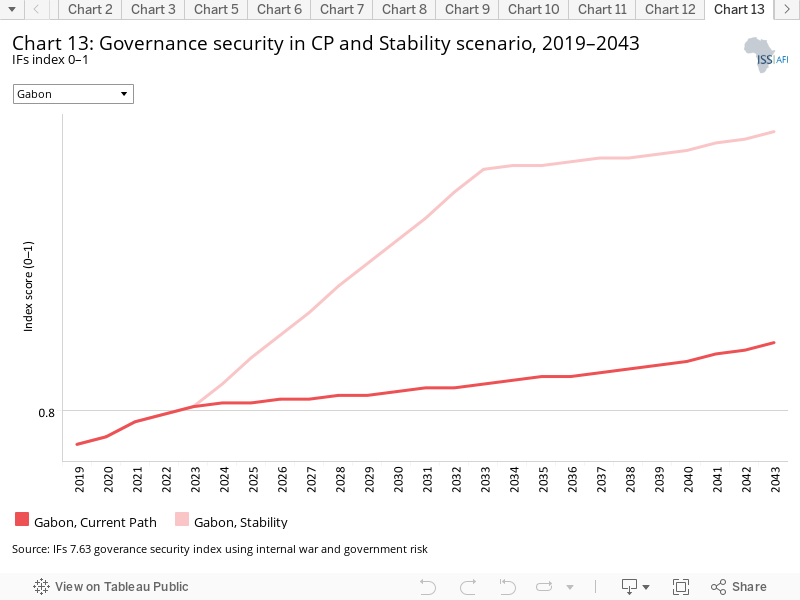
Download to pdfThe Stability scenario represents reasonable but ambitious reductions in risk of regime instability and lower levels of internal conflict. Stability is generally a prerequisite for other aspects of development and this would encourage inflows of foreign direct investment (FDI) and improve business confidence. Better governance through the accountability that follows substantive democracy is modelled separately.
The intervention is explained here in the thematic part of the website.
In 2019, Gabon scored 0.79 on the IFs governance security index. Among upper middle-income economies in Africa, only Mauritius and Botswana have higher scores (0.89 and 0.8, respectively). In the Stability scenario, governance security in Gabon is projected to improve to a score of 0.87 by 2043 compared with 0.82 on the Current Path. By then, its income peer group on the continent is projected to score slightly worse: 0.84 versus 0.77 on the Current Path.
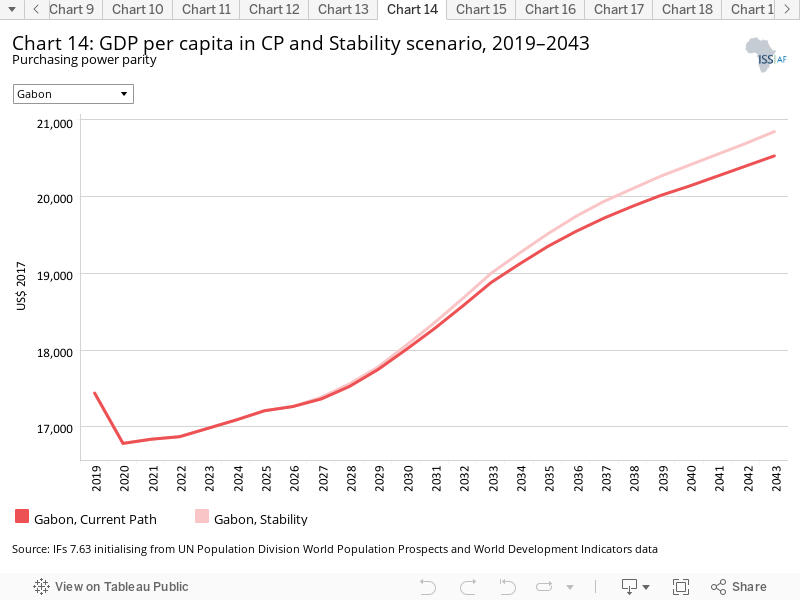
In 2019, Gabon’s GDP per capita was US$17 440. The interventions in the Stability scenario are forecast to increase it to US$20 841 by 2043 compared with US$20 525 on the Current Path. In the Stability scenario, the GDP per capita of the continent’s upper middle-income economies is projected to stand at US$18 192 by 2043.
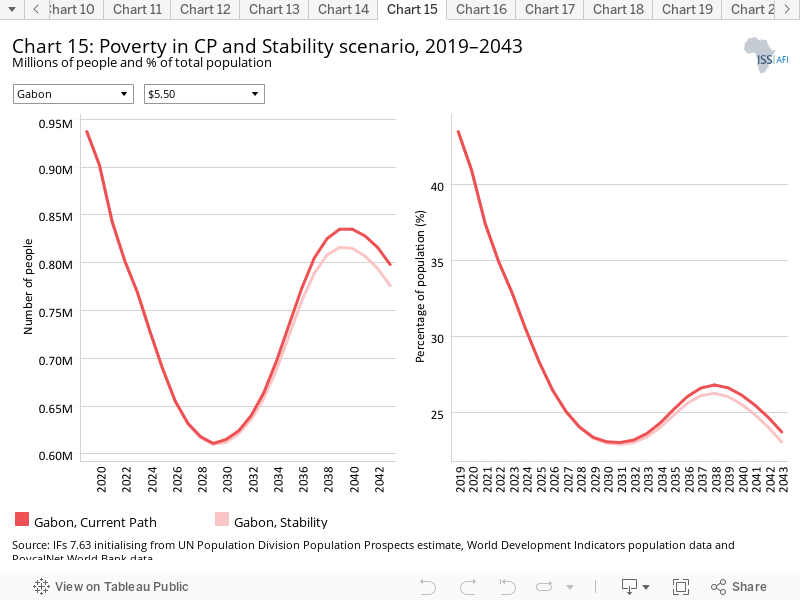
The Stability scenario has the potential to reduce the number of people living in extreme poverty from 940 000 in 2019 to 780 000 in 2043, compared with the Current Path forecast of 800 000 people. Gabon’s poverty rate could drop from 43.5% in 2019 to 23% by 2043 compared with 23.7% in the Current Path forecast. In other words, with the interventions included in the Stability scenario, Gabon could speed up its poverty reduction efforts.
This section presents the impact of a Demographic scenario that aims to hasten and increase the demographic dividend through reasonable but ambitious reductions in the communicable-disease burden for children under five, the maternal mortality ratio and increased access to modern contraception.
The intervention is explained here in the thematic part of the website.
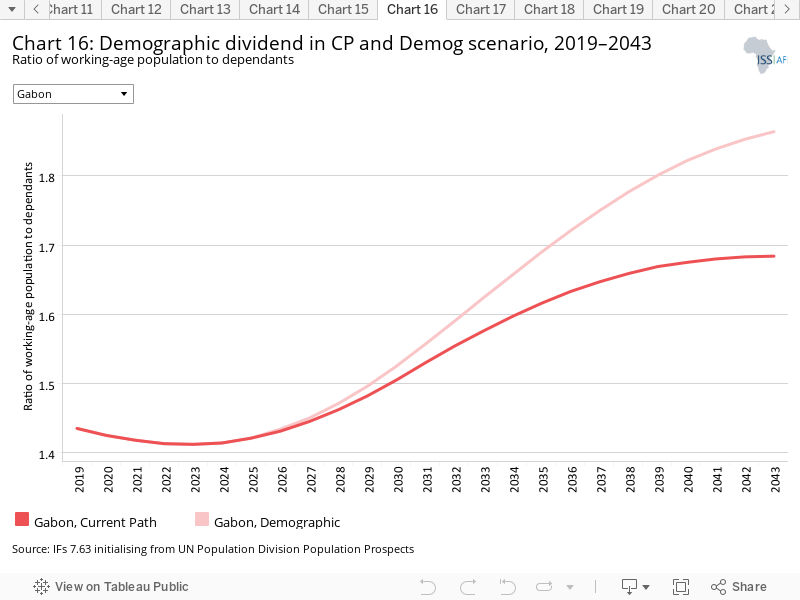
Demographers typically differentiate between a first, second and even a third demographic dividend. We focus here on the contribution of the size and quality of the labour force to incomes. It refers to a window of opportunity that opens when the ratio of the working-age population (between 15 and 64 years of age) to dependents (children and the elderly) is equal to or reaches 1.7.
Increasing access to modern contraception will bring down Gabon’s total fertility rate more quickly than on the Current Path: from 3.9 births per woman in 2019 to 2.5 by 2043 versus 3 births on the Current Path. A lower total fertility rate would slow down Gabon’s population growth and bring about a faster change in the population age structure. The latter will result in a more favourable ratio between people of working age and dependants, especially children.
With the interventions in the Demographic scenario, Gabon has the potential to accelerate its demographic transition by increasing the ratio between workers and dependants from 1.44 in 2019 to 1.86 by 2043, compared with 1.68 on the Current Path. Africa’s upper middle-income economies would, on average, reach a ratio of 2.04 by 2043, up from 1.85 in 2019.
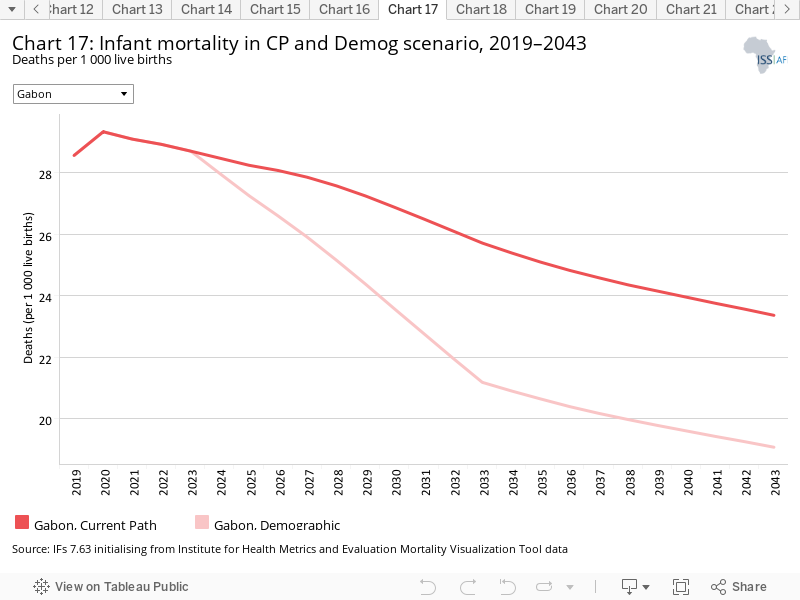
The infant mortality rate is the number of infant deaths per 1 000 live births and is an important marker of the overall quality of the health system in a country.
Infant mortality in Gabon is high (28.6 infant deaths per 1 000 live births in 2019), although it has basically halved from the level in 1990 (55.5 per 1 000 lives births). The Demographic scenario could bring down Gabon’s infant mortality rate to 19.1 deaths per 1 000 live births by 2043, compared with 24 on the Current Path.
Gabon does better than the average African upper middle-income economy, for which the interventions in the Demographic scenario could reduce infant mortality to 21.6 deaths per 1 000 live births by 2043. However, compared with the average upper middle-income economy globally, Gabon performs much worse. On average, the latter is set to reduce its infant mortality rate from 12.2 in 2019 to 7.62 by 2043 on the Current Path.
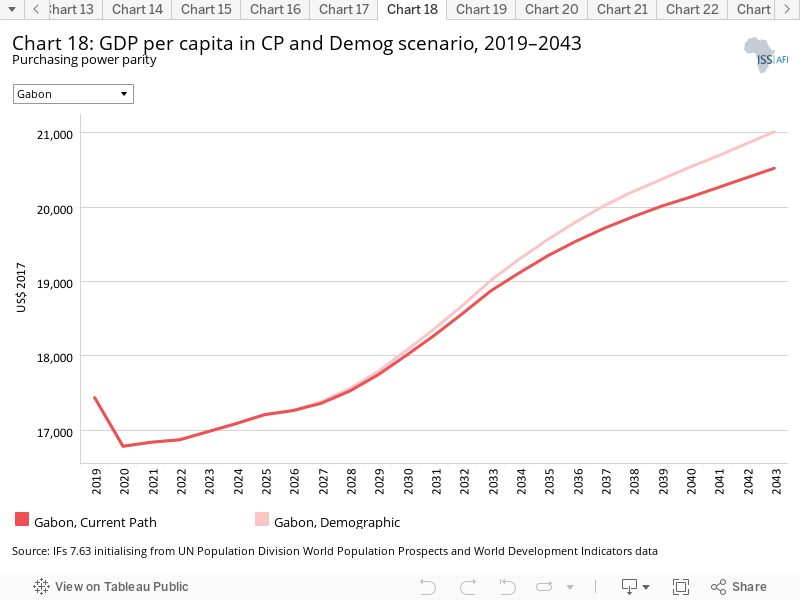
In 2019, Gabon had a GDP per capita of US$17 440. By 2043, the Demographic scenario could push it to US$21 015 versus US$20 525 on the Current Path.
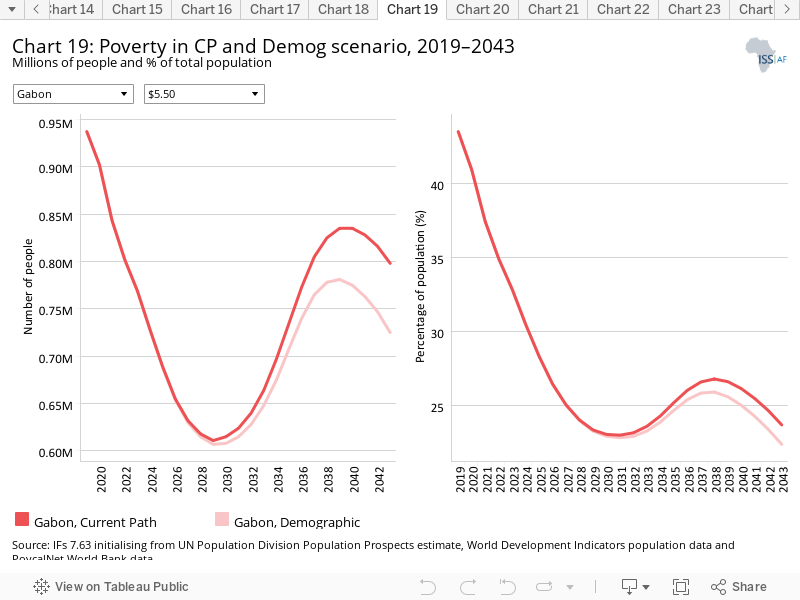
Compared with the Current Path, the Demographic scenario could reduce the number of people living in extreme poverty by 210 000 by 2043. An expected total of 730 000 people (22.4% of the population) would be living below the poverty line by then, compared with 23.7% in the Current Path. Gabon will continue to perform above the average of its upper middle-income peers in Africa. On average, the group of Africa’s upper middle-income economies is projected to have a poverty rate of 39.6% in the Demographic scenario.
This section presents reasonable but ambitious improvements in the Health/WaSH scenario, which include reductions in the mortality rate associated with both communicable diseases (e.g. AIDS, diarrhoea, malaria and respiratory infections) and non-communicable diseases (NCDs) (e.g. diabetes), as well as improvements in access to safe water and better sanitation. The acronym WaSH stands for water, sanitation and hygiene.
The intervention is explained here in the thematic part of the website.
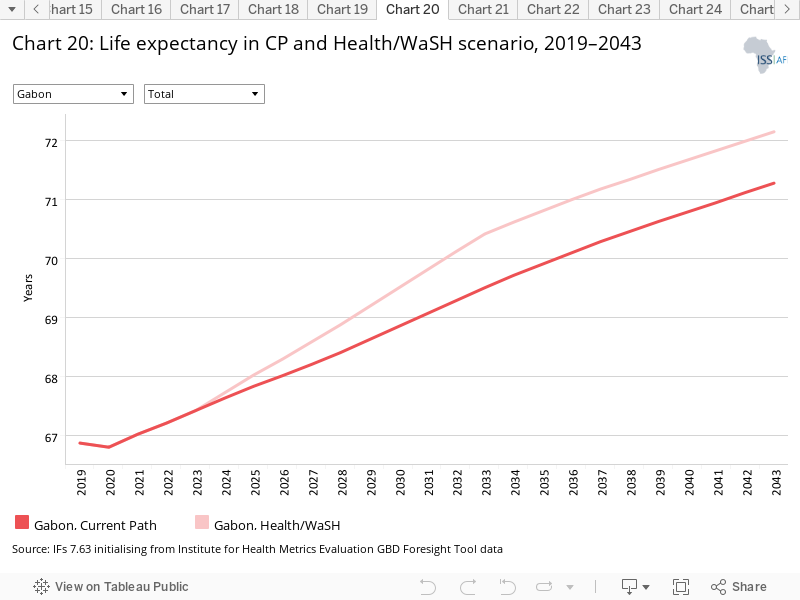
The Health/WaSH scenario has the potential to increase life expectancy in Gabon from 66.9 years in 2019 to 72.1 years by 2043 versus 71.1 years on the Current Path. Gabon performs better on life expectancy than the average African upper middle-income economy. In 2019, the average upper middle-income African country had a life expectancy of 64.5 years, lower than that of Gabon (66.9 years). In the Current Path forecast, life expectancy in Gabon will increase to 71.3 years by 2043, slightly lower than what is projected in the Health/WaSH scenario (72.1 years).
The Health/WaSH scenario will have a positive impact on Gabon’s infant mortality rate, which could drop from 28.6 deaths per 1 000 live births in 2019 to 21.7 by 2043. An infant mortality rate of 24 deaths per 1 000 live births is expected on the Current Path.
Gabon performs better than the average upper middle-income economy in Africa, for which an infant mortality rate of 25.9 deaths per 1 000 live births is expected by 2043 on the Current Path. In the Health/WaSH scenario the rate is expected to be 23.4 deaths per 1 000 live births.
The Agriculture scenario represents reasonable but ambitious increases in yields per hectare (reflecting better management and seed and fertilizer technology), increased land under irrigation and reduced loss and waste. Where appropriate, it includes an increase in calorie consumption, reflecting the prioritisation of food self-sufficiency above food exports as a desirable policy objective.
The intervention is explained here in the thematic part of the website.
The data on yield per hectare (in metric tons) is for crops but does not distinguish between different categories of crops.
In 2019, crop yields in Gabon stood at 3.5 metric tons per hectare, which is below the average of 4.71 metric tons per hectare for upper middle-income countries in Africa. According to the Current Path forecast, yields in Gabon will have increased by 40% by 2043 (reaching 4.9 metric tons per hectare). In contrast, yields could increase by more than 73% over the same time period, to just over 6 metric tons per hectare, in the Agriculture scenario. This scenario would allow Gabon to outperform the average upper middle-income economy on the continent, which would have an average yield of 5 metric tons per hectare.
In 2019, net agricultural imports accounted for 29.3% of Gabon’s demand. On the Current Path, agricultural demand is increasingly outpacing production, which will lead to greater import dependence. By 2043, net agricultural imports are expected to account for 43.2% of agricultural demand. The Agriculture scenario has the potential to increase production to meet the increase in demand and maintain the 2019 level of import dependence despite a growing population. By 2043, imports would account for 29.3% of agricultural demand.
The Agriculture scenario is expected to push Gabon’s GDP per capita to US$20 743 by 2043, compared with the Current Path forecast of US$20 525.
The Education scenario represents reasonable but ambitious improved intake, transition and graduation rates from primary to tertiary levels and better quality of education. It also models substantive progress towards gender parity at all levels, additional vocational training at secondary school level and increases in the share of science and engineering graduates.
The intervention is explained here in the thematic part of the website.
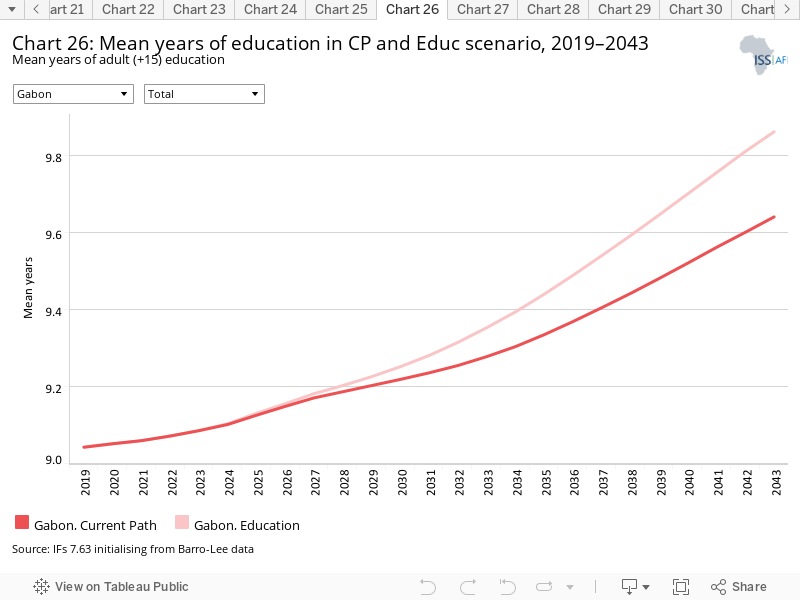
With a mean of nine years of education among the adult population in 2019, Gabon’s educational outcomes are 0.8 years below the average for Africa’s group of upper middle-income economies. Educational outcomes for girls are better than for boys (9.6 versus 8.5 years).
The Education scenario has the potential to increase Gabon’s mean years of education to 9.9 by 2043, an improvement of almost a year compared with what it was in 2019. In the Current Path forecast, an adult in Gabon is expected to have attained 9.6 years of education by 2043. Female education outcomes would still be better than those for males (10.1 versus 9.6 years of education). The average mean for the African upper middle-income group was 9.8 years of education in 2019. By 2043, this is expected to increase to 10.4 years on the Current Path.
The average mean years of education for the global group of upper middle-income economies in 2019 was 8.8. In other words, Gabon performs worse than the African upper middle-income average but better than the global upper middle-income average. Gabon ranks 17th out of 25 economies in the latter comparison.
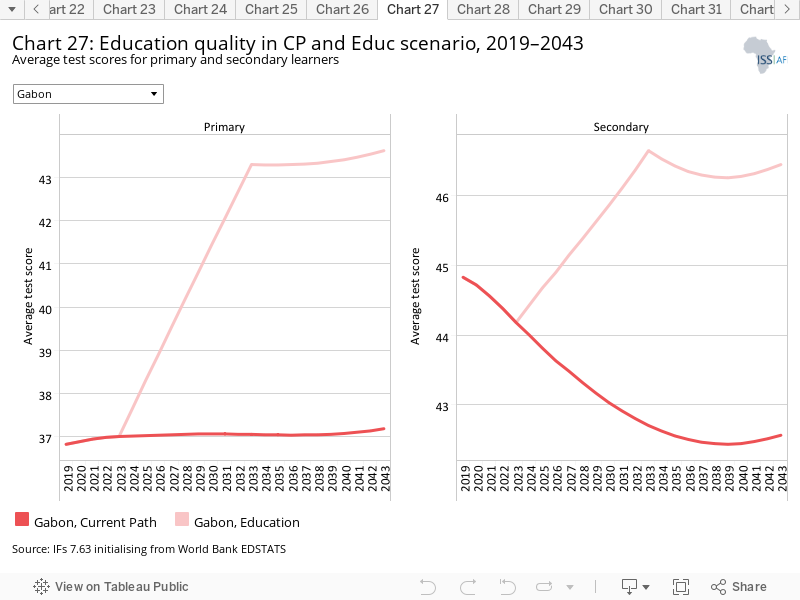
Gabon’s average primary test score in 2019 was 36.8. According to the Current Path forecast, it will improve only slightly, to 37.2, by 2043. The Education scenario is expected to accelerate improvements significantly, pushing average test scores for primary learners to 43.6 by 2043, an increase of 6.4 percentage points compared to the Current Path forecast for 2043. The Education scenario is also expected to improve test scores at the secondary level. The latter could improve from 44.8 in 2019 to 46.5 by 2043, compared with an expected drop to 42.6 on the Current Path.
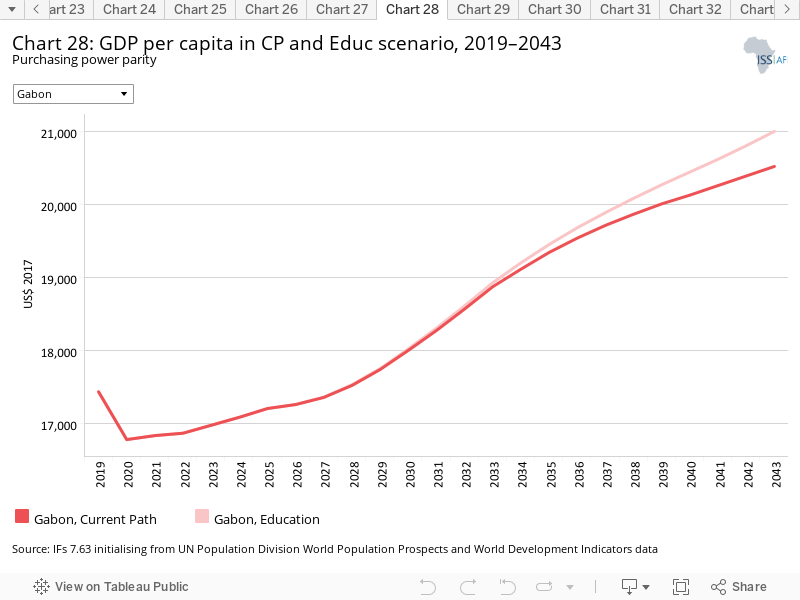
Gabon’s GDP per capita will increase to US$20 525 on the Current Path, compared with US$21 004 in the Education scenario, a difference of US$479. This will be US$3 266 more than the average for an upper middle-income African country in 2043.
In the Education scenario, it is expected that 22.3% of Gabon’s population will live in extreme poverty by 2043, down from 43.5% in 2019 and compared with 23.7% according to the Current Path forecast. This translates to a projected total of 750 000 poor people in 2043, compared with 800 000 people in the Current Path forecast.
The Manufacturing/Transfers scenario represents reasonable but ambitious manufacturing growth through greater investment in the economy, investments in research and development, and promotion of the export of manufactured goods. It is accompanied by an increase in welfare transfers (social grants) to moderate the initial increases in inequality that are typically associated with a manufacturing transition. To this end, the scenario improves tax administration and increases government revenues.
The intervention is explained here in the thematic part of the website.
Chart 30 should be read with Chart 8, which presents a stacked area graph on the contribution to GDP and size, in billion US$, of the Current Path economy for each of the sectors.
In the Manufacturing/Transfers scenario, the service sector will experience the largest gain in terms of its relative contribution to GDP. Its contribution is expected to have increased by 0.16 percentage points in 2043. Services is followed by Manufactures, which is projected to see its relative contribution to GDP increase by 0.12 percentage points by 2043. ICT and Materials will both see smaller gains (0.09 and 0.01 percentage points, respectively.
The value of the service sector is forecast to increase by US$1.2 billion in the Manufacturing/Transfers scenario compared with the Current Path forecast. The Manufacturing/Transfers scenario has the potential for the manufacturing sector to contribute US$800 million more to the economy by 2043 than in the Current path. The ICT sector is expected to contribute an additional US$200 000 in this scenario, followed by materials at US$100 000.
In the Manufacturing/Transfers scenario, government welfare transfers are forecast to more than double, from US$1.74 billion in 2019 to close to US$4 billion by 2043. On the Current Path, transfers are expected to grow at a slower rate, reaching US$3.2 billion by 2043.
Gabon’s GDP per capita is expected to increase by US$654 in the Manufacturing/Transfers scenario compared to the Current Path (US$21 179 versus US$20 525).
For Gabon, the Manufacturing/Transfers scenario has the potential to reduce the share of the population living in extreme poverty from 43.5% in 2019 to 21.3% by 2043, compared with 23.7% on the Current Path. This is a 2.4 percentage point improvement, which would translate to about 80 000 people escaping poverty by 2043 via the interventions in the Manufacturing/Transfers scenario. Gabon’s poverty rate would be significantly below the average poverty rate in its upper middle-income peer group: 21.3% versus 37.8%.
The Leapfrogging scenario represents a reasonable but ambitious adoption of and investment in renewable energy technologies, resulting in better access to electricity in urban and rural areas. The scenario includes accelerated access to mobile and fixed broadband and the adoption of modern technology that improves government efficiency and allows for the more rapid formalisation of the informal sector.
The intervention is explained here in the thematic part of the website.
Fixed broadband includes cable modem Internet connections, DSL Internet connections of at least 256 KB/s, fibre and other fixed broadband technology connections (such as satellite broadband Internet, ethernet local area networks, fixed-wireless access, wireless local area networks, WiMAX, etc.).
Gabon, like most African upper middle-income economies, had a low fixed broadband rate of 1.8 subscriptions per 100 people in 2019. In the Leapfrogging scenario, fixed broadband subscriptions are set to increase to 47.9 per 100 people by 2043, compared with 23.7 on the Current Path. Gabon performs below average compared with its income peer group on the continent, which recorded an average of 4.4 subscriptions in 2019. By 2043, this rate is expected to increase to 49.7 in the Leapfrogging scenario; in the Current Path forecast it will be 29.6.
Mobile broadband refers to wireless Internet access delivered through cellular towers to computers and other digital devices.
In 2019, Gabon had 111.3 mobile broadband subscriptions per 100 people, significantly more than the average of 86.4 subscriptions per 100 people for Africa’s upper middle-income economies.
The Leapfrogging scenario has the potential to push mobile broadband subscriptions in Gabon to 154.3 per 100 people by 2043. However, even on the Current Path, the country is expected to arrive at 153.6 subscriptions by then. The greatest benefit of the interventions of the Leapfrogging scenario plays out in the medium term (between 2023 and 2027), when projected subscriptions will be tangibly higher than in the Current Path forecast. In other words, mobile broadband subscriptions in Gabon are expected to increase rapidly either way, but more quickly in the Leapfrogging scenario.
In 2019, 92% of Gabon’s population had access to electricity. In the Leapfrogging scenario, electricity access is projected to increase to almost universal access (98.5%), compared with 93.6% on the Current Path.
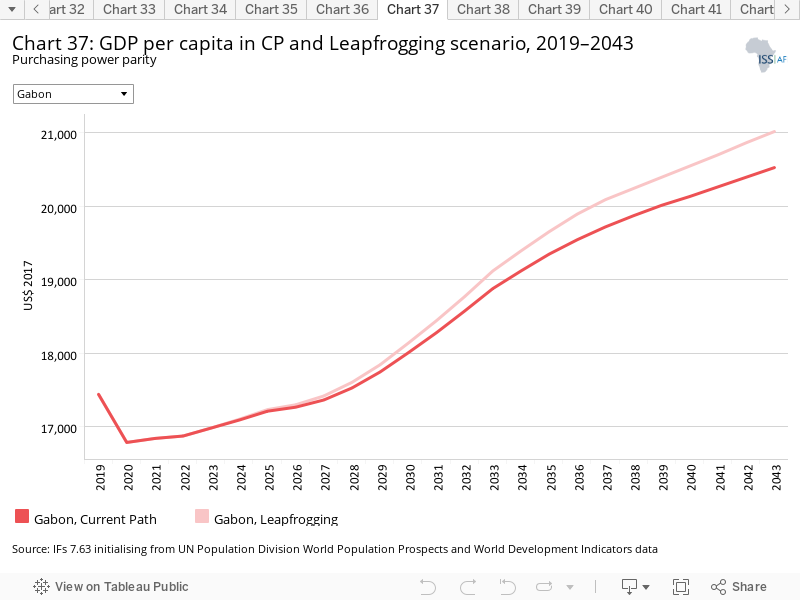
In the Leapfrogging scenario, Gabon’s GDP per capita is expected to experience a larger increase than on the Current Path: from US$17 440 in 2019 to US$21 015 compared with US$20 525.
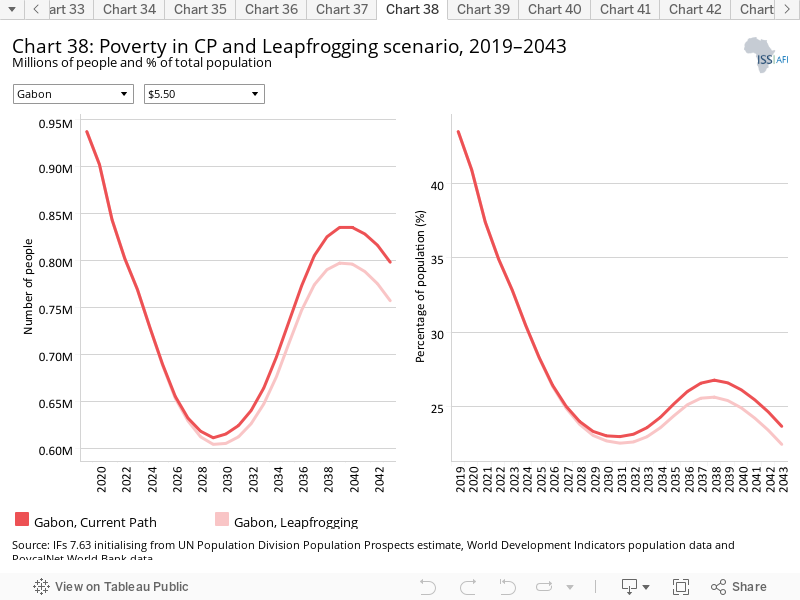
The interventions in the Leapfrogging scenario are projected to benefit poverty reduction efforts in Gabon. The share of the population living below the poverty line could almost halve, from 43%.5 in 2019 to 22.5% by 2043, compared with 23.7% on the Current Path trajectory. In absolute numbers, the Leapfrogging scenario would reduce the number of people living in poverty to 760 000 versus a projected 800 000 in the Current Path forecast.
The Free Trade scenario represents the impact of the full implementation of the African Continental Free Trade Area (AfCFTA) by 2034 through increases in exports, improved productivity and increased trade and economic freedom.
The intervention is explained here in the thematic part of the website.
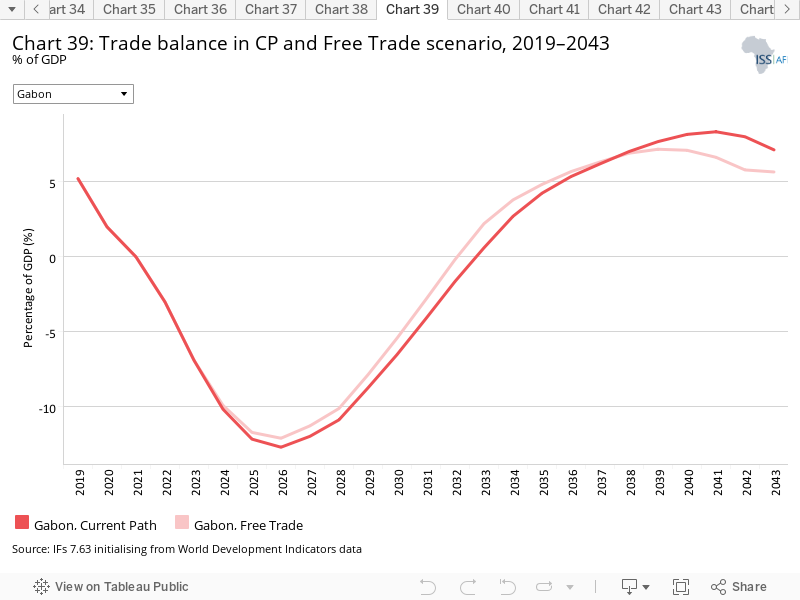
The trade balance is the difference between a country's exports and the value of a country's imports. A country that imports more goods and services than it exports in terms of value has a trade deficit, while a country that exports more goods and services than it imports has a trade surplus.
In 2019, Gabon had a trade deficit that accounted for 5.2% of GDP. Under the Free Trade scenario, the country’s trade balance is set to worsen, with the deficit likely to account for 12.2% of GDP by 2026. The trade deficit will subsequently start decreasing again, reaching 5.65% by 2043 versus 7.13% on the Current Path. The initial worsening of the trade account (until 2026) reflects the effects of the initial displacement of uncompetitive firms if trade opens up. As the competitive firms adopt and improve production and processes, exports are boosted and the trade deficit reduces.
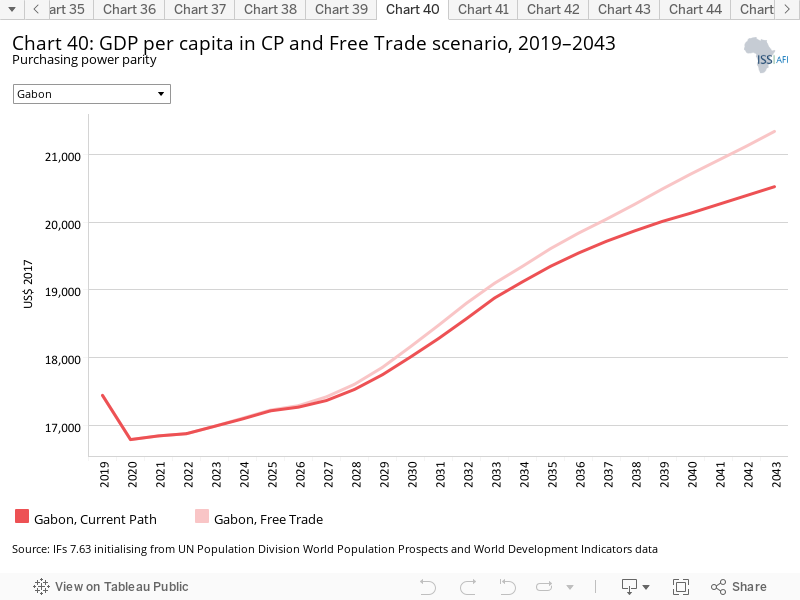
In the Free Trade scenario, Gabon’s GDP per capita is expected to experience a larger increase than on the Current Path: from US$17 440 in 2019 to US$21 342 by 2043, versus US$20 525.
Trade openness will reduce poverty in the long term after initially increasing it, owing to the redistributive effects of trade. Most African countries export primary commodities and low-tech manufacturing products, and therefore a continental free trade agreement (AfCFTA) that reduces tariffs and non-tariff barriers across Africa will increase competition among countries in primary commodities and low-tech manufacturing exports. Countries with inefficient, high-cost manufacturing sectors might be displaced as the AfCFTA is implemented, thereby pushing up poverty rates. In the long term, as the economy adjusts and produces and exports its comparatively advantaged (lower relative cost) goods and services, poverty rates will decline.
In the Free Trade scenario, extreme poverty in Gabon is expected to decrease more rapidly than on the Current Path. By 2043, 20.8% of people are forecast to live in extreme poverty compared with 23.7% in the Current Path forecast. The 2.9 percentage point difference translates into 100 000 people able to escape poverty. In the Free Trade scenario, the average poverty level in Africa’s upper middle-income economies is projected to be 37.7% by 2043.
The Financial Flows scenario represents a reasonable but ambitious increase in worker remittances and aid flows to poor countries, and an increase in the stock of foreign direct investment (FDI) and additional portfolio investment inflows to middle-income countries. We also reduced outward financial flows to emulate a reduction in illicit financial outflows.
The intervention is explained here in the thematic part of the website.
At 0.73% of GDP in 2019, foreign aid did not play an important role in the Gabonese economy. In comparison, aid made up 8.6% of GDP in upper middle-income economies on the continent. In both the Current Path and the Financial Flows scenario, the contribution of foreign aid to the economy is projected to become less significant by 2043, dropping to 0.37% of GDP in the Financial Flows scenario and to 0.43% on the Current Path.
In Africa’s upper middle-income economies, aid will account for on average 3.79% of GDP on the Current Path and 4.19% of GDP in the Financial Flows scenario.
FDI flows to Gabon accounted for almost 2.5% of GDP in 2019. The impact of the COVID-19 pandemic on FDI flows manifests in the sharp drop (to 0.9%) in 2020. In the Financial Flows scenario, FDI as a share of GDP is projected to recover and slightly surpass pre-pandemic levels. By 2043, FDI flows are set to account for 4% of Gabon’s GDP, compared with 3% in the Current Path forecast. In Africa’s lower middle-income economies, FDI is expected to account for 3.8% of GDP in the Financial Flows scenario and for 3% on the Current Path.
In 2019, remittances accounted for 0.5% of Gabon’s GDP. The Financial Flows scenario makes no difference to the evolution of remittances in Gabon. On both the Current Path and the Financial Flows scenario, remittances are expected to account for 0.4% by 2043.
In the Financial Flows scenario, Gabon’s GDP per capita is expected to rise to US$20 884 compared with US$20 525 on the Current Path, a difference of US$359.
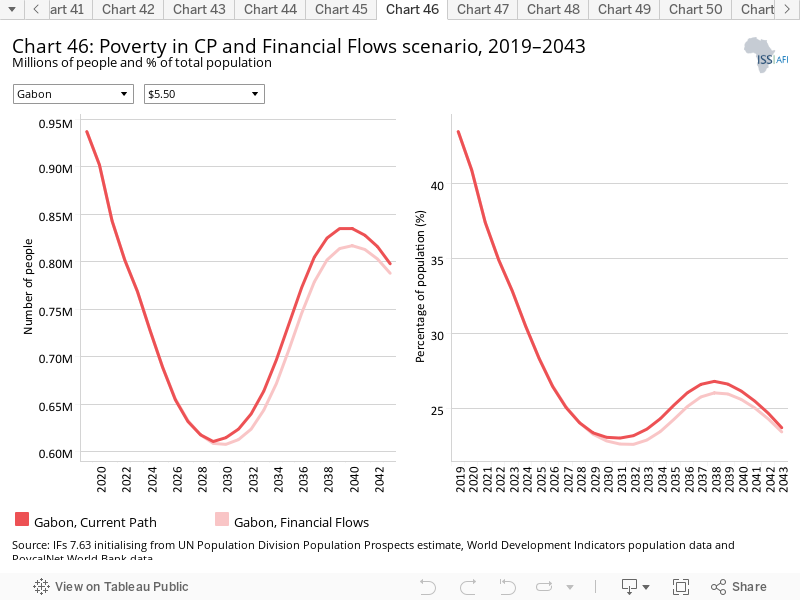
The interventions in the Financial Flows scenario do not have a noticeable effect on reducing poverty rapidly in Gabon. The share of the population living in extreme poverty is expected to drop to 23.4% by 2043, compared with 23.7% in the Current Path forecast. This means that 790 000 people instead of 800 000 would be living below the poverty line by 2043 in this scenario.
The Infrastructure scenario represents a reasonable but ambitious increase in infrastructure spending across Africa, focusing on basic infrastructure (roads, water, sanitation, electricity access and ICT) in upper middle-income countries and increasing emphasis on advanced infrastructure (such as ports, airports, railway and electricity generation) in higher-income countries.
Note that health and sanitation infrastructure is included as part of the Health/WaSH scenario and that ICT infrastructure and more rapid uptake of renewables are part of the Leapfrogging scenario. The interventions there push directly on outcomes, whereas those modelled in this scenario increase infrastructure spending, indirectly boosting other forms of infrastructure, including that supporting health, sanitation and ICT.
The intervention is explained here in the thematic part of the website.
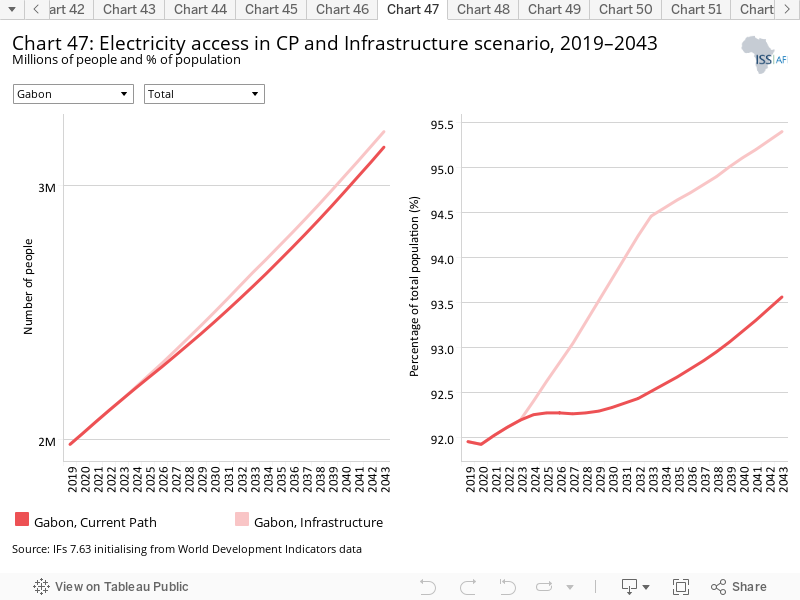
In 2019, about 92% of Gabon’s population had access to electricity, equivalent to almost 2 million people. In urban areas, access rates reached 94.2% versus 67.8% in rural areas. The interventions in the Infrastructure scenario have the potential to increase Gabon’s overall electricity access rate to 95.4% by 2043 compared with 93.6% on the Current Path.
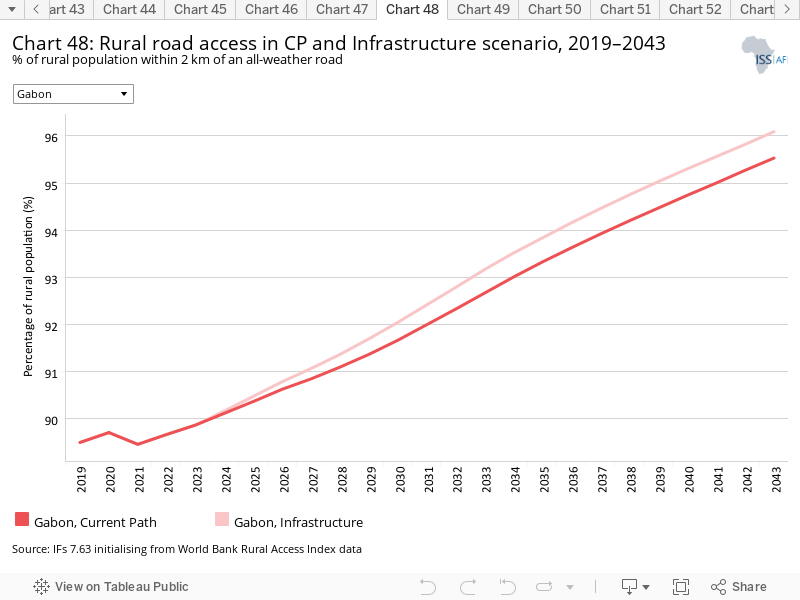
Indicator 9.1.1 in the Sustainable Development Goals refers to the proportion of the rural population who live within 2 km of an all-season road and is captured in the Rural Access Index.
Investments in rural road infrastructure are associated with positive socio-economic impacts, such as increased rural incomes and poverty reduction, improving health and agricultural productivity. In 2019, 90.5% of Gabon’s rural population had access to an all-weather road. The average access rate in Africa’s upper middle-income economies is 83.5%. The Infrastructure scenario would still benefit rural Gabon, although only marginally because the country is coming from such a high base. By 2043, it is projected that 96% of the rural population will have access to an all-weather road within 2 km, compared with 95% of people in the Current Path forecast.
Improvements brought on by the Infrastructure scenario are expected to push GDP per capita from US$17 440 in 2019 to US$20 677 by 2043, US$152 above the Current Path forecast.
In the Infrastructure scenario, the share of Gabonese living in extreme poverty is expected to drop from 43.5% in 2019 to 23.4% by 2043. This is a small improvement compared to the Current Path forecast of 23.7%. It means that 790 000 people would be living in extreme poverty compared to 800 000 on the Current Path.
The Governance scenario represents a reasonable but ambitious improvement in accountability and reduces corruption, and hence improves the quality of service delivery by government.
The intervention is explained here in the thematic part of the website.
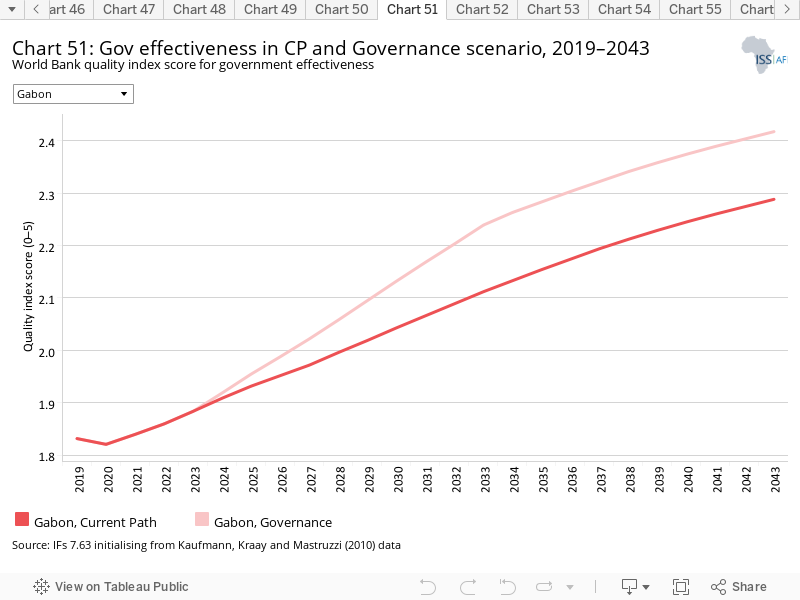
As defined by the World Bank, government effectiveness ‘captures perceptions of the quality of public services, the quality of the civil service and the degree of its independence from political pressures, the quality of policy formulation and implementation, and the credibility of the government’s commitment to such policies’.
Chart 51 presents the impact of the interventions in the Governance scenario on government effectiveness.
In 2019, Gabon’s score of 1.8 ranked fifth within its upper middle-income peer group. Mauritius and Botswana were the group’s frontrunners. By 2043, Gabon’s government effectiveness score is projected to improve to 2.3 and 2.4 in the Current Path forecast and the Governance scenario, respectively. Africa’s upper middle-income economies could reach an average score of 2.8 in the Governance scenario, essentially the same as on the Current Path.
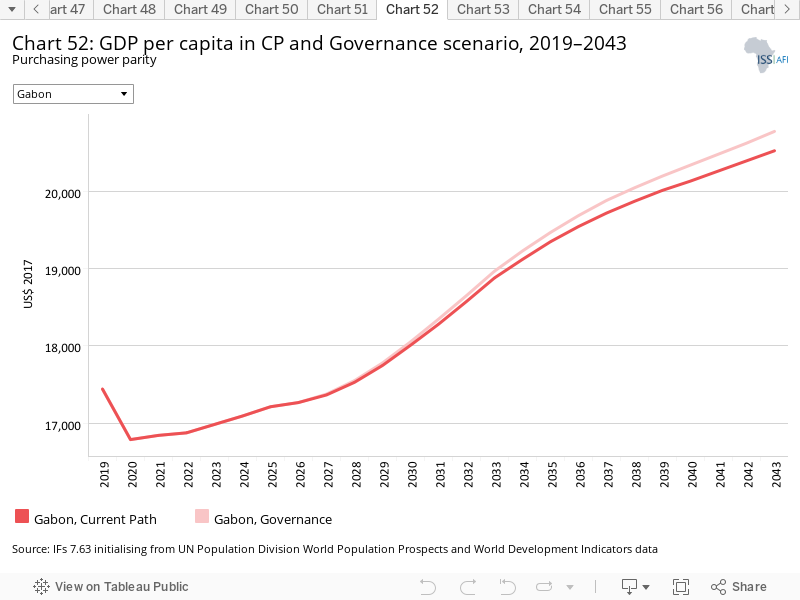
On the Current Path, GDP per capita in Gabon is expected to increase to US$20 525 while the interventions in the Governance scenario have the potential to push it to US$20 775 by 2043, above the US$17 734 for the average upper middle-income African country.
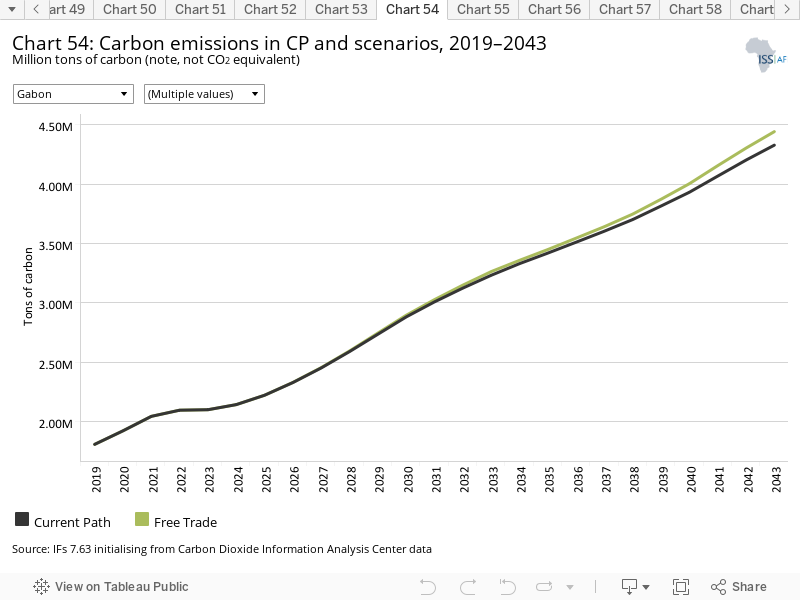
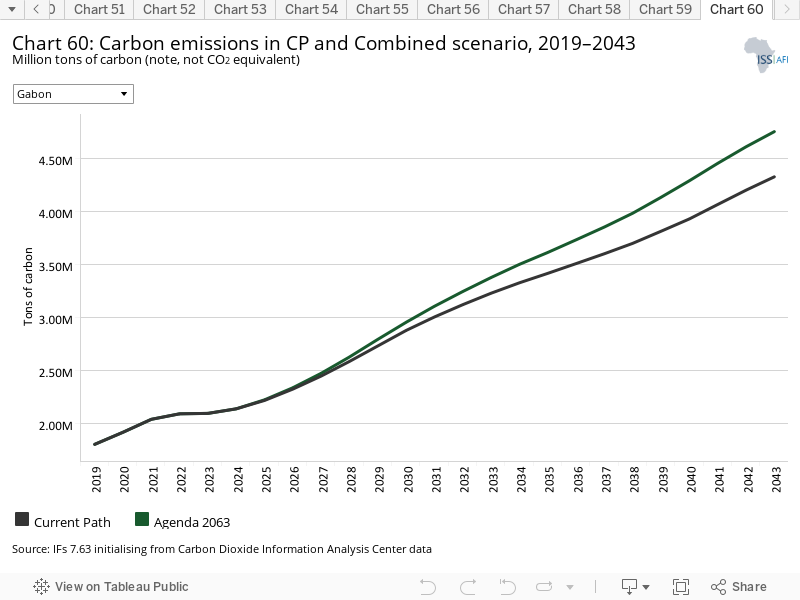
This section presents projections for carbon emissions in the Current Path for Gabon and the 11 scenarios. Note that IFs uses carbon equivalents rather than CO2 equivalents.
Gabon’s carbon emissions are projected to increase the most under the Agenda 2063 scenario, which combines all the sectoral scenarios. According to the Combined Agenda 2063 scenario, Gabon is projected to emit 4.8 million tons of carbon by 2043, 2.6 times the amount of emissions in 2019 (1.8 million tons) and 500 000 tons more than on the Current Path (4.3 million tons by 2043). The greater increase in the Combined Agenda 2063 scenario is the result of higher economic growth, which means greater demand for energy.
Among the sectoral interventions, the Free Trade, Manufacturing/Transfers and the Financial Flows scenarios are expected to have the greatest impact on carbon emissions by 2043, resulting in emissions of about 4.4 million tons.
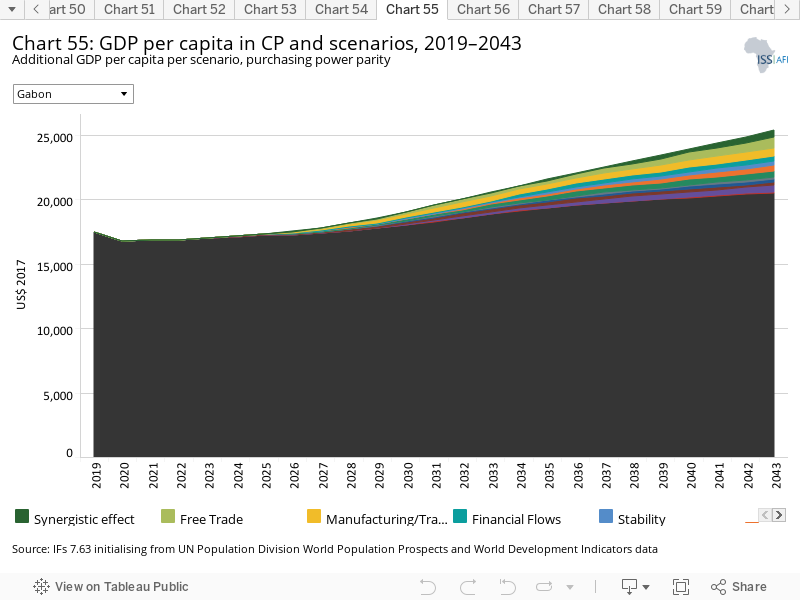
The Combined Agenda 2063 scenario consists of the combination of all 11 sectoral scenarios presented above, namely the Stability, Demographic, Health/WaSH, Agriculture, Education, Manufacturing/Transfers, Leapfrogging, Free Trade, Financial Flows, Infrastructure and Governance scenarios. The cumulative impact of better education, health, infrastructure, etc. means that countries get an additional benefit in the integrated IFs forecasting platform that we refer to as the synergistic effect. Chart 55 presents the contribution of each of these 12 components to GDP per capita in the Combined Agenda 2063 scenario as a stacked area graph.
The Combined Agenda 2063 scenario could increase Gabon’s GDP per capita by an additional US$4 839. Among the sectoral interventions, the Free Trade scenario is projected to have the greatest impact on GDP per capita, leading to an increase of US$818 by 2043. The second and third largest impact on GDP per capita could be achieved in the Manufacturing/Transfers and Financial Flows scenarios, raising GDP per capita by US$654 and US$360, respectively.
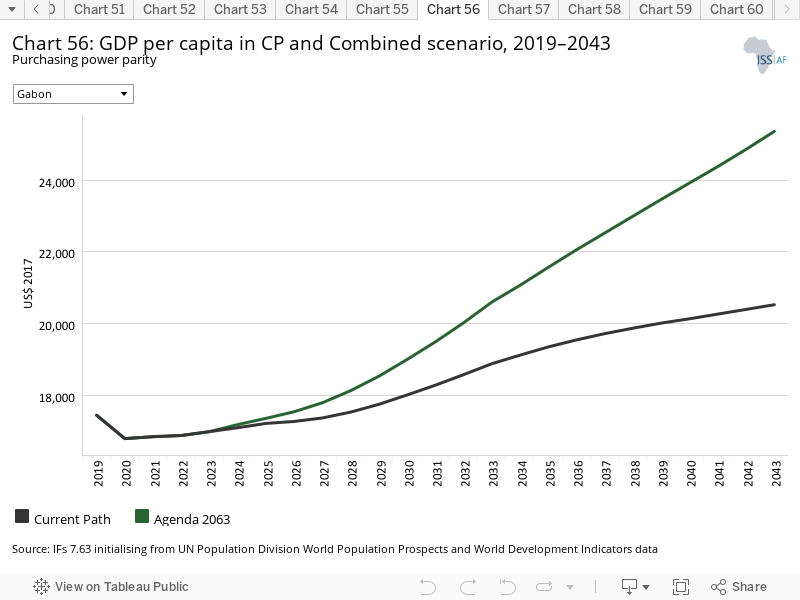
Whereas Chart 55 presents a stacked area graph on the contribution of each scenario to GDP per capita as well as the additional benefit or synergistic effect, Chart 56 presents only GDP per capita in the Current Path forecast and the Combined Agenda 2063 scenario.
In the Combined Agenda 2063 scenario, Gabon’s GDP per capita could increase by an additional US$4 839 and reach US$25 364 by 2043, compared with US$20 525 on the Current Path.
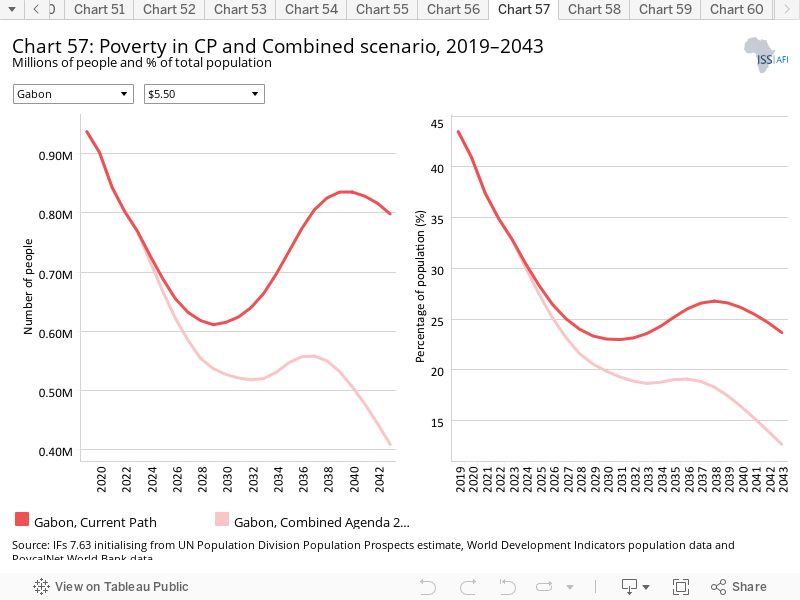
In the Combined Agenda 2063 scenario, Gabon can get closer to eliminating extreme poverty and push the share of the population living in poverty down to 12.7% by 2043, the equivalent of 410 000 people. In comparison, in the Current Path forecast, 23.7% of the population (800 000 people) is projected to live in poverty. This is double the forecast of the Combined Agenda 2063 scenario.
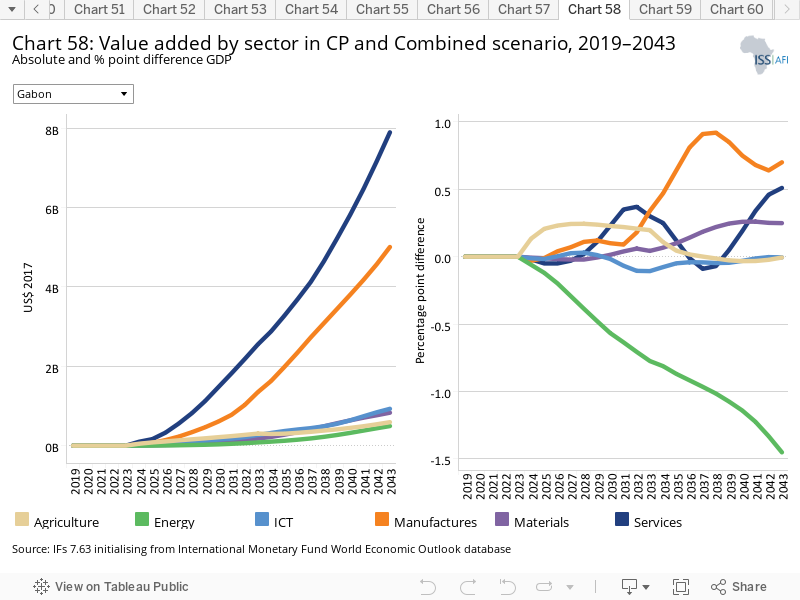
See Chart 8 to view the Current Path forecast of the sectoral composition of the economy.
In the Combined Agenda 2063 scenario, the manufacturing and the service sectors will experience the greatest increase in their relative contribution to Gabon’s GDP compared with the Current Path forecast by 2043: an additional 0.7 and 0.5 percentage points, respectively. This translates into an increase of US$5 billion in GDP, attributable to manufacturing alone and US$7.9 attributable to services. The two sectors are followed by growth in the materials sector, which is forecast to experience an increase of 0.2 percentage points compared with the Current Path, an addition of US$800 million.
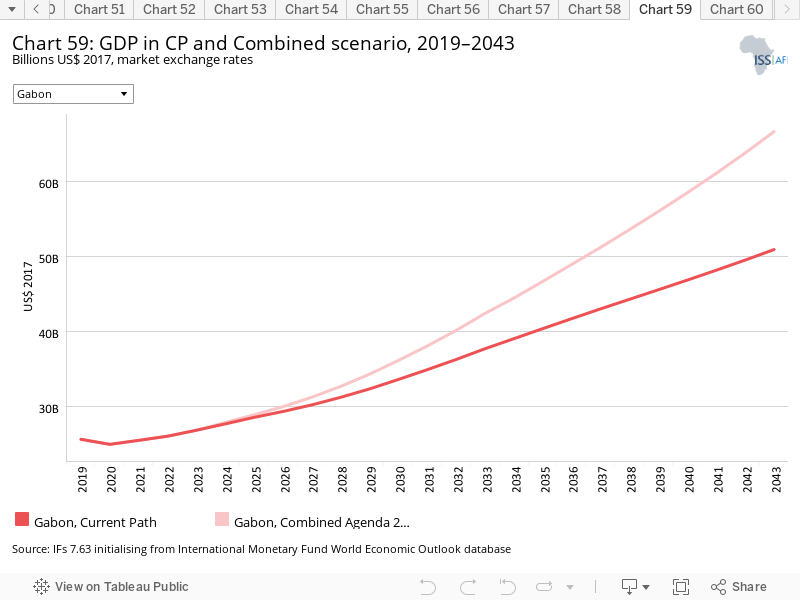
In the Combined Agenda 2063 Gabon’s GDP is forecast to expand from US$25.6 billion to US$66.7 billion by 2043. This is a difference of US$15.8 billion compared with the Current Path forecast. In other words, in the Combined Agenda 2063 scenario, Gabon’s GDP would essentially be more than 30% larger than on the Current Path.
Page information
Contact at AFI team is Mustapha Jobarteh
This entry was last updated on 30 June 2024 using IFs v7.63.
Donors and sponsors


Reuse our work
- All visualizations, data, and text produced by African Futures are completely open access under the Creative Commons BY license. You have the permission to use, distribute, and reproduce these in any medium, provided the source and authors are credited.
- The data produced by third parties and made available by African Futures is subject to the license terms from the original third-party authors. We will always indicate the original source of the data in our documentation, so you should always check the license of any such third-party data before use and redistribution.
- All of our charts can be embedded in any site.
Cite this research
Mustapha Jobarteh (2025) Gabon. Published online at futures.issafrica.org. Retrieved from https://futures.issafrica.org/geographic/countries/gabon/ [Online Resource] Updated 30 June 2024.