 Ethiopia
Feedback welcome
Our aim is to use the best data to inform our analysis. See our About page for information on the IFs forecasting platform. We appreciate your help and references for improvements via our feedback form.
In this entry, we first describe the Current Path (CP) forecast for Ethiopia as it is expected to unfold to 2043, the end of the third ten-year implementation plan of the African Union’s Agenda 2063 long-term vision for Africa. The Current Path in the International Futures (IFs) forecasting model initialises from country-level data that is drawn from a range of data providers. We prioritise data from national sources.
The Current Path forecast is divided into summaries on demographics, economics, poverty, health/WaSH and climate change/energy. A second section then presents a single positive scenario for potential improvements in stability, demographics, health/WaSH, agriculture, education, manufacturing/transfers, leapfrogging, free trade, financial flows, infrastructure, governance and the impact of various scenarios on carbon emissions. With the individual impact of these sectors and dimensions having been considered, a final section presents the impact of the Combined Agenda 2063 scenario.
We generally review the impact of each scenario and the Combined Agenda 2063 scenario on gross domestic product (GDP) per person and extreme poverty except for Health/WaSH that uses life expectancy and infant mortality.
The information is presented graphically and supported by brief interpretive text.
All US$ numbers are in 2017 values.
Summary
- Current Path forecast
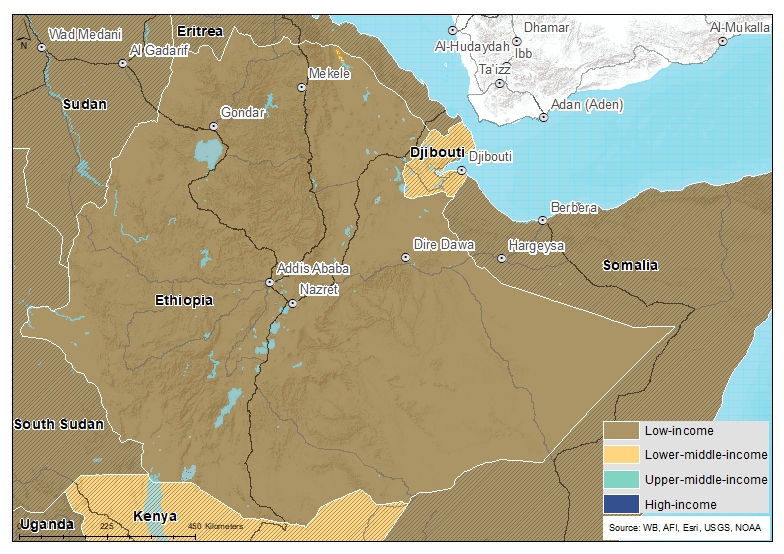
- Ethiopia is the second most populous country in Africa after Nigeria. The country has a surface area of 1 104 million km². It is a low-income country and is a member of the Intergovernmental Authority on Development (IGAD). Jump to forecast: Current Path
- The population of Ethiopia was about 112 million in 2019, and in the Current Path forecast, it is projected to rise to 192.2 million by 2043, about a 71.45% increase over the next 24 years. Jump to Demographics: Current Path
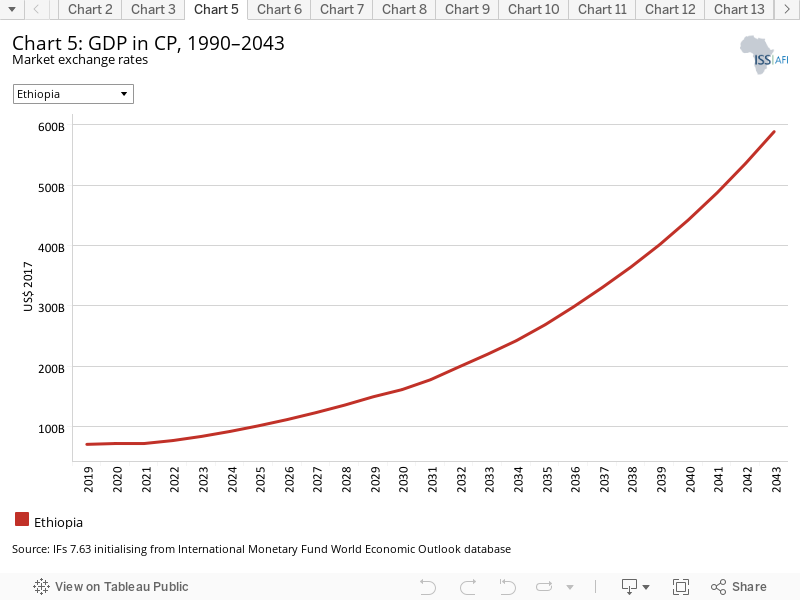
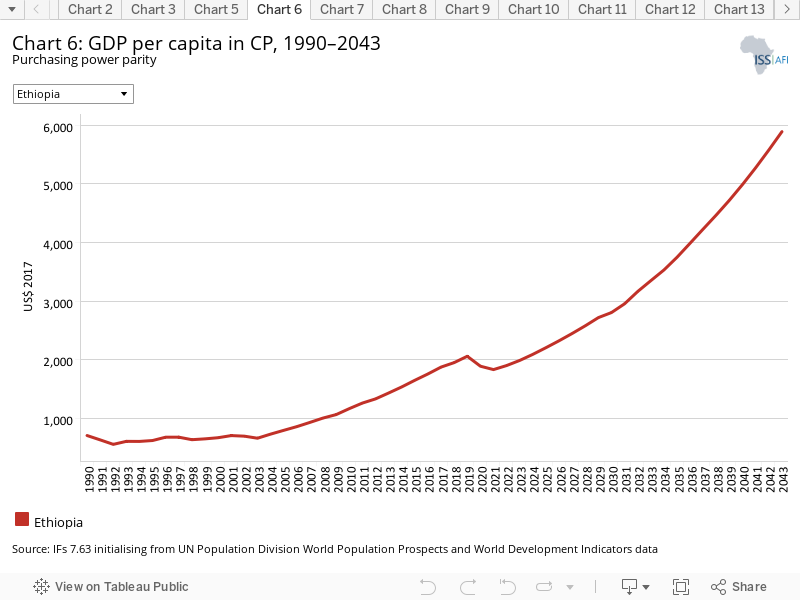
- In 2019, the size of the Ethiopian economy was US$70.6 billion, up from US$10.4 billion in 1990. The GDP of Ethiopia grew by 578.8% from 1990 to 2019. By 2043, the economy is projected to grow to US$588.6 billion, making it the fourth largest economy in Africa based on the Current Path assumptions. The GDP per person (PPP, and constant 2017 US$) was US$2 063 in 2019 — 37th in Africa. On the Current Path, the GDP per person of Ethiopia is forecast to grow to US$5 888 by 2043, making it the 23rd highest in Africa. Jump to Economics: Current Path
- With its impressive economic growth record in the last two decades, Ethiopia significantly reduced the extreme poverty rate from 67% in 1995 to 29.4% in 2019. In the Current Path forecast, the extreme poverty rate at US$1.90 is projected to decline to 3.1% (5.9 million people) by 2043, significantly below the average of 25.2% for low-income countries in Africa. Jump to Poverty: Current Path
- In 2019, Ethiopia produced 2.2 million tons of carbon. On the Current Path, carbon emissions in Ethiopia are forecast to peak at 16.8 million tons by 2038 before declining to 4.9 million tons by 2043. Jump to Carbon emissions/Energy: Current Path
- Sectoral scenarios
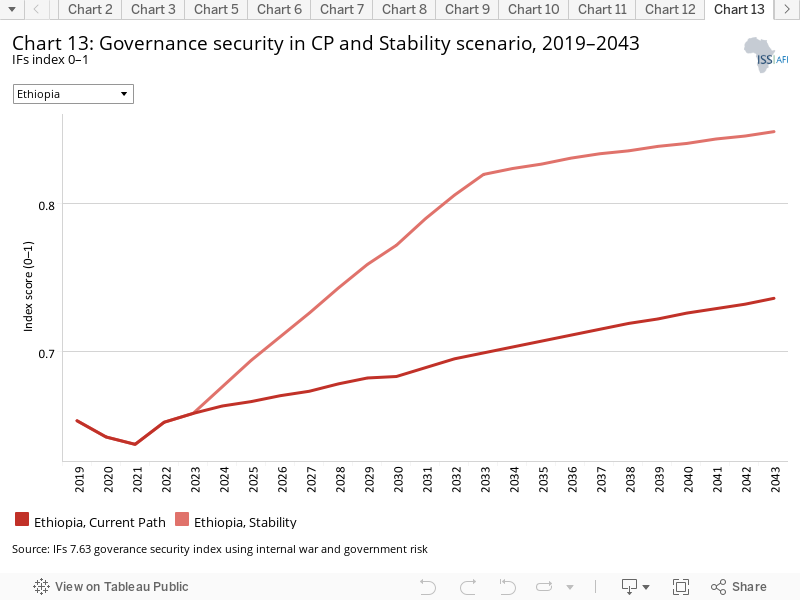
- IFs’ governance security index ranges from 0 (low security) to 1 (high security). The score for Ethiopia on the governance security index was 0.65 in 2019, compared to 0.64 for low-income African countries. The Stability scenario improves security and stability in Ethiopia. By 2043, the score in the Stability scenario is 0.85, about 15% higher than the Current Path forecast and 19.7% higher than the projected average of 0.71 on the Current Path for African low-income countries. Jump to Stability scenario
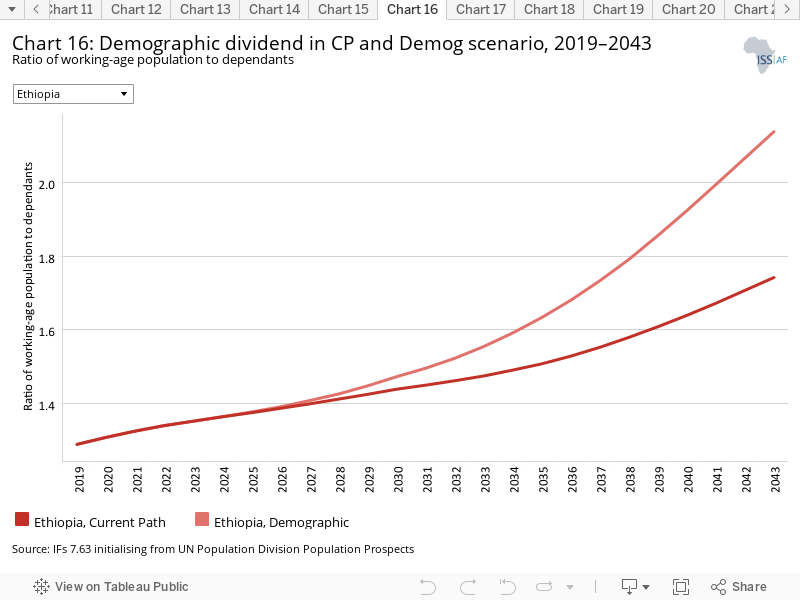
- In 2019, the ratio of the working-age population to dependants stood at 1.3 to 1, meaning that there is more than one person of the working-age population for each dependant. On the Current Path, the ratio is forecast to be 1.74 to 1 by 2043. In the Demographic scenario, the working-age population to dependants’ ratio is 2.14 to 1 by 2043. The minimum ratio of 1.7 to 1 that is necessary for the materialisation of the demographic dividend will be reached in 2037, six years earlier than on the Current Path. Jump to Demographic scenario
- Life expectancy in Ethiopia has increased from 46.4 years in 1990 to 66.2 in 2019 — up by nearly 43% since 1990. This is above the average of 63.7 years for low-income countries in Africa. Based on the Health/WaSH scenario, the average Ethiopian can expect to live to 73.8 by 2043. Jump to Health/WaSH scenario
- In the Agriculture scenario, crop yields in Ethiopia improve from 3 tons per hectare in 2019 to 6.1 tons per hectare in 2043, compared to 3.8 tons in the Current Path forecast. This is 60.5% higher than the Current Path forecast and above the projected average for low-income Africa. The scenario also reduces agricultural import dependency in the country from 4.6% of total demand to a surplus equivalent to 39% of total demand in 2043. Jump to Agriculture scenario
- The average Ethiopian adult (15 years and older) received about 4.1 years of schooling in 2019. In the Education scenario, the mean years of education improves by 0.3 years above the Current Path forecast at 6.2 years by 2043. Also, the score for the quality of primary education improves from 22.8 in 2019 to 30.9 in 2043 and the score for the quality of secondary education increases from 34.3 in 2019 to 43.5 in 2043. Jump to Education scenario
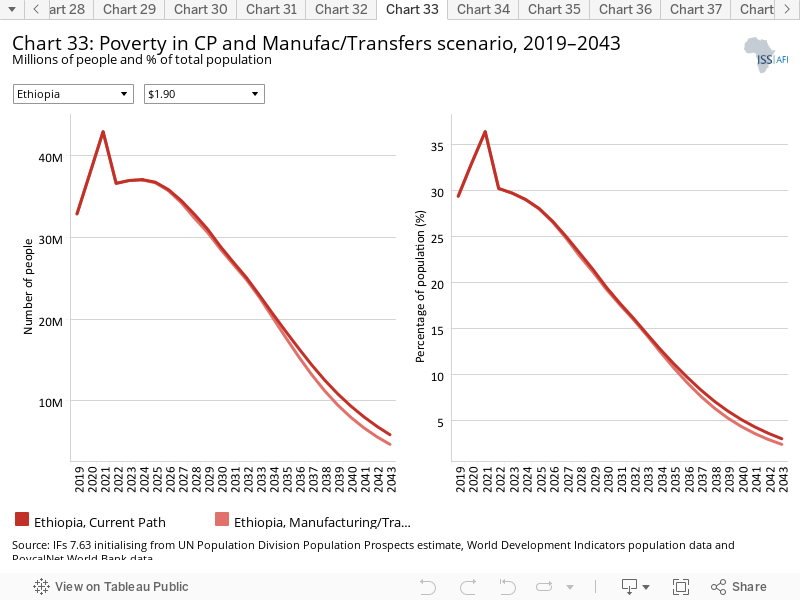
- In the Manufacturing/Transfers scenario, the number of poor people by 2043 will stand at 4.7 million, or 2.4% of the population, compared to 5.9 million, or 3.1%, in the Current Path forecast for that year — a difference of 1.2 million people. Jump to Manufacturing/Transfers scenario
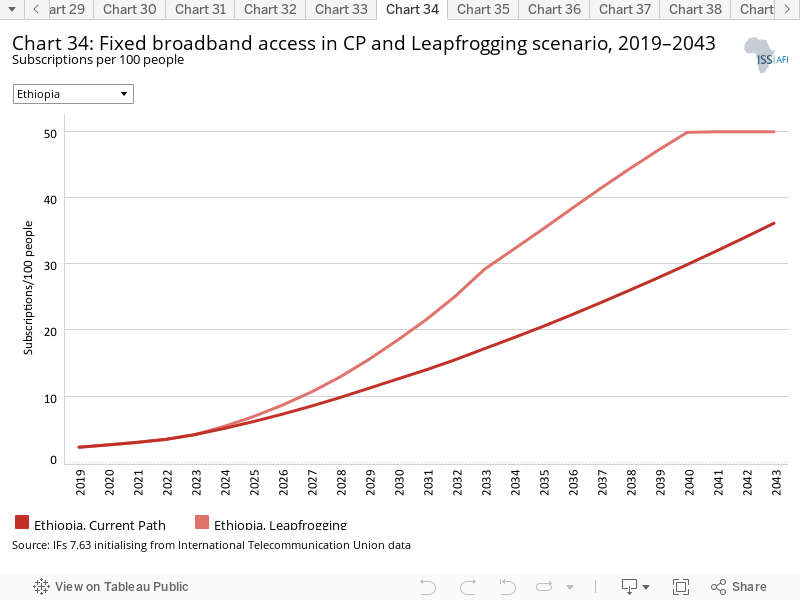
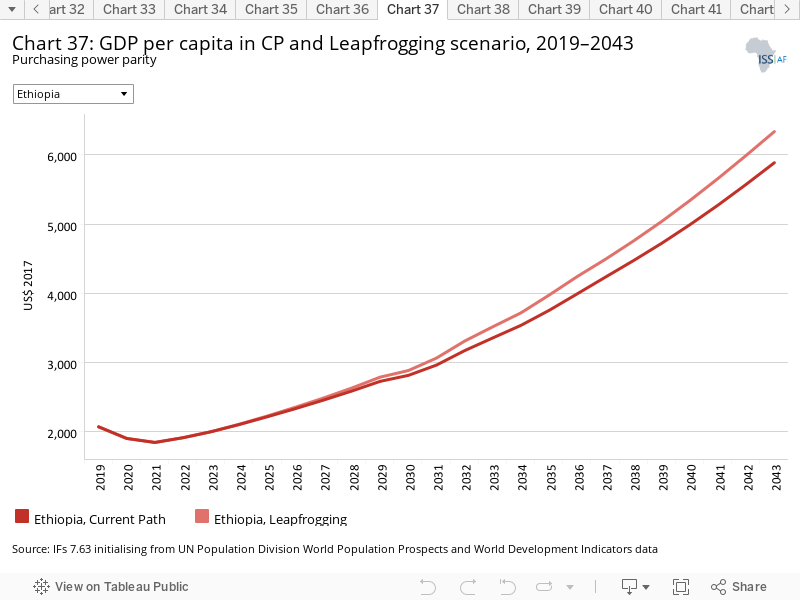
- Fixed broadband subscriptions in Ethiopia stood at roughly 2.3 per 100 people in 2019, which was on par with the average for low-income countries in Africa. In the Leapfrogging scenario, fixed broadband subscriptions increase to 50 per 100 people by 2043 — 4% higher than the Current Path forecast for the same year. Likewise, mobile broadband subscriptions in this scenario also rise from 12.8 per 100 people in 2019 to 153.4 per 100 people in 2043 — a 6.1% increase above the Current Path. Jump to Leapfrogging scenario
- In 2019, the country's trade deficit amounted to nearly 16.6% of GDP. In the Free Trade scenario, Ethiopia’s trade balance improves to reach a deficit of 5.6% of GDP in 2033. After that, the trade deficit increases to nearly 10% of GDP by 2043 compared to a deficit of 8.3% of GDP in the Current Path forecast. Jump to Free Trade scenario
- In the Financial Flows scenario, FDI inflows into Ethiopia in 2043 will represent about 3.4% of GDP compared to 3.1% on the Current Path. Foreign aid as a percentage of GDP will decline from 6% of GDP in 2019 to converge with the Current Path forecast to reach 1.1% of GDP. Jump to Financial Flows scenario
- In 2019, 46% of the rural population in Ethiopia resided within 2 km of an all-weather road, above the average of 43% for low-income African countries. In the Infrastructure scenario, it is projected to increase to 64.1% by 2043, slightly above the 58.8% projected in the Current Path forecast for that year. The electricity access rate will improve from 46.6% in 2019 to 86.2% in this scenario and to 83.7% in the Current Path forecast. Jump to Infrastructure scenario
- The projected score for government effectiveness in the Governance scenario by 2043 is 2.8 (out of a maximum of 5), 7.7% higher than the projected score of 2.6 in the Current Path forecast in the same year. Jump to Governance scenario
- The Free Trade scenario has the most significant impact on carbon emissions while the Leapfrogging scenario has the least impact on carbon emissions in Ethiopia. Jump to Impact of scenarios on carbon emissions
- Combined Agenda 2063 scenario
- By 2043, the GDP of Ethiopia in the Combined Agenda 2063 scenario is US$370.8 billion larger than the Current Path forecast, and the GDP per capita (PPP) is at US$9 472 — US$3 584 more than in the Current Path forecast for that year. In 2043, the carbon emissions in the Combined Agenda 2063 scenario are 4.8 million tons higher than in the Current Path forecast. Jump to Combined Agenda 2063 scenario
All charts for Ethiopia
- Chart 1: Political map of Ethiopia
- Chart 2: Population structure in CP, 1990–2043
- Chart 3: Urban and rural population in CP, 1990–2043
- Chart 4: Population density map for 2019
- Chart 5: GDP in CP, 1990–2043
- Chart 6: GDP per capita in CP, 1990–2043
- Chart 7: Informal sector value in CP, 2015–2043
- Chart 8: Value added by sector in CP, 2015–2043
- Chart 9: Agriculture production/demand in CP, 1990–2043
- Chart 10: Poverty in CP, 2015–2043
- Chart 11: Energy production by type in CP, 1990–2043
- Chart 12: Carbon emissions in CP, 1990–2043
- Chart 13: Governance security in CP and Stability scenario, 2019–2043
- Chart 14: GDP per capita in CP and Stability scenario, 2019–2043
- Chart 15: Poverty in CP and Stability scenario, 2019–2043
- Chart 16: Demographic dividend in CP and Demog scenario, 2019–2043
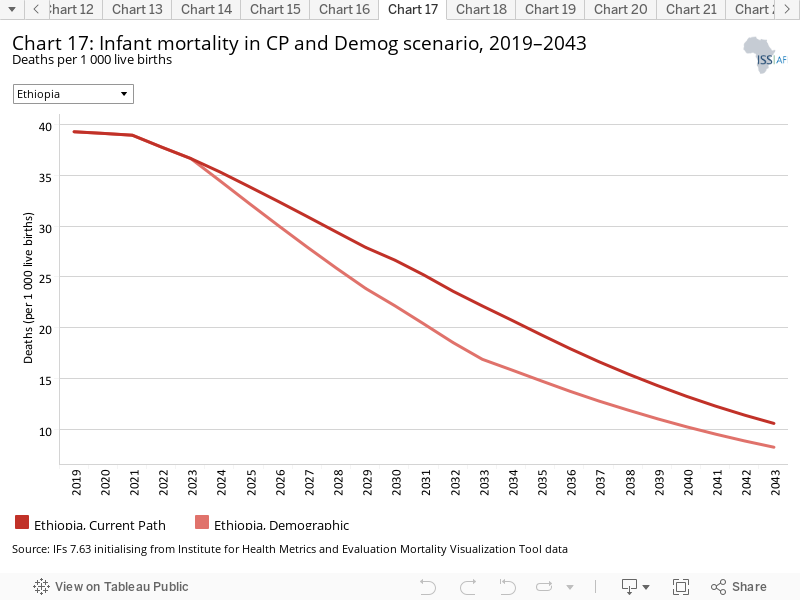
- Chart 17: Infant mortality in CP and Demog scenario, 2019–2043
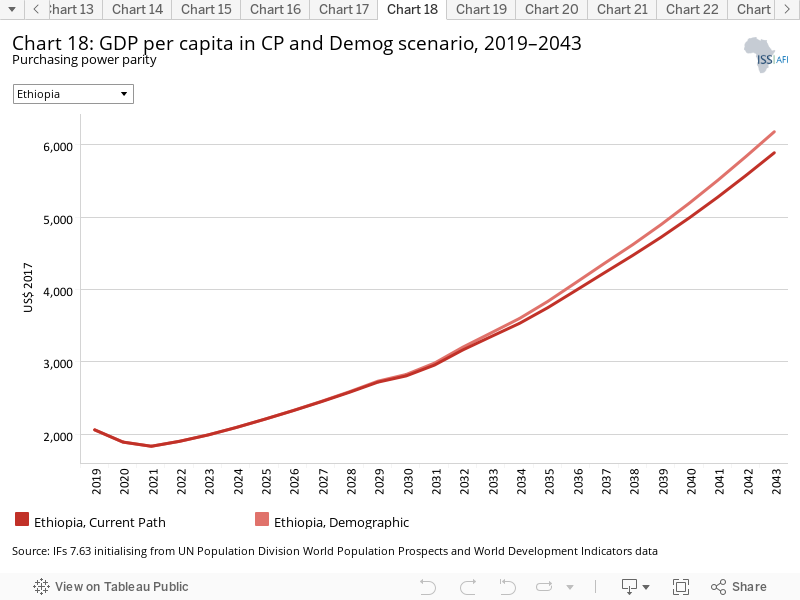
- Chart 18: GDP per capita in CP and Demog scenario, 2019–2043
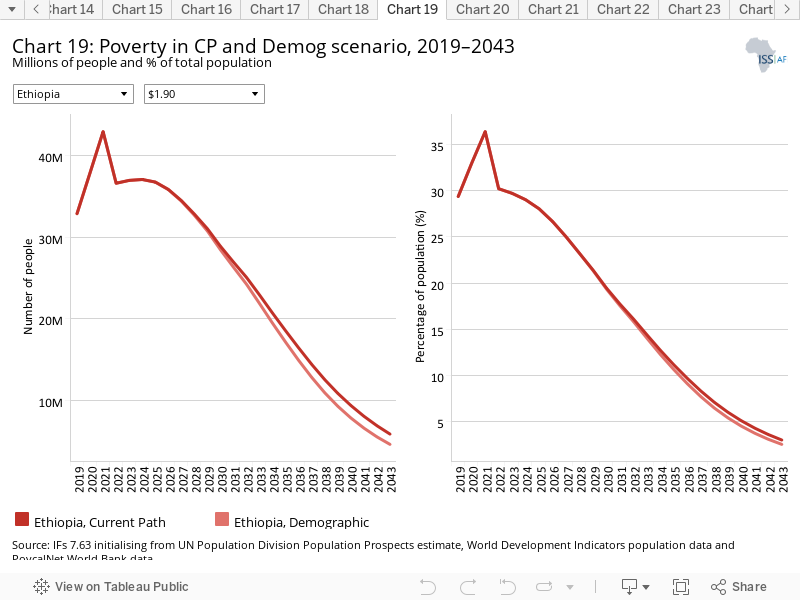
- Chart 19: Poverty in CP and Demog scenario, 2019–2043
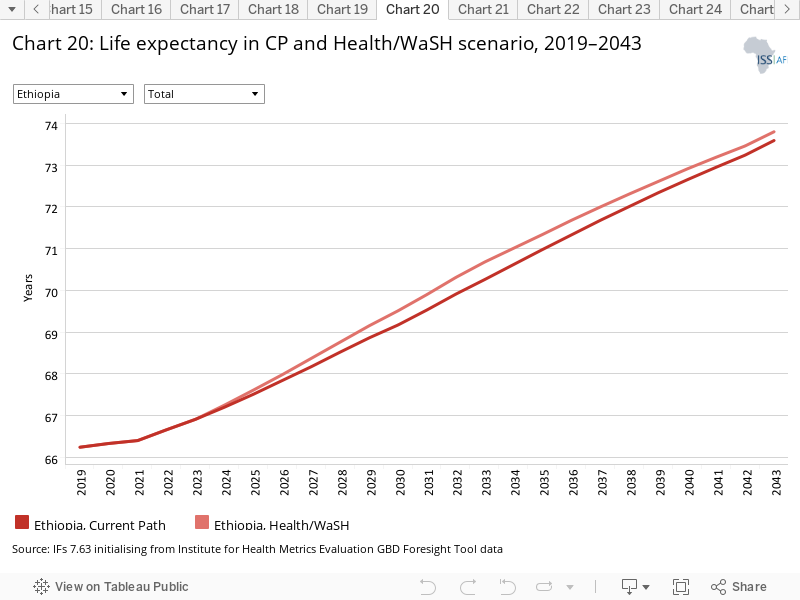
- Chart 20: Life expectancy in CP and Health/WaSH scenario, 2019–2043
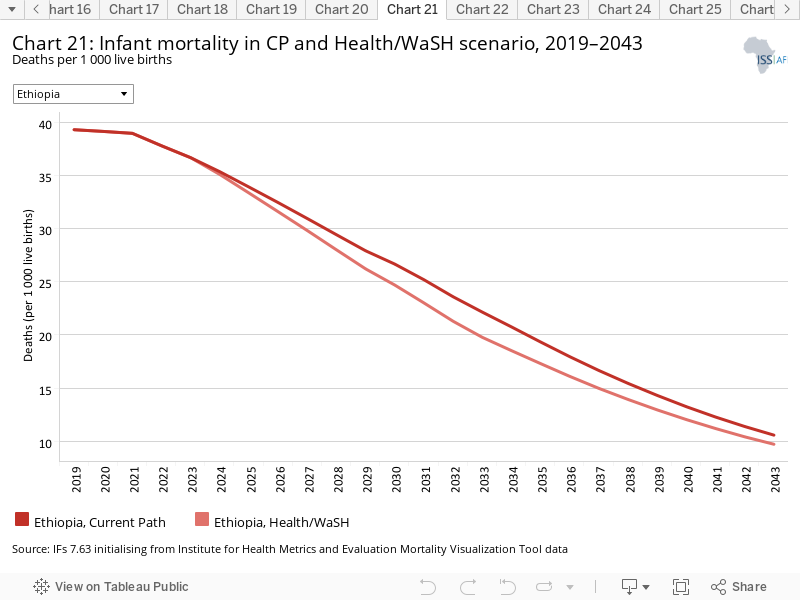
- Chart 21: Infant mortality in CP and Health/WaSH scenario, 2019–2043
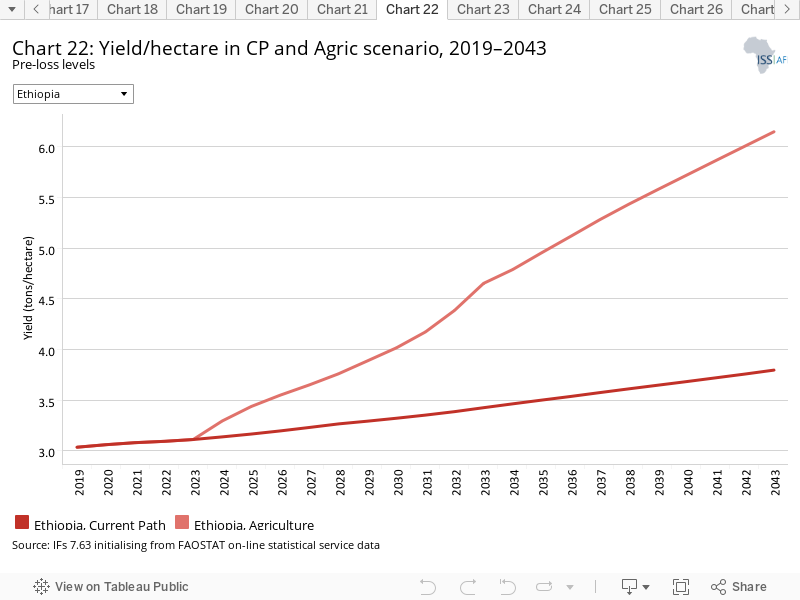
- Chart 22: Yield/hectare in CP and Agric scenario, 2019–2043
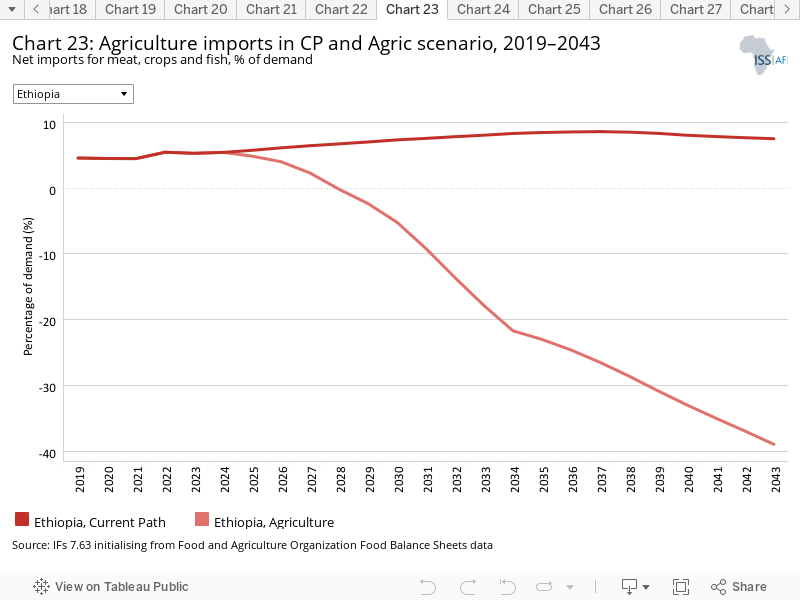
- Chart 23: Agriculture imports in CP and Agric scenario, 2019–2043
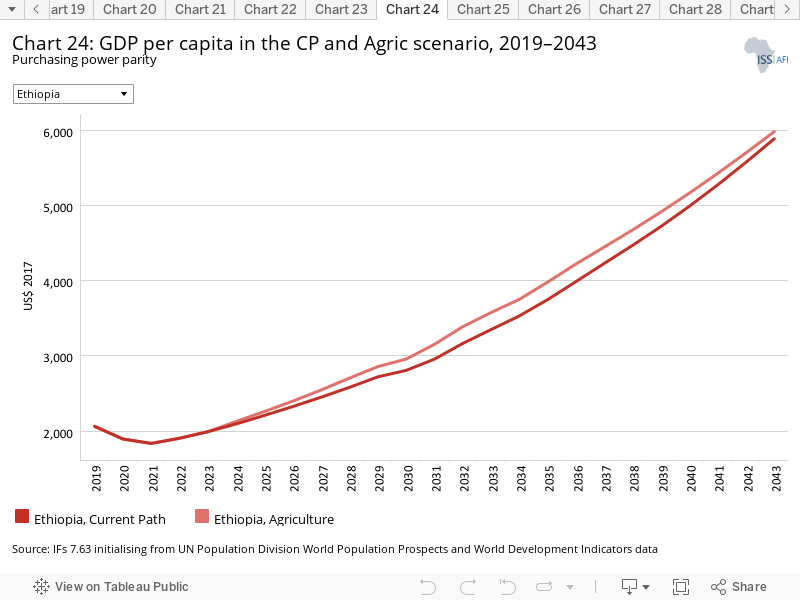
- Chart 24: GDP per capita in the CP and Agric scenario, 2019–2043
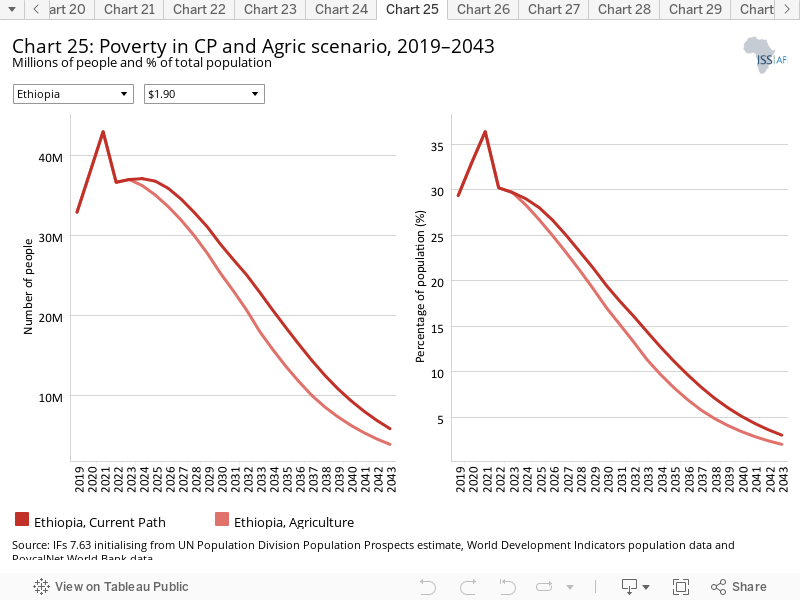
- Chart 25: Poverty in CP and Agric scenario, 2019–2043
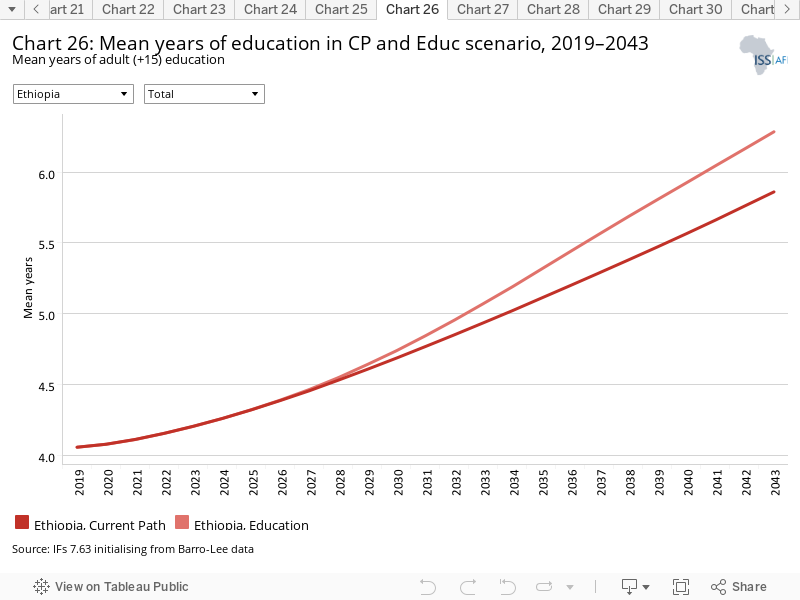
- Chart 26: Mean years of education in CP and Educ scenario, 2019–2043
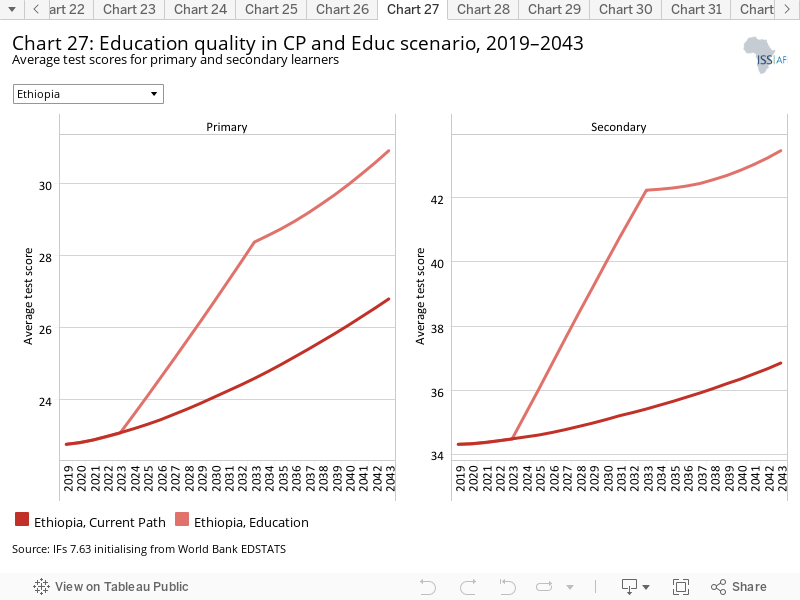
- Chart 27: Education quality in CP and Educ scenario, 2019–2043
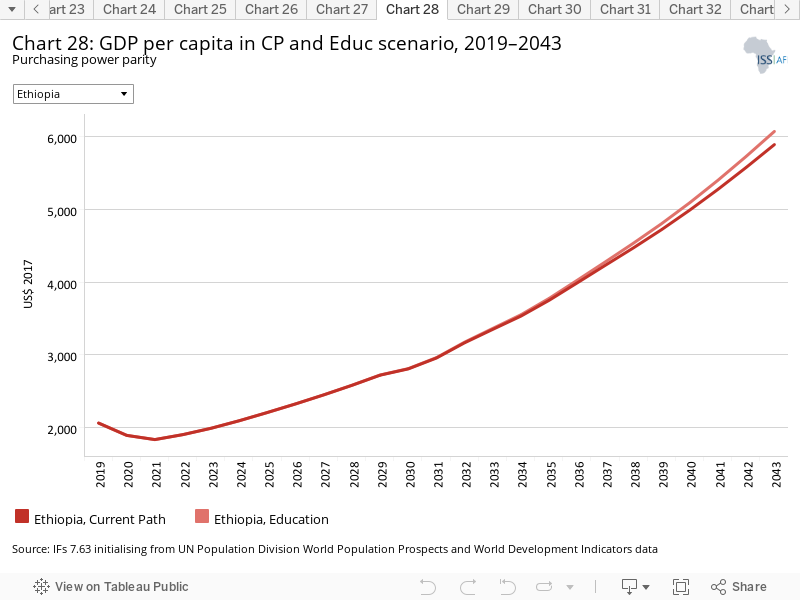
- Chart 28: GDP per capita in CP and Educ scenario, 2019–2043
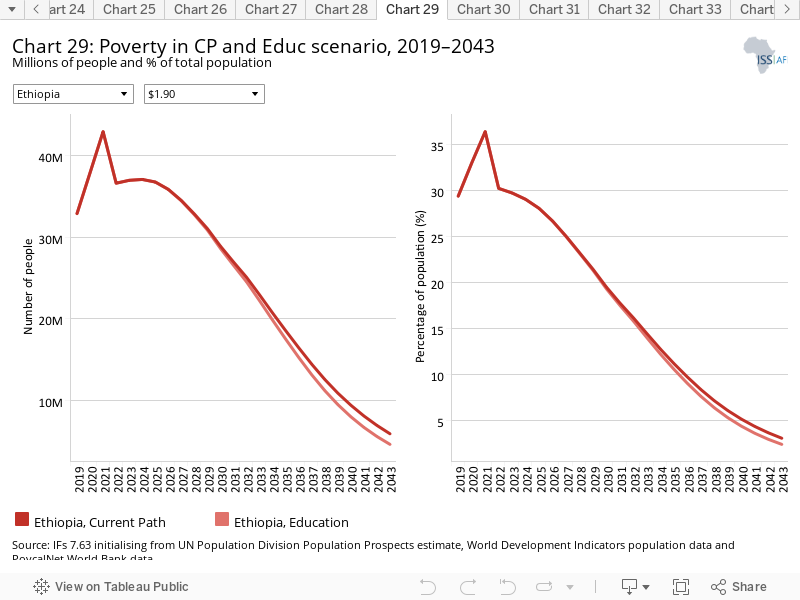
- Chart 29: Poverty in CP and Educ scenario, 2019–2043
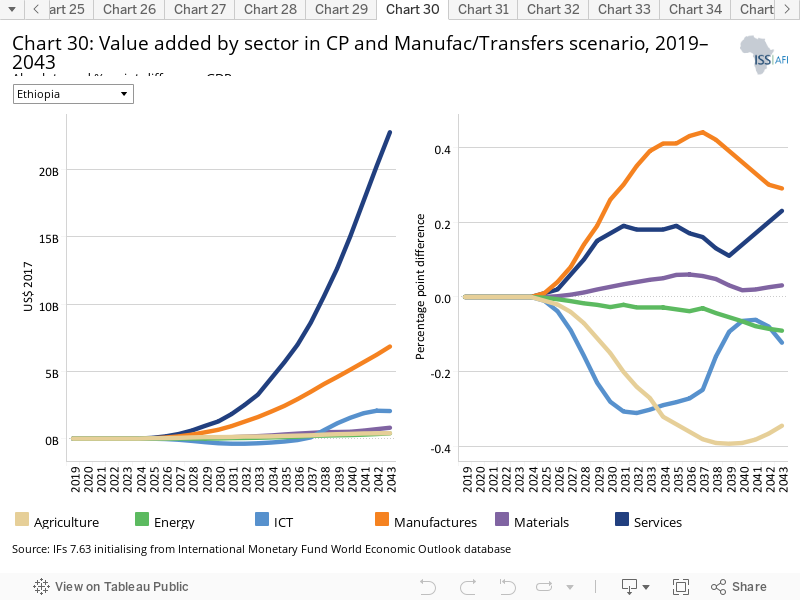
- Chart 30: Value added by sector in CP and Manufac/Transfers scenario, 2019–2043
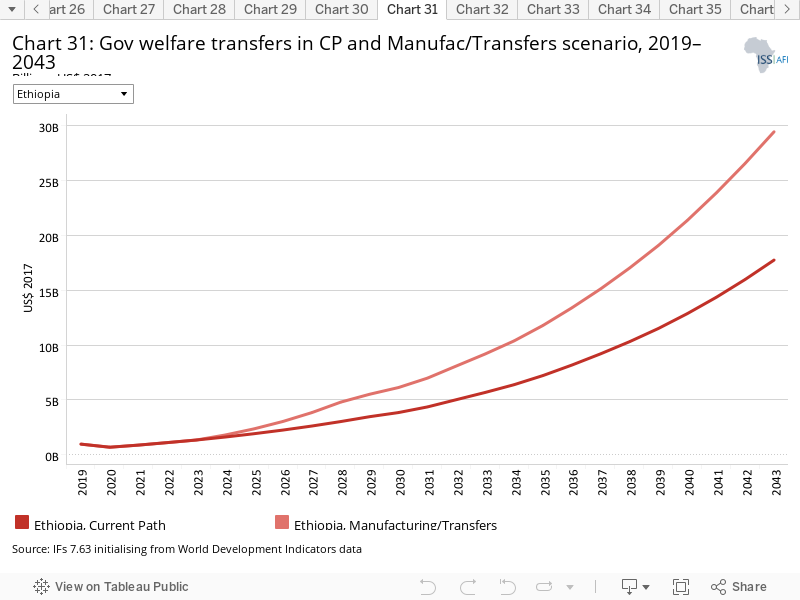
- Chart 31: Gov welfare transfers in CP and Manufac/Transfers scenario, 2019–2043
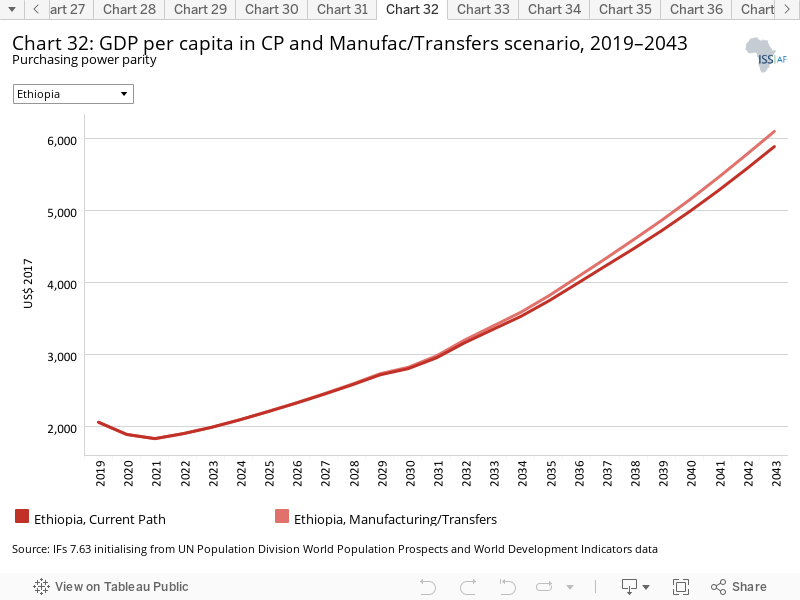
- Chart 32: GDP per capita in CP and Manufac/Transfers scenario, 2019–2043
- Chart 33: Poverty in CP and Manufac/Transfers scenario, 2019–2043
- Chart 34: Fixed broadband access in CP and Leapfrogging scenario, 2019–2043
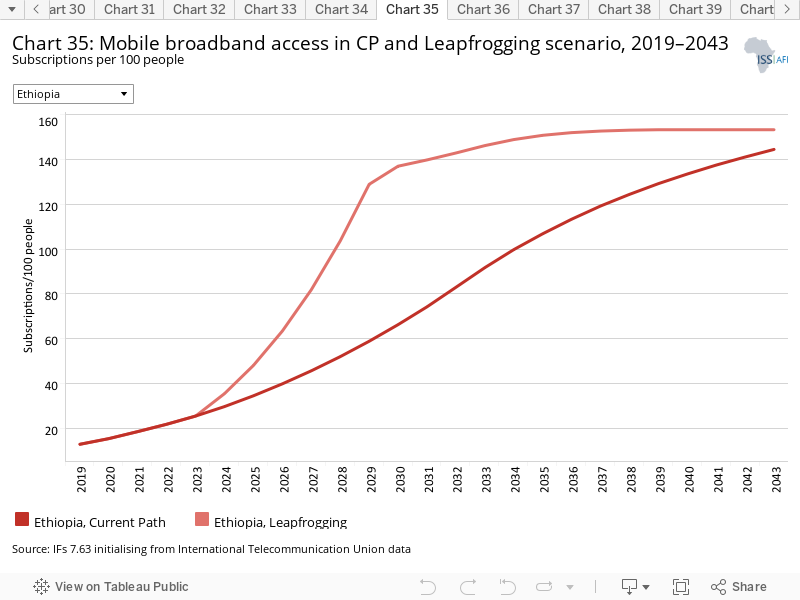
- Chart 35: Mobile broadband access in CP and Leapfrogging scenario, 2019–2043
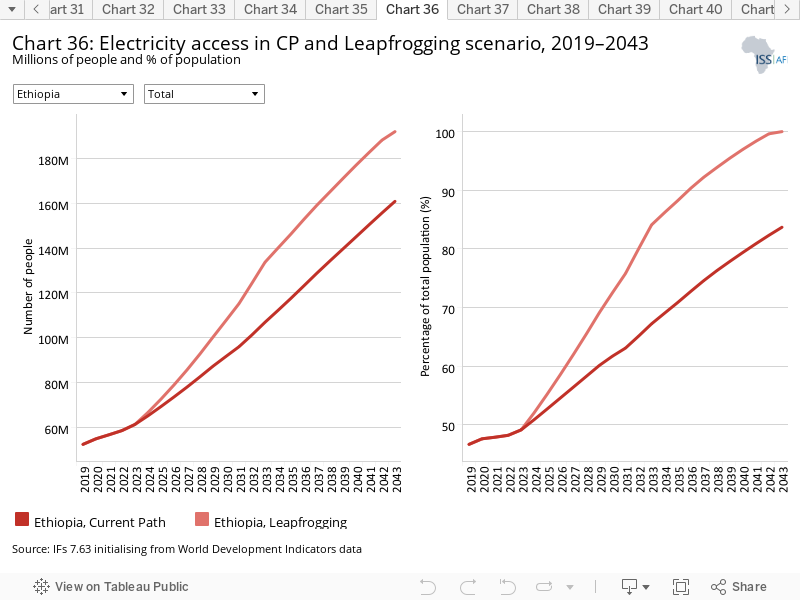
- Chart 36: Electricity access in CP and Leapfrogging scenario, 2019–2043
- Chart 37: GDP per capita in CP and Leapfrogging scenario, 2019–2043
- Chart 38: Poverty in CP and Leapfrogging scenario, 2019–2043
- Chart 39: Trade balance in CP and Free Trade scenario, 2019–2043
- Chart 40: GDP per capita in CP and Free Trade scenario, 2019–2043
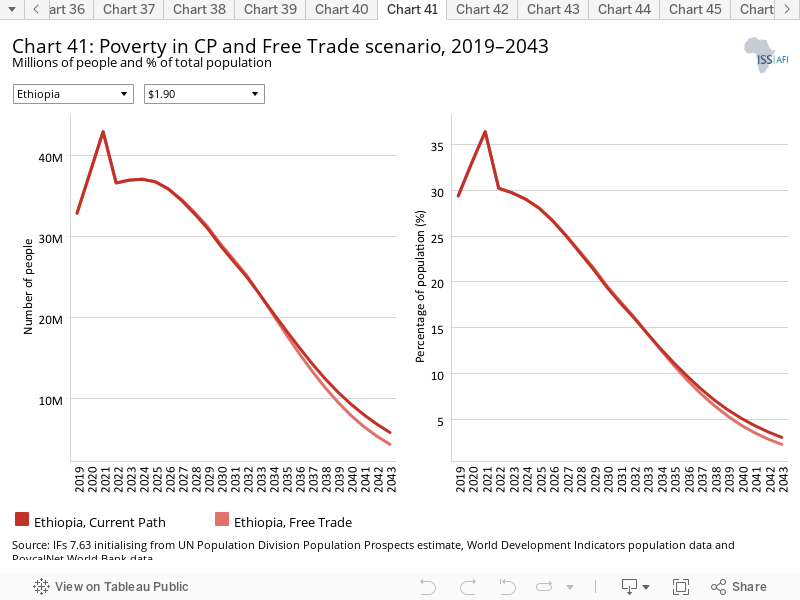
- Chart 41: Poverty in CP and Free Trade scenario, 2019–2043
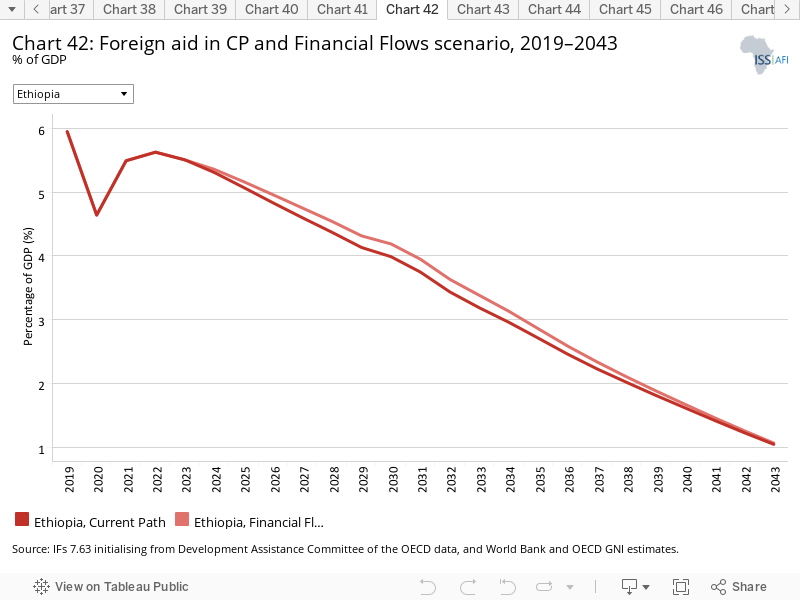
- Chart 42: Foreign aid in CP and Financial Flows scenario, 2019–2043
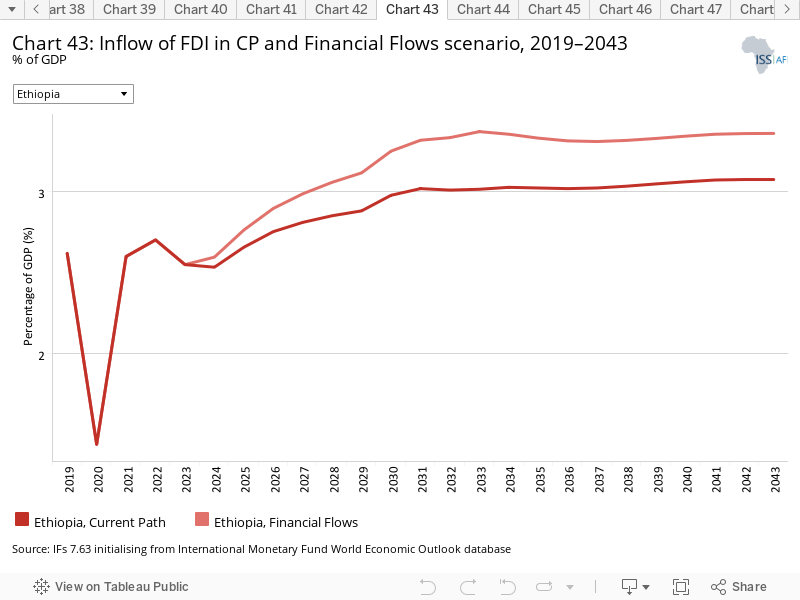
- Chart 43: Inflow of FDI in CP and Financial Flows scenario, 2019–2043
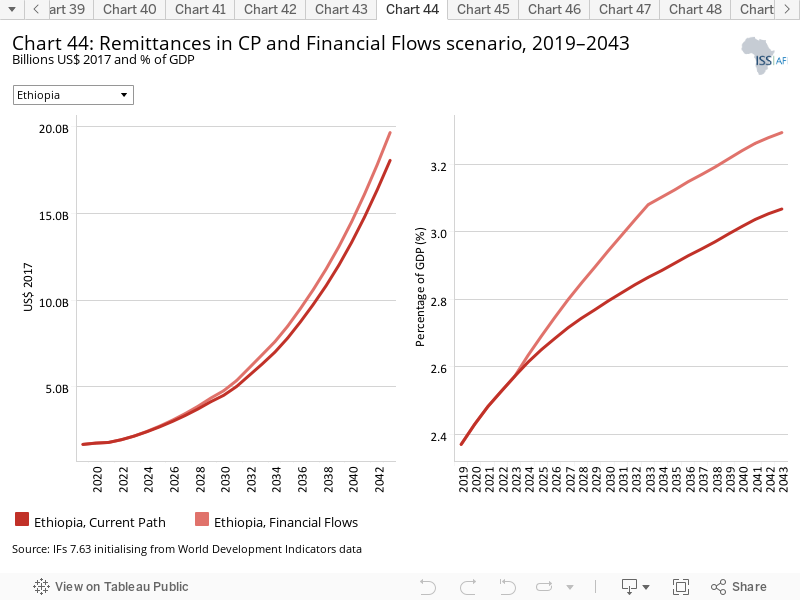
- Chart 44: Remittances in CP and Financial Flows scenario, 2019–2043
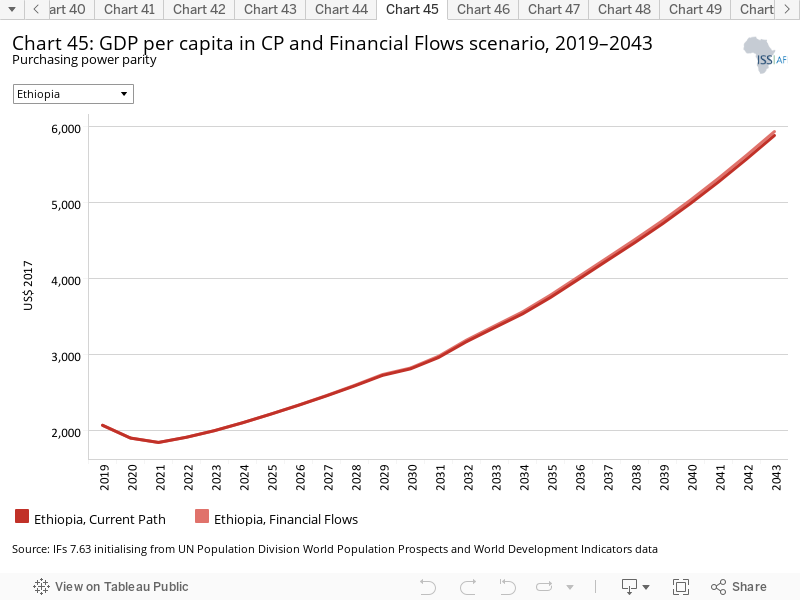
- Chart 45: GDP per capita in CP and Financial Flows scenario, 2019–2043
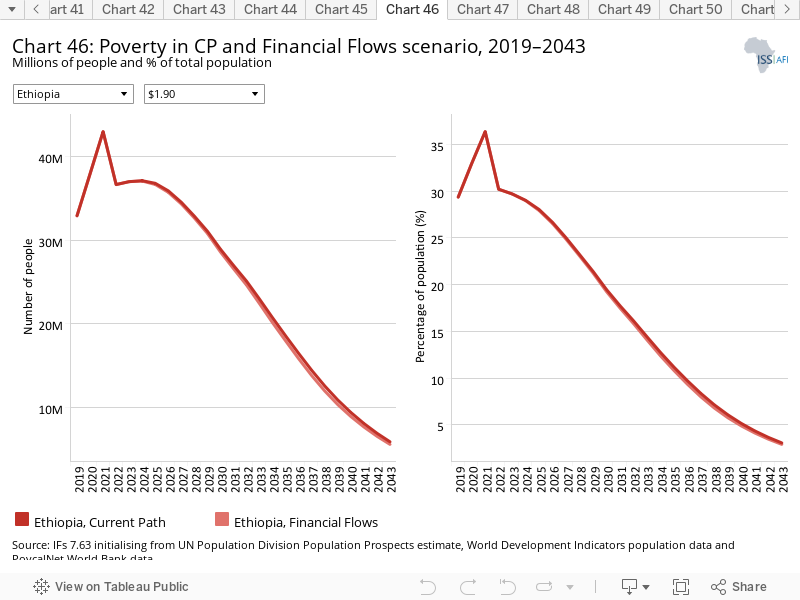
- Chart 46: Poverty in CP and Financial Flows scenario, 2019–2043
- Chart 47: Electricity access in CP and Infrastructure scenario, 2019–2043
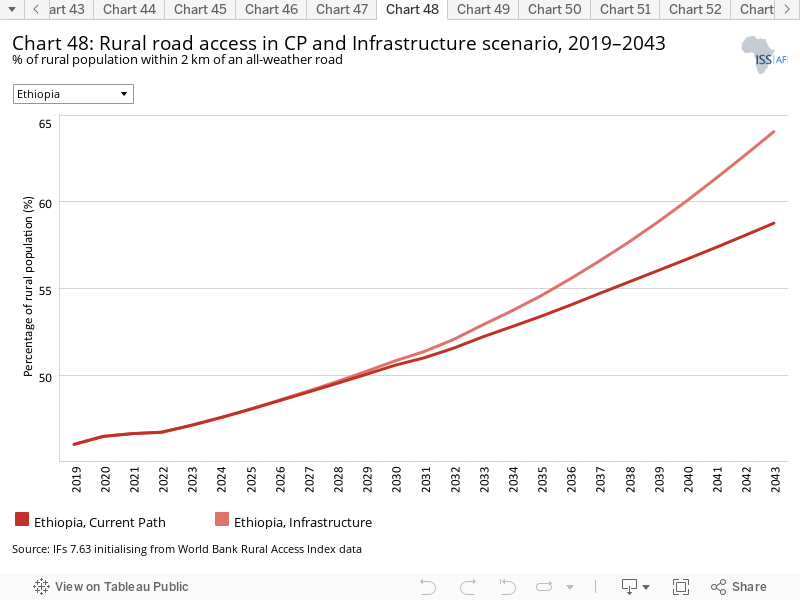
- Chart 48: Rural road access in CP and Infrastructure scenario, 2019–2043
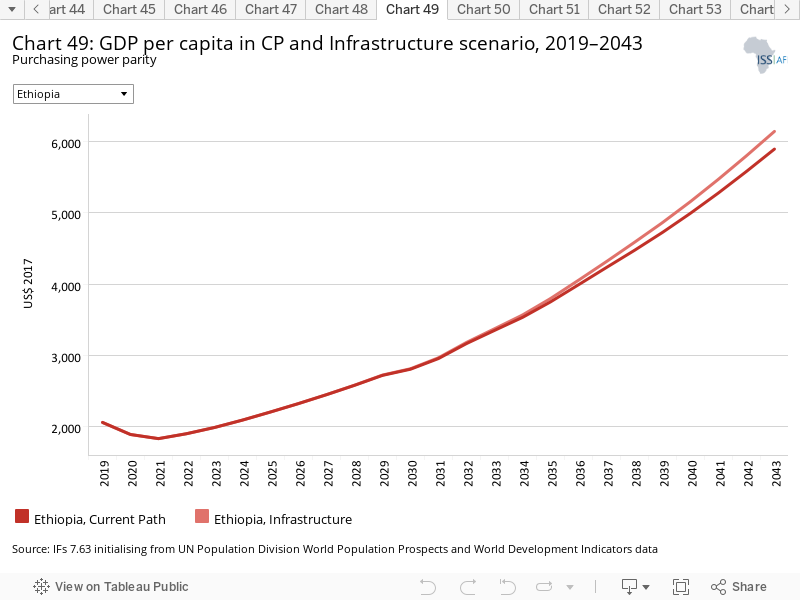
- Chart 49: GDP per capita in CP and Infrastructure scenario, 2019–2043
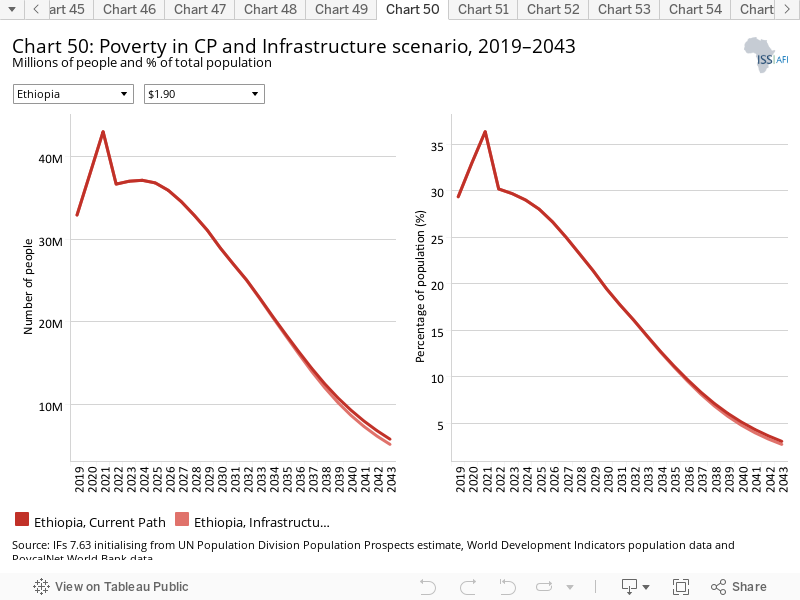
- Chart 50: Poverty in CP and Infrastructure scenario, 2019–2043
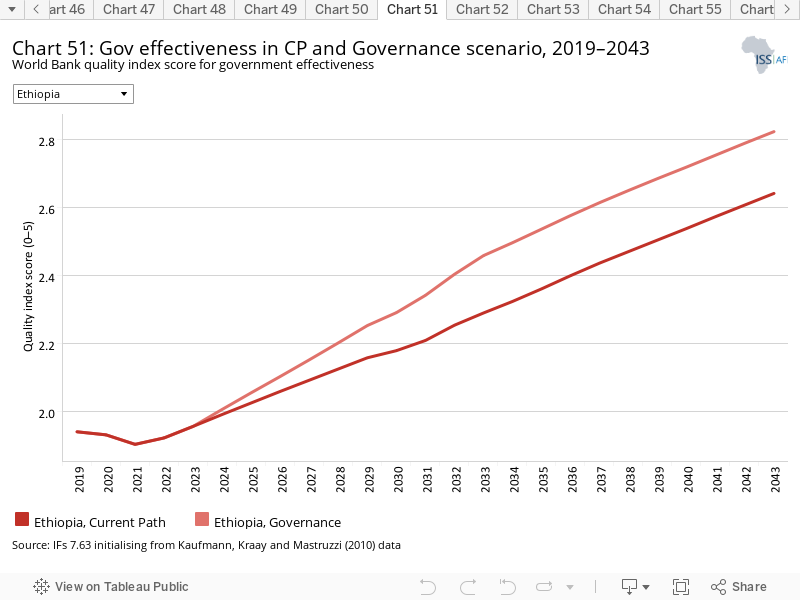
- Chart 51: Gov effectiveness in CP and Governance scenario, 2019–2043
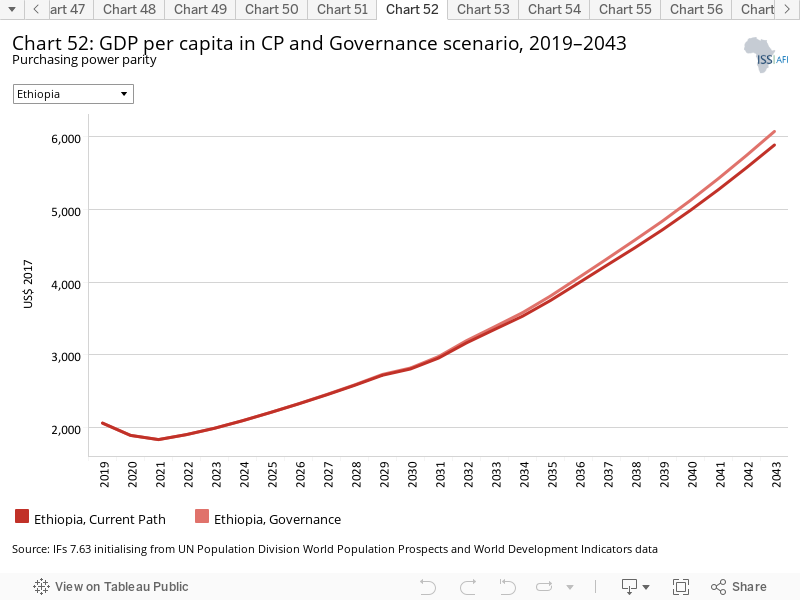
- Chart 52: GDP per capita in CP and Governance scenario, 2019–2043
- Chart 53: Poverty in CP and Governance scenario, 2019–2043
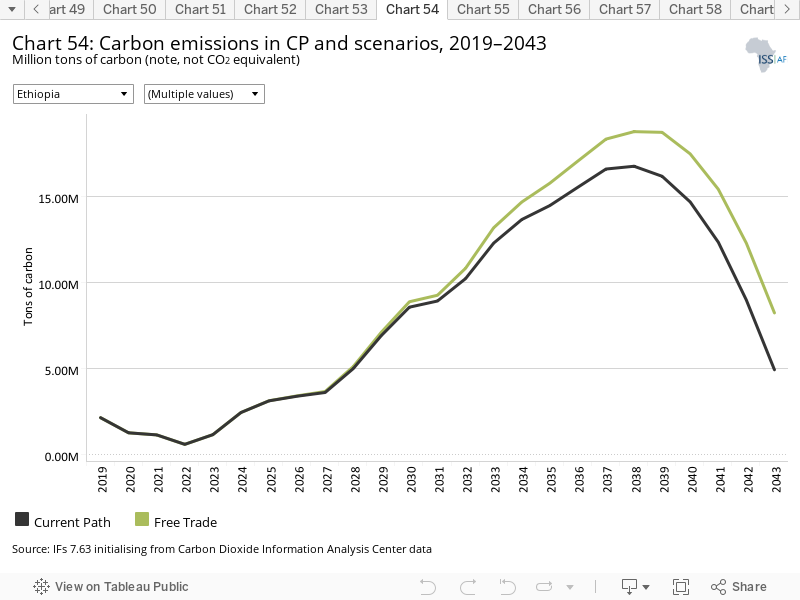
- Chart 54: Carbon emissions in CP and scenarios, 2019–2043
- Chart 55: GDP per capita in CP and scenarios, 2019–2043
- Chart 56: GDP per capita in CP and Combined scenario, 2019–2043
- Chart 57: Poverty in CP and Combined scenario, 2019–2043
- Chart 58: Value added by sector in CP and Combined scenario, 2019–2043
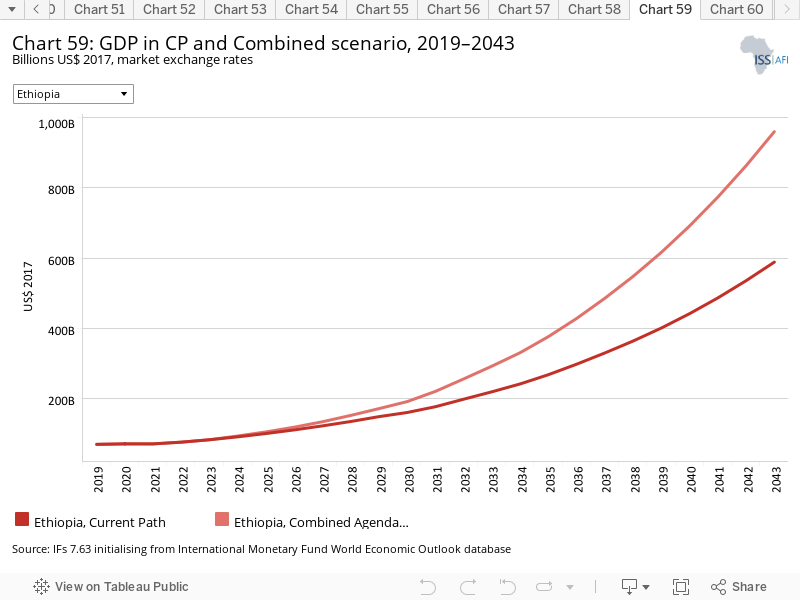
- Chart 59: GDP in CP and Combined scenario, 2019–2043
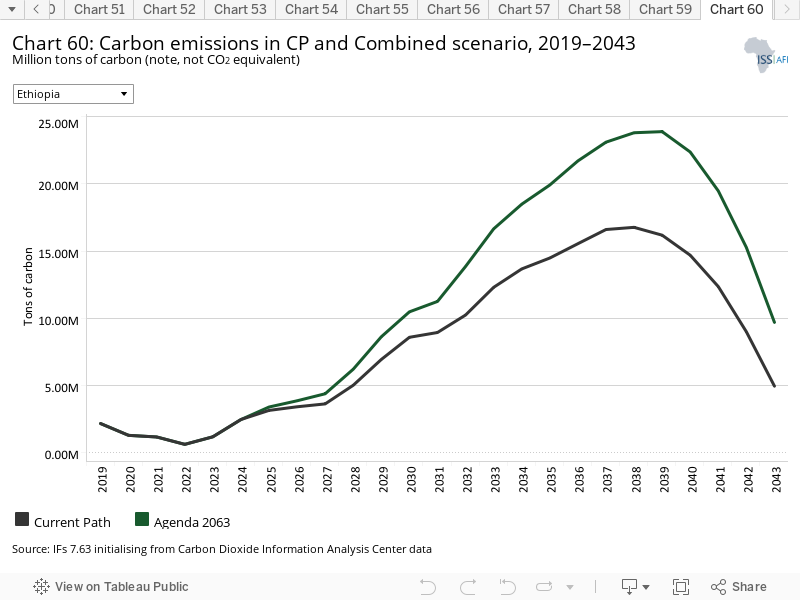
- Chart 60: Carbon emissions in CP and Combined scenario, 2019–2043


This page provides an overview of the key characteristics of Ethiopia along its likely (or Current Path) development trajectory. The Current Path forecast from the International Futures forecasting (IFs) platform is a dynamic scenario that imitates the continuation of current policies and environmental conditions. The Current Path is therefore in congruence with historical patterns and produces a series of dynamic forecasts endogenised in relationships across crucial global systems. We use 2019 as a standard reference year and the forecasts generally extend to 2043 to coincide with the end of the third ten-year implementation plan of the African Union’s Agenda 2063 long-term development vision.
Ethiopia is a low-income, landlocked country located in the Horn of Africa, in the east of the continent. The country lost its access to the Red Sea in 1992 when Eritrea gained its independence from Ethiopia, and has been using neighbouring Djibouti's main port for the last two decades for its international trade. Ethiopia is bordered by Eritrea to the north, Djibouti to the north-east, Somalia to the east, Kenya to the south, and South Sudan and Sudan to the west.
Ethiopia has a surface area of 1 104 million km² and a population of 112.1 million in 2019. The country is a member of the Intergovernmental Authority on Development (IGAD), an eight-country regional bloc in Africa with ambitions to embark on regional integration.
A period of rapid economic growth since 2000 has translated into meaningful improvements in human development in Ethiopia, although from a very low base. The country’s target to reach lower middle-income status by 2025 will be contingent on its ability to sustain growth. Fighting in Tigray, one of Ethiopia’s most important industrial centres, has idled and destroyed many factories. Others are increasingly being shut out of markets. In 2021, President Joe Biden suspended Ethiopia’s tariff-free access to America, citing ‘gross violations of internationally recognised human rights’, by the forces of the prime minister, Abiy Ahmed.[1S Gebre, U.S. terminates duty-free trade access to Ethiopia over conflict, Bloomberg, 24 December 2021]
Ethiopia’s main challenges are sustaining economic growth and accelerating poverty reduction, which both require significant progress in job creation and improved governance to ensure that growth is equitable across the society. A quick diplomatic resolution to the crisis is necessary for Ethiopia to overcome these challenges.
The characteristics of a country's population can shape its long-term social, economic and political foundations; thus, understanding a nation's demographic profile indicates its development prospects.
Ethiopia has a large and diverse population. It is made up of over 80 different ethnic groups, the four largest of which are the Oromo, Amhara, Somali and Tigrayans. Ethiopia has made great strides in reducing its fertility rate. The total fertility rate in Ethiopia was 4.3 children per woman in 2020, down from an average level of 7.1 in the 1990s.
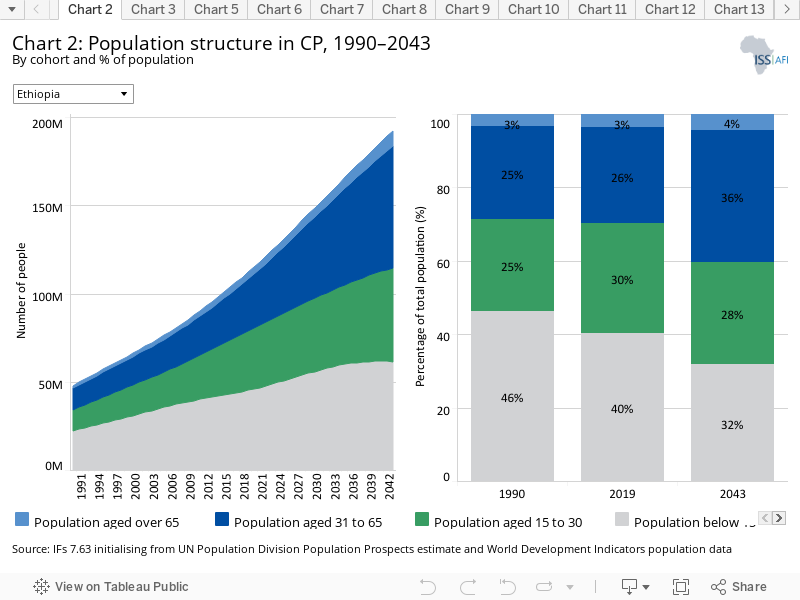
The population of Ethiopia was about 112 million in 2019, and on the Current Path it is forecast to be 192.2 million by 2043 — a 71.45% increase over the next 24 years. By 2043, Ethiopia will still be the second most populous country in Africa after Nigeria. Ethiopia hosts refugees from several neighbouring countries. The overwhelming majority of refugees are from Somalia, but there are also sizable numbers from Eritrea, Sudan and South Sudan. Most refugees have fled their countries because of conflict or famine.[2UNHCR, Ethiopia]
In 2019, about 40% of the country's population was under the age of 15, meaning a large portion of the population is dependent on a small workforce to provide for its needs. The population under 15 years is expected to decline but will still constitute 32% of the population in 2043. The proportion of elderly people (65 years and older) has been stable at 3% over time and is projected to reach 4% in 2043. In 2019, 56.3% of the Ethiopian population was in the working-age group (15–64 years), which is forecast to increase to 63.5% by 2043. The working-age group constitutes the largest share of the population, and this can be a potential source of growth provided the labour force is well trained and sufficient jobs are created. However, with the unemployment rate in the country estimated to be 19% in 2018,[3Trading Economics, Ethiopia unemployment rate] Ethiopia stands the risk of labour agitation and increased instability.
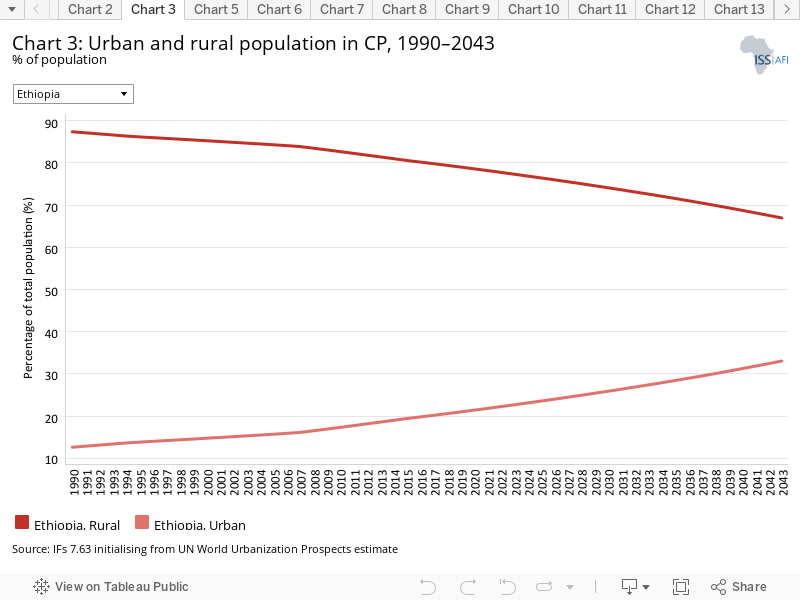
Ethiopia is one of the least urbanised countries in the world today, and only 21% of its population lived in urban areas in 2019, up from 12.6% in 1990. This is 10 percentage points below the average of 31% for low-income countries in Africa. In the current development trajectory, the rate of urbanisation in Ethiopia is projected to increase to 33% by 2043, while the rural population will drop to 67% from 87.4% in 1990 and 79% in 2019. Ethiopia's low level of urbanisation is often explained as the result of the country's history of agricultural self-sufficiency, which has reinforced rural peasant life.[4Country Studies, Ethiopia — Urbanization]
Addis Ababa, the capital city, still remains the prime destination for many migrants who are attracted to the city by the opportunities it is perceived to offer or by its relative peace and security. Urbanisation, if well planned, offers an opportunity to promote inclusive economy by accelerating the provision of a range of services including education.
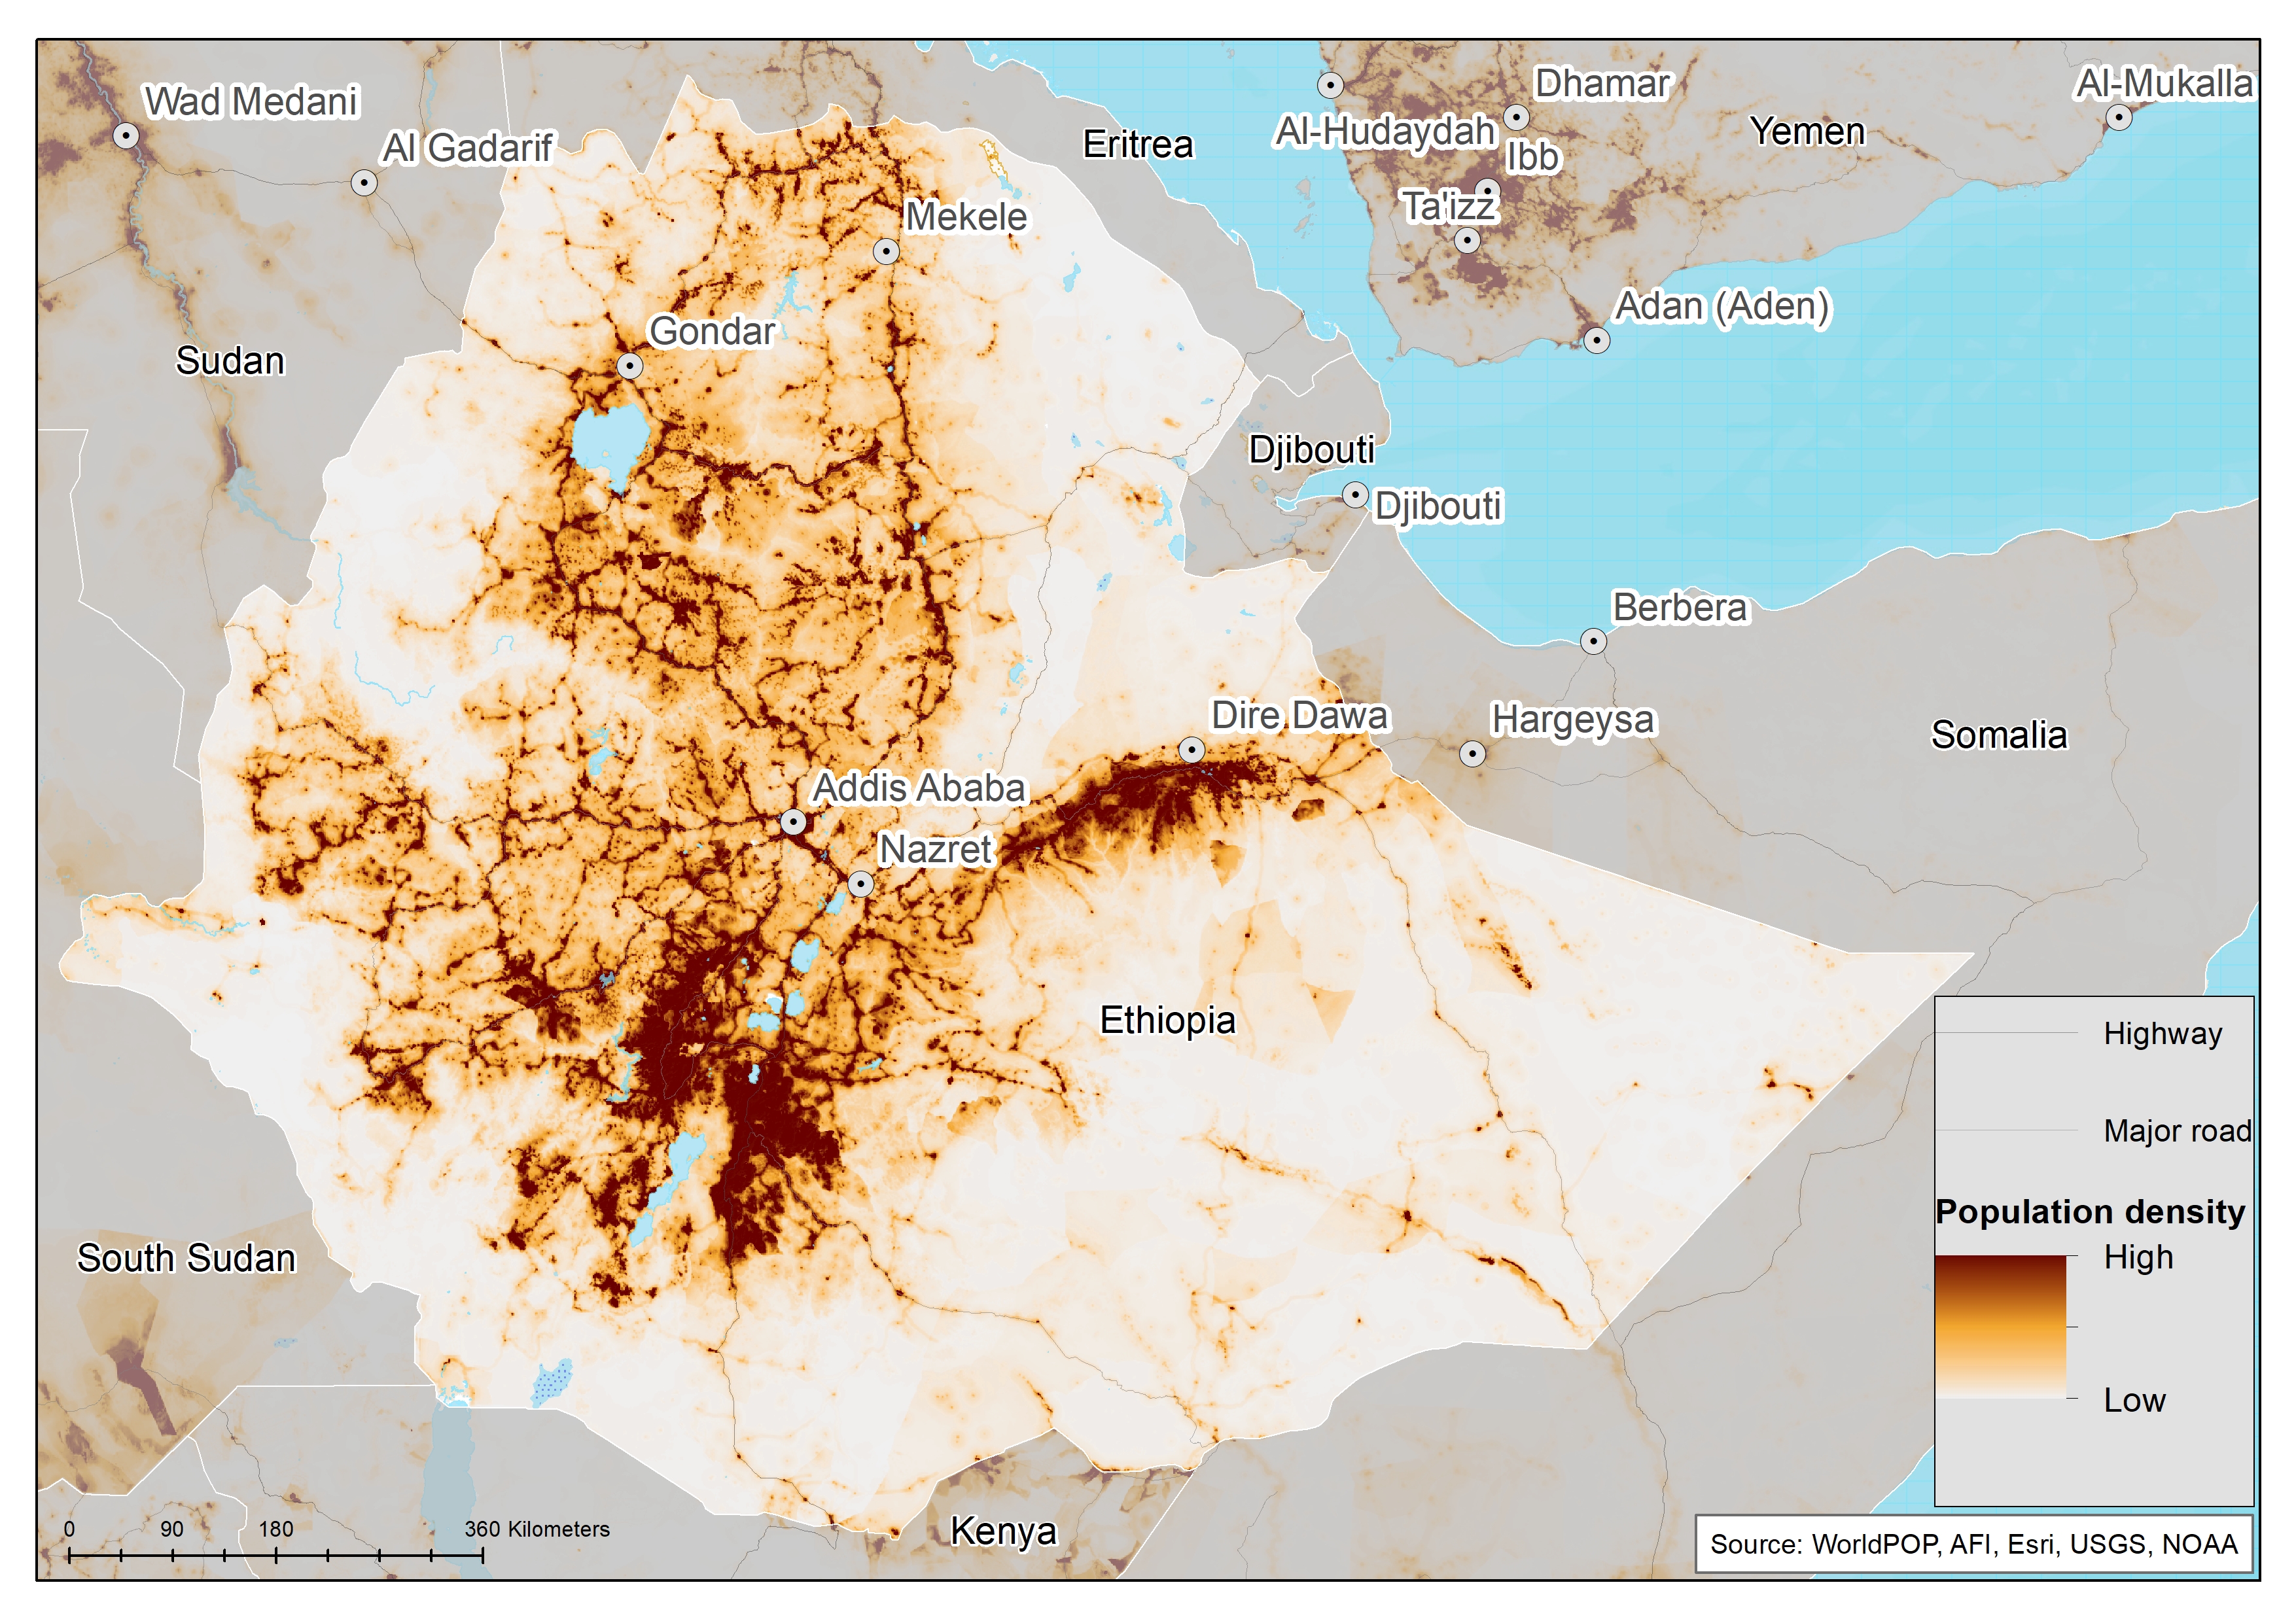
With only about one-fifth of the population urbanised, most Ethiopians live in scattered rural communities. The population density of Ethiopia was 1.1 people per hectare in 2019, which is above the African average 0.44 people per hectare.
In the Current Path forecast, the population density is projected to be 1.9 people per hectare by 2043, more than twice the projected average for low-income Africa in the same year.
Three decades ago, Ethiopia’s economy was among the world’s least developed. Then, in 1991, forces led by the Tigray People's Liberation Front (TPLF) overthrew the Marxist regime that had long run the country. Though the TPLF-dominated government remained authoritarian, it began liberalising the economy and directing investment towards infrastructure. As a result, Ethiopia has experienced one of the most extraordinary growth records. Over the past 15 years, it has been among the fastest growing countries in the world, with an average growth of 10% per year. This impressive growth was as a result of increased productivity in agriculture and capital accumulation, particularly through public infrastructure investments.
GDP growth slowed down in 2020 and 2021 due to the COVID-19 pandemic, with growth in industry and services declining to single digits. However, the agriculture sector, where over 70% of the population are employed, was not significantly affected by the COVID-19 pandemic and its contribution to growth slightly improved in 2020 compared to the previous year.[5World Bank, The World Bank in Ethiopia]
The government has launched a new 10-Year Development Plan, based on the 2019 Home-Grown Economic Reform Agenda, which will run from 2020/21 to 2029/30. The plan aims to sustain the remarkable growth achieved under the Growth and Transformation Plans of the previous decade, while facilitating the shift towards a more private-sector-driven economy. But the conflict in Tigray is likely to affect the materialisation of this plan.
In 2019, the size of the Ethiopia's economy (GDP) was US$70.6 billion, up from US$10.4 billion in 1990. In other words, the GDP of Ethiopia grew by 578.8% between 1990 and 2019. By 2043, the economy is projected to grow by about 734% to reach US$588.6 billion, making it the fourth largest economy in Africa based on the Current Path assumptions.
Although many of the charts in the sectoral scenarios also include GDP per capita, this overview is an essential point of departure for interpreting the general economic outlook of Ethiopia.
Ethiopia’s GDP per capita has risen more than sevenfold since 1995, faster than other sub-Saharan economies and the emerging world. Real GDP per capita in Ethiopia, the second most populous country in Africa, rose by an average annual rate of 9.3% from 1999 to 2019 — only 0.4 percentage points less than China’s pace of growth. Despite this improvement, GDP per capita of Ethiopia is still very low. In 2019, the GDP per person (PPP, and constant 2017 US$) was US$2 063, the 37th largest in Africa and 24.3% larger than the average for low-income countries in Africa. However, the war between Ethiopia’s government and forces led by the Tigrayan People’s Liberation Front (TPLF) threatens to wipe away those economic gains.
On the Current Path, the GDP per person of Ethiopia is forecast to grow to US$5 888 by 2043, making it the 23rd largest in Africa and 55.4% above the average for low-income countries in the Current Path forecast.
Economic development depends more on sustainable growth over long periods than on bursts of explosive growth. Authorities in Ethiopia should make efforts to find a new political settlement that brings sustainable peace in the country, a critical condition to sustain growth, and improves living standards.
The informal economy comprises activities that have market value and would add to tax revenue and GDP if they were recorded. Countries with high informality have a whole host of development challenges, low revenue mobilisation, higher poverty, lower per capita incomes, greater inequality, weaker productivity investment, among others. Therefore, economic growth is below potential in countries with high levels of informality.
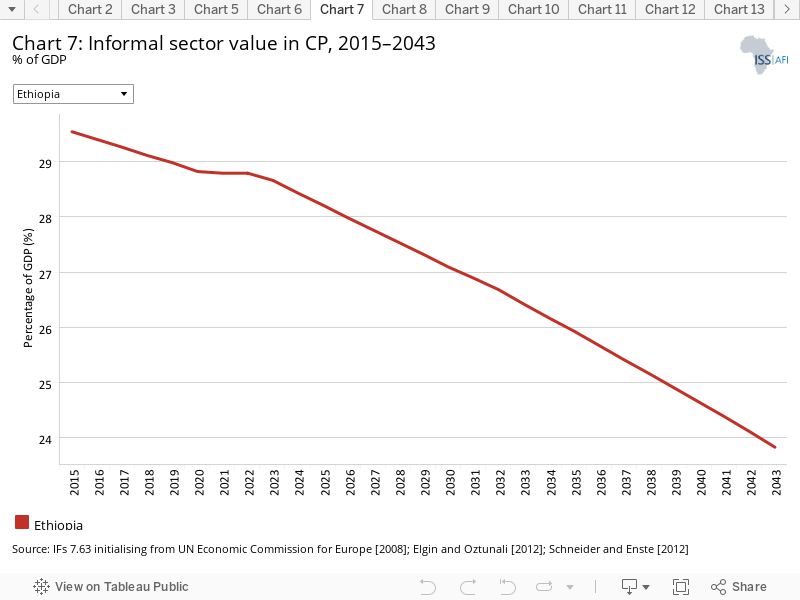
With the rise of unemployment, the informal sector has become the lifeblood of the growing population of young Ethiopians. In 2019, the size of the informal economy in Ethiopia represented 29% of the country's GDP, and by 2043 it is projected to modestly decline to 23.8%, slightly below the average of 25.8% for low-income countries in Africa.
Reducing informality will allow more people to benefit from better wages, social security packages and redistributive measures. Therefore, Ethiopia needs to reduce the size of its informal economy with the least friction possible by reducing the hurdles to registering a business, tackling corruption and improving access to education and finance.
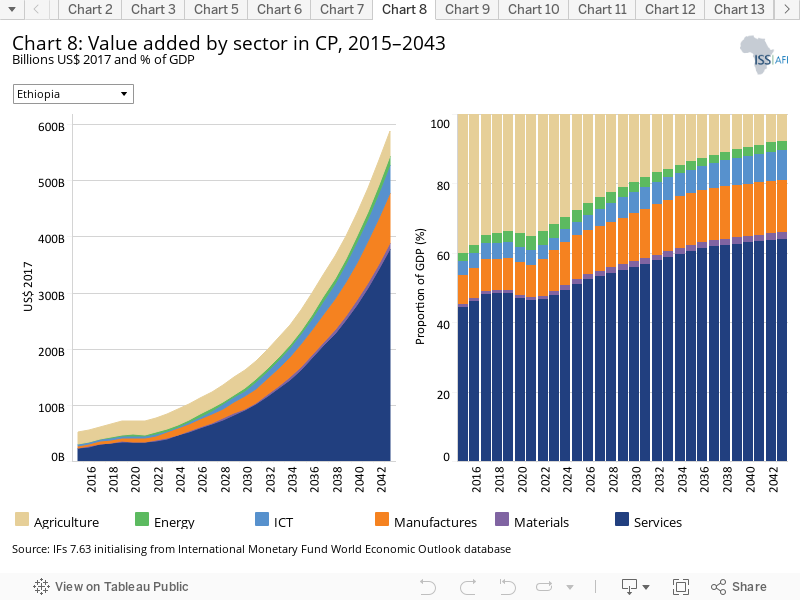
The IFs platform uses data from the Global Trade and Analysis Project (GTAP) to classify economic activity into six sectors: agriculture, energy, materials (including mining), manufacturing, services and information and communication technologies (ICT). Most other sources use a threefold distinction between only agriculture, industry and services with the result that data may differ.
The agriculture sector has historically been the backbone of the Ethiopian economy, although the service sector has recently overtaken it. Agriculture’s share in GDP has been falling, but it still employs about 75% of the country’s workforce.[6USAID, Ethiopia – Agriculture and food security] In 2019, the agriculture sector accounted for 33.6% of the country's GDP (US$23.7 billion), while the service sector represented 48.4% (US$34.1 billion). On the Current Path, the service sector is forecast to account for 64.1% of GDP (US$377.2 billion) by 2043.
In contrast, the agriculture sector will account for 7.7% of GDP (US$45 billion) by 2043, down from 33.6% of GDP in 2019, indicating the structural transformation of the economy. The Ethiopian government has determinedly pursued policies to develop its manufacturing sector. For example, over the period 2005–2017, on average, output in Ethiopia’s manufacturing sector grew by 11% annually. Over the past decade, manufacturing for export has gained a foothold in Ethiopia. Industrial parks and factories scattered across the country sprang up, many dedicated to making the textiles and clothing that often represent the first rung on the industrialisation ladder. Apparel giants like H&M and Primark began sourcing products from Ethiopian plants, and the value of clothing exports rose more than sixfold from 2009 to 2019.[7The Economist, The violence in Ethiopia imperils an impressive record growth, 20 November 2021] Foreign direct investment roughly quadrupled from 2011 to 2017, with about 80% into the manufacturing sector.[8The Economist, The violence in Ethiopia imperils an impressive record growth, 20 November 2021] However, the manufacturing sector is still at the embryonic stage and its contribution to job creation and output is far from being an engine for growth and economic transformation.
In 2019, the manufacturing sector accounted for 9.2% of Ethiopia’s GDP. It is forecast to overtake the agriculture sector from 2034 to become the second largest contributor to GDP reaching 15.1% of GDP, or US$89 billion, by 2043.
The ongoing conflict in the Tigray region will probably reduce investors’ appetite for Ethiopian destinations, and this could slow the growth in the manufacturing sector as it is mainly driven by foreign direct investment.
The energy sector accounted for 3.2% of GDP in 2019, and by 2043 will decline to 2.9%. The ICT and materials sectors accounted for 4.7% and 0.9% of GDP in 2019, and their contributions to GDP are forecast to be 8.4% and 1.9% in 2043, respectively.
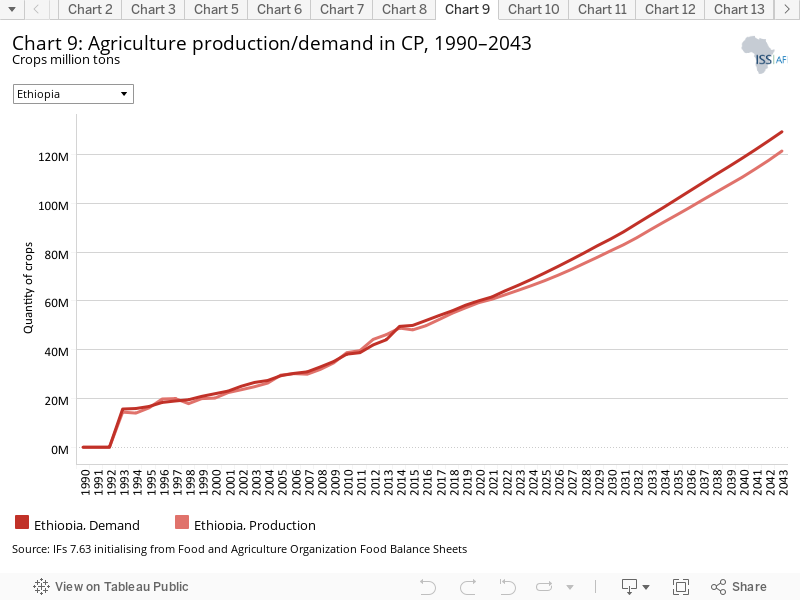
The data on agricultural production and demand in the IFs forecasting platform initialises from data provided on food balances by the Food and Agriculture Organization (FAO). IFs contains data on numerous types of agriculture but aggregates its forecast into crops, meat and fish, presented in million metric tons. Chart 9 shows agricultural production and demand as a total of all three categories.
Ethiopia’s economy is dependent on agriculture, which accounts for more than 30% GDP, 80% of exports, and an estimated 70% of the country's workforce.[9USAID, Ethiopia – Agriculture and food security] Despite improvement in the sector, just 5% of land is irrigated and crop yields from small farms are below regional averages, market linkages are weak, and the use of improved seeds, fertilisers and pesticides remains limited.[10USAID, Ethiopia – Agriculture and food security] Also, the sector remains highly vulnerable to drought and other environmental shocks like floods.
Agricultural (crop) production in 2019 stood at 57.1 million metric tons, slightly below the demand at 58.2 million metric tons. The gap between agricultural production and demand is forecast to widen from 2023, such that by 2043, agricultural (crop) production and demand are forecast to be 121.4 million metric tons and 129.3 million metric tons, respectively. This is equivalent to excess demand of 7.9 million metric tons that will likely be met through imports.
There are numerous methodologies for and approaches to defining poverty. We measure income poverty and use GDP per capita as a proxy. In 2015, the World Bank adopted the measure of US$1.90 per person per day (in 2011 international prices), also used to measure progress towards the achievement of Sustainable Development Goal (SDG) 1 of eradicating extreme poverty. To account for extreme poverty in richer countries occurring at slightly higher levels of income than in poor countries, the World Bank introduced three additional poverty lines in 2017:
- US$3.20 for lower middle-income countries
- US$5.50 for upper middle-income countries
- US$22.70 for high-income countries.
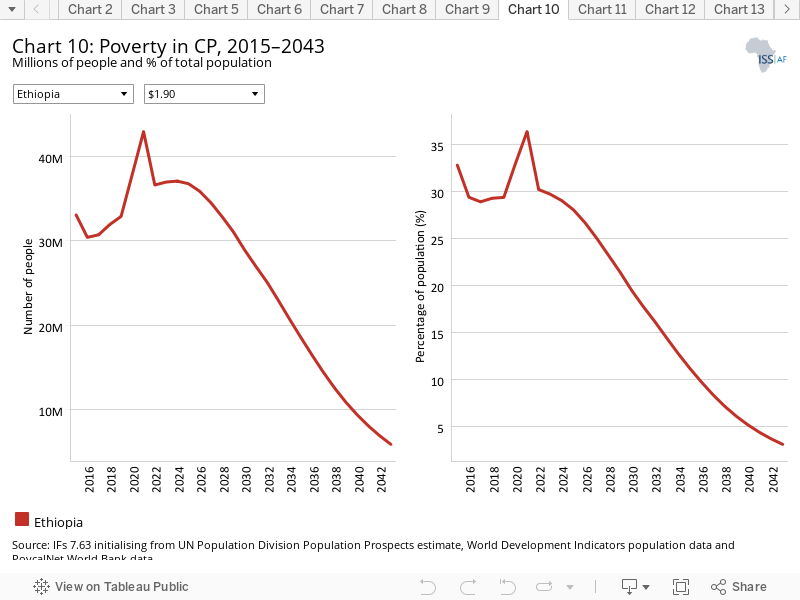
With its impressive economic growth record in the last two decades, Ethiopia has made significant progress in reducing its extreme poverty rate from 67% in 1995 to about 29% in 2019. Despite this progress, Ethiopia remains among the poorest countries in the world, where roughly 33 million people live in extreme poverty. A number of factors account for the high levels of poverty, which is widespread among the smallholder farmers. These farmers, who are unable to adopt modern technology and improved farming methods, lack basic health and economic infrastructure such as access to healthcare and educational facilities. Also, the frequent natural disasters, such as drought, and overgrazing etc. in the country makes it difficult to farm. As such, incomes from farming activities are susceptible to the weather,[11B Gomez, The main causes of poverty in Ethiopia, The Borgen Project] and the conflict in the Tigray region is likely to exacerbate this situation. The extreme poverty rate jumped to 36.4% in 2021 due to the economic slowdown caused by the conflict in Tigray and the COVID-19 pandemic. Inequality is also on the rise, mainly explained by the increasing disparity between urban and rural areas.[12World Bank, The World Bank in Ethiopia]
In the Current Path forecast, the extreme poverty rate at US$1.90 is projected to decline to 3.1% (5.9 million people) by 2043, significantly below the average of 25.1% for low-income countries in Africa.
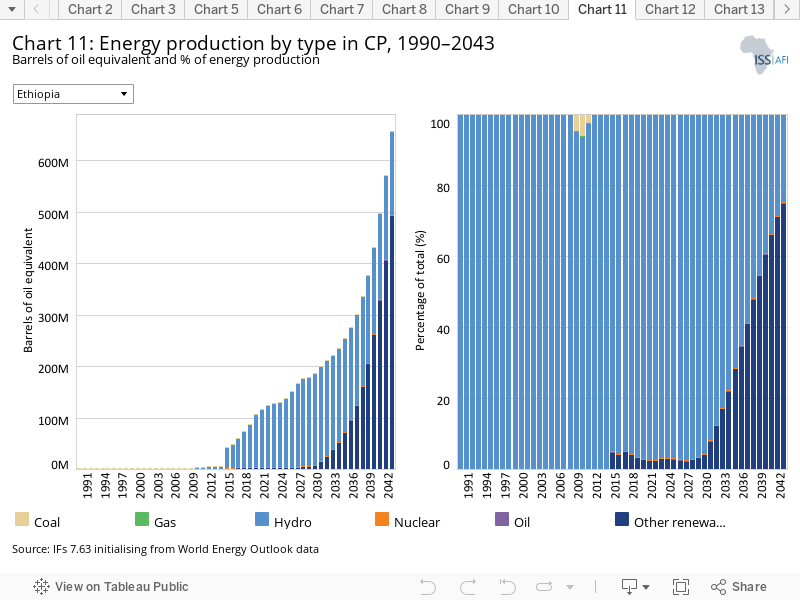
The IFs platform forecasts six types of energy, namely oil, gas, coal, hydro, nuclear and other renewables. To allow comparisons between different types of energy, the data is converted into billion barrels of oil equivalent (BBOE). The energy contained in a barrel of oil is approximately 5.8 million British thermal units (MBTUs) or 1 700 kilowatt-hours (kWh) of energy.
Hydro is the dominant source of energy produced in Ethiopia. In 2019, energy production from hydro stood at 85 million barrels of oil equivalent, or 96% of total energy production, while other renewable energy sources such as wind and thermal accounted for 3%. On the Current Path, hydro will account for 25% of energy production by 2043. The energy production from other renewable sources is currently at the embryonic stage. From a very low base, other renewable energy will account for 75% (493 million barrels of oil equivalent) of total energy production by 2043. Ethiopia has abundant renewable energy resources and has the potential to generate over 60 000 MW of electric power from hydroelectric, wind, solar and geothermal sources.[13IEA, Ethiopia Energy Outlook, 8 November 2019]
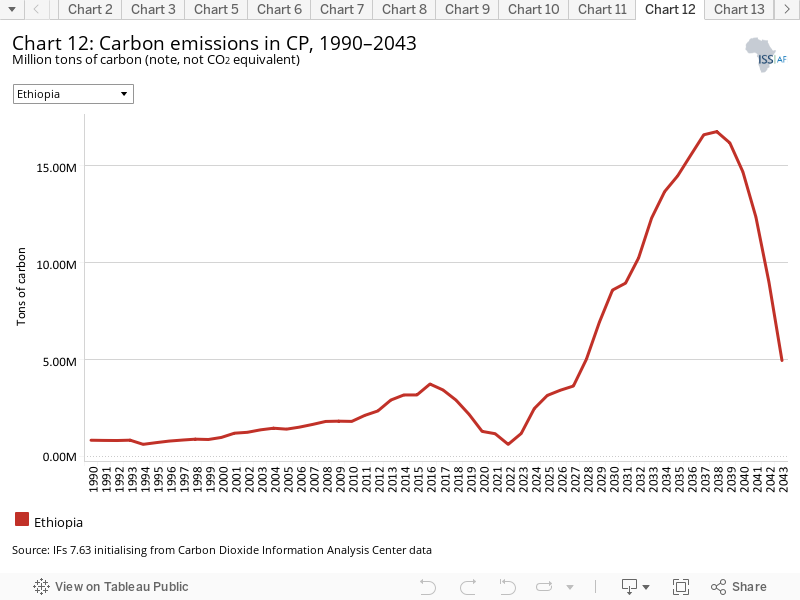
Carbon is released in many ways, but the three most important contributors to greenhouse gases are carbon dioxide (CO2), carbon monoxide (CO) and methane (CH4). Since each has a different molecular weight, IFs uses carbon. Many other sites and calculations use CO2 equivalent.
Annual carbon emissions, which were below 1 million tons until 2000, have risen due to increased economic activity in recent years. Carbon emissions increased from 0.97 million tons in 2000 to 2.2 million tons in 2019 after reaching 3.7 million tons in 2017. On the Current Path, carbon emissions in Ethiopia are forecast to peak at 16.8 million tons by 2038 before declining to 4.9 million tons by 2043. This estimated decline in carbon emissions may partly be explained by the country's projected increase in renewable energy production.
Developed economies must help Ethiopia and other developing African countries deal with the impact of climate change, which will disproportionately affect them.
Sectoral Scenarios for Ethiopia
Download to pdfThe Stability scenario represents reasonable but ambitious reductions in the risk of regime instability and lower levels of internal conflict. Stability is generally a prerequisite for other aspects of development and this would encourage inflows of foreign direct investment (FDI) and improve business confidence. Better governance through the accountability that follows substantive democracy is modelled separately.
The intervention is explained here in the thematic part of the website.
The war in Ethiopia has shown how instability can jeopardise an impressive economic growth record. Protracted conflict would likely undo most or all of the country’s past economic gains, demonstrating that a state's capacity to maintain order and stability is an important condition for development.
IFs’ governance security index ranges from 0 (low security) to 1 (high security). The score for Ethiopia on the governance security index was 0.65 in 2019, compared to 0.64 for low-income African countries. The Stability scenario improves security and stability in Ethiopia. By 2043, the score in the Stability scenario will be 0.85, about 15% higher than the Current Path forecast of 0.74 and 19.7% higher than the projected average of 0.71 on the Current Path for low-income African countries.
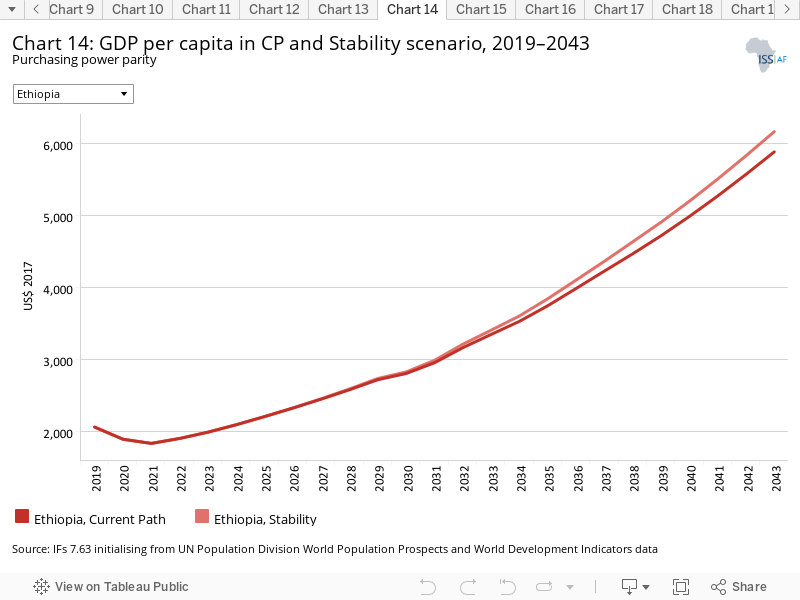
A new political settlement in Ethiopia would increase stability and encourage greater domestic and foreign investment, positively affecting per capita income growth. Thus, by 2033 Ethiopia's GDP per capita would be US$59 higher in the Stability scenario compared to the Current Path forecast for that year. In 2043, the difference would increase to US$281, with Ethiopia recording a GDP per capita of US$6 169 — 4.77% higher than the Current Path forecast of US$5 888. Ethiopia’s GDP per capita in the Stability scenario would be 62.8% above the projected average of US$3 790 for low-income African countries in the Current Path forecast by 2043.
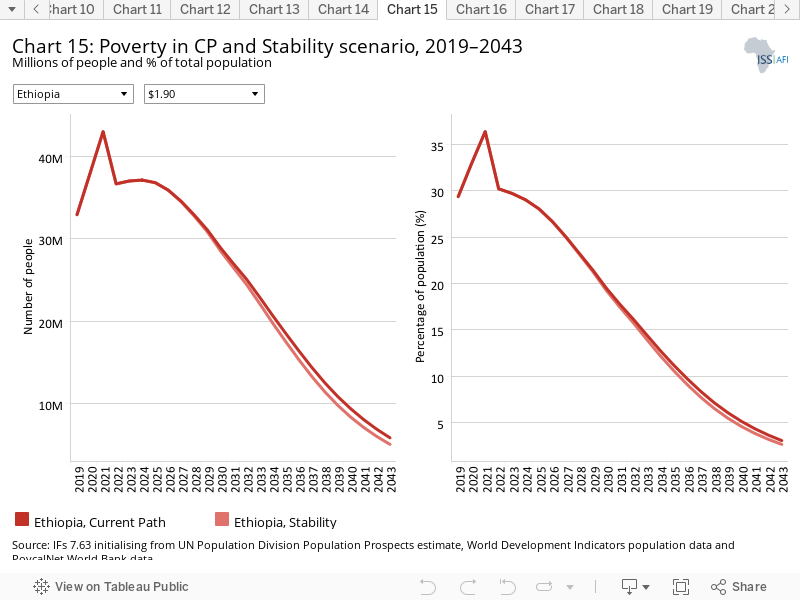
Stability in a country is an essential condition for economic growth and poverty reduction. When using the low-income countries' extreme poverty threshold of US$1.90, 32.9 million Ethiopians (29.4% of the population) were considered to be extremely poor in 2019. The number of poor people will stand at 5.1 million (2.6%) by 2043 in the Stability scenario, compared to 5.9 million (3.1%) in the Current Path forecast for that year — a difference of 800 000 fewer people in extreme poverty. The poverty rate in the Stability scenario (at US$1.90 per day) in 2043 is 22.6 percentage points below the projected average of 25.2% for low-income African countries in the Current Path forecast.
This section presents the impact of a Demographic scenario that aims to hasten and increase the demographic dividend through reasonable but ambitious reductions in the communicable-disease burden for children under five, the maternal mortality ratio and increased access to modern contraception.
The intervention is explained here in the thematic part of the website.
Demographers typically differentiate between a first, second and even a third demographic dividend. We focus here on the contribution of the size of the labour force (between 15 and 64 years of age) relative to dependants (children and the elderly) as part of the first dividend. A window of opportunity opens when the ratio of the working-age population to dependants is equal to or surpasses 1.7.
A demographic dividend can simply be defined as the economic growth generated by change in the structure of a country’s population. It generally materialises when the size of the working-age population increases faster than that of the dependants (elderly and children) to reach a minimum ratio of 1.7 to 1. In 2019, the ratio of the working-age population to dependants stood at 1.3 to 1, meaning that there are 1.3 persons of the working-age population for each dependant. The minimum ratio of 1.7 to 1 necessary for the materialisation of the demographic dividend will be reached in 2037 in the Demographic scenario, six years earlier than the Current Path forecast. On the Current Path, it is forecast to be 1.74 to 1 by 2043. In the Demographic scenario, the working-age population to dependants’ ratio is 2.14 to 1 by 2043 above the Current Path average of 1.53 to 1 for low-income African countries.
The increasing size of the working-age population in the Ethiopia can be a catalyst for growth if sufficient education and employment are provided to successfully harness their productive powers, otherwise it could turn into a demographic 'bomb' instead of demographic dividend, as many people of working age may remain in poverty, potentially creating frustration, social tension and conflict.
The infant mortality rate is the number of infant deaths per 1 000 live births and is an important marker of the overall quality of the health system in a country.
In 2019, the infant mortality rate in Ethiopia was 39.3 deaths per 1 000 live births — 9.2 deaths below the average of 48.5 for Africa’s low-income countries. The Demographic scenario reduces infant mortality to 16.9 deaths per 1 000 live births, compared to 22.1 in the Current Path forecast by 2033. By 2043, the infant mortality rate will be 8.2 deaths per 1 000 live births, compared to 10.6 in the Current Path forecast.
The infant mortality rate in the scenario is 13 deaths less than the average for low-income countries in Africa at 21.2 deaths per 1 000 live births by 2043.
By 2043, the GDP per capita of Ethiopia in the Demographic scenario will be US$6 178, US$290 more than in the Current Path forecast at US$5 888 — a nearly 5% improvement. The GDP per person in the scenario is also US$2 388, equivalent to 63% more than the projected average of US$3 790 for low-income African countries in the Current Path forecast in 2043.
When using the low-income countries' extreme poverty threshold of US$1.90, 32.9 million Ethiopians (29.4% of the population) were considered to be extremely poor in 2019. The number of poor people will stand at 4.6 million, or 2.6% of the population, by 2043 in the Demographic scenario, compared to 5.9 million, or 3.1%, in the Current Path forecast for that year — a difference of 1.3 million fewer people in extreme poverty. The poverty rate in the Demographic scenario in 2043 will be 22.6 percentage points below the Current Path forecast average of 25.2% for low-income African countries.
This section presents reasonable but ambitious improvements in the Health/WaSH scenario, which include reductions in the mortality rate associated with both communicable diseases (e.g. AIDS, diarrhoea, malaria and respiratory infections) and non-communicable diseases (NCDs) (e.g. diabetes), as well as improvements in access to safe water and better sanitation. The acronym WaSH stands for water, sanitation and hygiene.
The intervention is explained here in the thematic part of the website.
Recent trends in the health sector in Ethiopia have largely been positive. In the past 25 years, the government and donor organisations have made significant investments in health infrastructure accompanied by a roll out of health services, particularly for women and children. Since the late 1990s, the government and its development partners have founded 16 440 health posts and 3 547 health centres and built 311 hospitals.[14The Federal Democratic Republic of Ethiopia Ministry of Health, Ethiopia Health Sector Transformation Plan, October 2015] Given this broad and sustained investment, Ethiopia has made notable gains across various indicators related to health such as life expectancy, infant mortality and maternal mortality.
Life expectancy in Ethiopia has increased from 46.4 years in 1990 to 66.2 in 2019 — an increase of nearly 43% since 1990. This is 2.4 years more than the average of 63.7 years for low-income countries in Africa. Based on the Health/WaSH scenario, the average Ethiopian can expect to live up to 73.8 by 2043 compared to the Current Path forecast of 73.6 years. In the scenario, life expectancy in Ethiopia is three years higher than the projected average for low-income countries in Africa, at 70.9 years in 2043. On average, females had a higher life expectancy at birth of 67.1 years compared to 65.3 for males in 2019. In the Health/WaSH scenario, life expectancy at birth for females is projected to be 75 years by 2043 compared to 72.6 years for males.
Along with investing in basic healthcare improvements, Ethiopia has made significant progress towards lowering its infant mortality rate. Indeed, the infant mortality rate in Ethiopia has declined from 113.6 deaths per 1 000 live births in 1990 to about 39.3 deaths in 2019 — about 23.4% lower than the average for African countries at similar levels of income.
The Health/WaSH scenario reduces infant mortality rate to 9.7 deaths per 1 000 live births compared to 10.6 in the Current Path forecast by 2043. By 2043, the infant mortality rate in the scenario is less than half the projected average of 21.2 for low-income African countries.
The Agriculture scenario represents reasonable but ambitious increases in yields per hectare (reflecting better management and seed and fertiliser technology), increased land under irrigation and reduced loss and waste. Where appropriate, it includes an increase in calorie consumption, reflecting the prioritisation of food self-sufficiency above food exports as a desirable policy objective.
The intervention is explained here in the thematic part of the website.
The data on yield per hectare (in metric tons) is for crops but does not distinguish between different categories of crops.
The agriculture sector in Ethiopia has experienced impressive progress recently. For instance, between 2005 and 2015, total cereal yields increased by more than 85%, while the area harvested only increased by about 10%.[15Food and Agriculture Organization of the United Nations, Ethiopia] Despite this improvement, the sector still faces some challenges: just 5% of land is irrigated and crop yields from small farms are below regional averages; the use of improved seeds, fertilisers and pesticides remains limited.
In the Agriculture scenario, crop yields in Ethiopia improve from 3 tons per hectare in 2019 to 6.1 tons per hectare in 2043, compared to 3.8 tons in the Current Path forecast. This is 60.5% higher than the Current Path forecast and 74.3% above the projected average for low-income Africa at 3.5 tons per hectare in the Current Path forecast for that year.
Without significant efforts to improve agricultural production, the current low crop yield will continue to make Ethiopia a net food importer for the foreseeable future. Official Ethiopian trade statistics indicate that Ethiopia imports nearly US$2 billion worth of food products per annum.[16USDA Foreign Agricultural Service, Ethiopia: FAIRS Country Report, 30 September 2021] On the Current Path, the food import dependence will continue to increase to about 7.5% of food demand by 2043. However, in the Agriculture scenario, Ethiopia will record a food surplus equivalent to about 39% of total demand.
By 2043, the Agriculture scenario improves GDP per capita by about US$95 or 1.6% compared to the Current Path forecast, meaning the average Ethiopian will be earning US$5 983 at that stage. This will be US$2 193, or 57.9%, higher than the average for low-income countries in Africa in 2043.
The agriculture sector is a crucial lifeline for millions of Ethiopians as an estimated 75% of the country's workforce is employed in the agriculture sector. Using the US$1.90 per person per day extreme poverty threshold, the poverty rate in the Agriculture scenario by 2043 is 2%, compared to 3.1% in the Current Path forecast for the same year. This is equivalent to 1.96 million fewer people living in extreme poverty. The extreme poverty rate in the Agriculture scenario will be 23.2 percentage points below the Current Path average for low-income African countries.
Given that agriculture remains the predominant economic and cultural way of life, boosting the efficiency of the sector is vital to improving livelihoods and transforming the economy. More investment in the sector will increase consumption, income and food security, improve nutrition and even pave the way for agro-industry, positively affecting growth and poverty reduction.
The Education scenario represents reasonable but ambitious improved intake, transition and graduation rates from primary to tertiary levels and better quality of education. It also models substantive progress towards gender parity at all levels, additional vocational training at secondary school level and increases in the share of science and engineering graduates.
The intervention is explained here in the thematic part of the website.
Recent progress notwithstanding, the reality is that human development outcomes (education in particular) in Ethiopia are well below other low-income countries in Africa and around the globe. The average years of education in the adult population (aged 15 years and older) is a good indicator of the stock of education in a country. The average Ethiopian adult (15 years and older) received about 4.1 years of schooling in 2019. By contrast, the average adult in low-income African countries received 4.4 years of schooling. On average, males received about 4.7 years of schooling, 1.3 extra years of education compared to females at 3.4 years in 2019.
On the Current Path, the average years of education for the adult population (15 years and older) is projected to improve to 6.3 years by 2043. This is 0.2 years above the average for low-income countries in Africa. Technically, this means that most Ethiopians will have at least primary education by 2043. In the Education scenario, the mean years of education improves by 0.3 years above the Current Path forecast by 2043. Both the Education scenario and the Current Path forecast will reduce the gender gap of years of schooling in favour of males to 1.1 years from the 1.3 years by 2043.
Ethiopia’s education system faces enormous challenges at nearly every stage. Low attainment rates are fuelled by poor quality education and high learner-to-teacher ratios. As children and young people comprise the large share of the population, Ethiopia can lift itself out of poverty by ensuring children have access to quality education.
In the Education scenario, the score for the quality of primary education improves from 22.8 in 2019 to 30.9 in 2043, slightly above the Current Path average for low-income countries in Africa. This represents a 15.3% increase compared to the Current Path forecast of 26.8 in the same year. In addition, the score for the quality of secondary education increases from 34.3 in 2019 to 43.5 in 2043 in the scenario — a 17.8% improvement compared to the Current Path forecast of 36.9 in 2043 and 15.1% above the Current Path average for its income peers in Africa in the same year.
Quality education is crucial for economic development. It not only allows the country to increase its current added value but it also creates tomorrow's technological innovations. Thus, Ethiopian authorities should accelerate reforms to improve the quality of education in the country.
By 2043, the Education scenario will increase the GDP per capita by about US$181 above US$5 888 in the Current Path forecast — an increase of 3.1%. The projected GDP per capita of US$6 069 in the Education scenario will also be 60.1% more than the Current Path average of US$3 790 for low-income African countries. Investment in education significantly impacts economic growth, but it takes time to materialise. For instance, it will take more than a decade for a child enrolled in primary school to contribute meaningfully to the economy.
Education is one of the important tools to reduce poverty. It improves the employment and income prospects of the poor segment of society.
By 2043, Ethiopia will record a poverty rate of 2.4% (4.6 million people) in the Education scenario, compared to 3.1% (5.9 million people) in the Current Path forecast. This means 1.3 million fewer people will live in extreme poverty than in the Current Path forecast for 2043. The extreme poverty rate in the Education scenario will be 22.8 percentage points lower than Current Path average for low-income African countries.
The Manufacturing/Transfers scenario represents reasonable but ambitious manufacturing growth through greater investment in the economy, investments in research and development, and promotion of the export of manufactured goods. It is accompanied by an increase in welfare transfers (social grants) to moderate the initial increases in inequality that are typically associated with a manufacturing transition. To this end, the scenario improves tax administration and increases government revenues.
The intervention is explained here in the thematic part of the website.
Chart 30 should be read with Chart 8 that presents a stacked area graph on the contribution to GDP and size, in billion US$, of the Current Path economy for each of the sectors.
In absolute terms, the contribution of the service sector to GDP has the highest improvement compared to the Current Path forecast in 2043. It is forecast to be US$22.8 billion larger than in the Current Path forecast in 2043. The service sector is followed by the manufacturing sector with its contribution of US$6.8 billion above the Current Path in 2043. In terms of percentage of GDP, the share of the manufacturing sector in GDP is 0.29 percentage points of GDP larger in the Manufacturing/Transfers scenario than in the Current Path forecast in 2043. Services closely follow it with 0.23 percentage point of GDP above the Current Path forecast. Materials is third with an increase of only 0.03 percentage points compared to the Current Path forecast in 2043. The share of agriculture in GDP (%) is 0.34 percentage points lower in the scenario than the Current Path in 2043 — a trend that reflects the structural shifts occurring in Ethiopia’s economy. Although this trend is inevitable, it should not distract the Ethiopian government from the goal of improving productivity in the agriculture sector to achieve food security and improve livelihoods.
Compared to the Current Path, the Manufacturing/Transfers scenario increases household transfers and welfare by 66.1% to US$29.4 billion in 2043. This represents US$11.7 billion, or 66.1%, more than the Current Path forecast of US$17.7 billion. These transfers will be needed to address the initial increase in poverty generally associated with the investment in the manufacturing sector. Industrialisation is generally funded by an initial crunch in consumption which increases poverty in the first few years. However, these efforts stimulate inclusive growth with greater impact on poverty alleviation in the long term. To make the social safety net programmes more effective at reducing poverty, better targeting and efficient approaches are critical.
In the Manufacturing/Transfers scenario, the GDP per capita will be US$6 099 compared to US$5 888 in the Current Path forecast in 2043 — an increase of 3.6% (US$211). Manufacturing is important for economic growth due to its backward and forward linkages with other sectors and its ability to transform the productivity structures across an economy. Thus, a robust manufacturing sector is crucial for sustained growth and significantly improves the population's living standard.
At the poverty threshold of US$1.90, 32.9 million Ethiopians (29.4% of the population) were considered to be extremely poor in 2019. The number of poor people by 2043 will stand at 4.7 million, or 2.4% of the population, in the Manufacturing/Transfers scenario compared to 5.9 million, or 3.1%, in the Current Path forecast for that year — a difference of 1.2 million people. The poverty rate in the Manufacturing/Transfers scenario in 2043 is 22.7 percentage points below the projected average in the Current Path forecast for low-income African countries.
The Leapfrogging scenario represents a reasonable but ambitious adoption of and investment in renewable energy technologies, resulting in better access to electricity in urban and rural areas. The scenario includes accelerated access to mobile and fixed broadband and the adoption of modern technology that improves government efficiency and allows for the more rapid formalisation of the informal sector.
The intervention is explained here in the thematic part of the website.
Fixed broadband includes cable modem Internet connections, DSL Internet connections of at least 256 KB/s, fibre and other fixed broadband technology connections (such as satellite broadband Internet, ethernet local area networks, fixed-wireless access, wireless local area networks, WiMAX, etc.).
In terms of ICT, Ethiopia, Djibouti and Eritrea are the only three countries in the world that have maintained state monopoly on all telecommunication services, including fixed lines, mobile, Internet and broadband. As a consequence, penetration rates have remained low despite the progress made in recent years. For instance, 19% of Ethiopians are Internet users.[17K Yeboua and J Cilliers, Development Prospects for the Horn of Africa Countries to 2040, East Africa Report 42, Institute of Security Studies, 20 October 2021] However, efforts to partially privatise the public operator Ethio Telecom and open the market to new licences are underway. In May 2021, the Ethiopian government granted telecoms operating licences worth US$850 million to Kenya’s Safaricom-led consortium.[18J Afrique, Ethiopia rewards Safaricom-led consortium with telco licence, The Africa Report, 25 May 2021]
Fixed broadband subscriptions stood at roughly 2.3 per 100 people in 2019, on par with the average for low-income countries in Africa. In the Leapfrogging scenario, fixed broadband subscriptions increase to 50 per 100 people by 2043, which is about 4% higher than the Current Path forecast of 48.2 subscriptions per 100 people for the same year.
Mobile broadband refers to wireless Internet access delivered through cellular towers to computers and other digital devices.
Mobile broadband subscriptions stood at 12.8 per 100 people in Ethiopia in 2019, about 79% below the average of 22.9 for low-income Africa. In the Leapfrogging scenario, mobile broadband subscriptions per 100 people in Ethiopia increase to 153.4 by 2043, above the Current Path forecast of 144.6. In other words, mobile broadband subscriptions in the scenario are about 9 subscriptions per 100 people, or 6.1%, higher than the Current Path forecast for 2043. It will further be 14.6% higher than the Current Path average for low-income countries in Africa.
Over the past decade, the Ethiopian government has managed to expand the electricity grid to nearly 60% of the country, from only 667 towns and villages to approximately 6 000.[19World Bank, ESMAP Impact, Ethiopia’s energy sector transformation, Issue 18, November 2019] The target of the Ethiopian government is universal electricity access by 2025, with 35% being off-grid and 65% grid.[20World Bank, ESMAP Impact, Ethiopia’s energy sector transformation, Issue 18, November 2019] The Grand Ethiopian Renaissance Dam (GERD), with a projected installed capacity of 5 600 MW, will contribute significantly to improve electricity generating capacity and electricity access rate.
The number of Ethiopians who had access to electricity in 2019 was 52.3 million people, representing 46.6% of the total population. This is above the average of 32.2% for low-income countries in Africa. However, access to electricity is skewed toward the urban areas. In 2019, about 88.2% of the urban population had access to electricity, compared to only 35.9% in rural areas. In the Leapfrogging scenario, Ethiopia achieves universal electricity access by 2043, compared to 83.7% in the Current Path forecast.
By 2033, all the urban population (100%) is forecast to have access to electricity in the Leapfrogging scenario compared to 95.4% in the Current Path forecast in the same year. In the rural areas, electricity access rate will reach 100% by 2043 in the Leapfrogging scenario compared to nearly 75.9% in the Current Path forecast for the same year.
Widespread access to electricity and high-speed Internet has the potential to improve a country's socio-economic outcomes. Broadband can increase productivity, reduce transaction costs and optimise supply chains, thus positively affecting economic growth.
By 2033, the GDP per capita in the Leapfrogging scenario will be at US$3 512, compared to US$3 351 in the Current Path forecast — a difference of US$161. In 2043, this difference will grow to US$451, representing 7.7% above the Current Path forecast. The GDP per capita in the Leapfrogging scenario is US$2 549, or 67.3%, higher than the Current Path for the average for low-income countries in Africa in 2043.
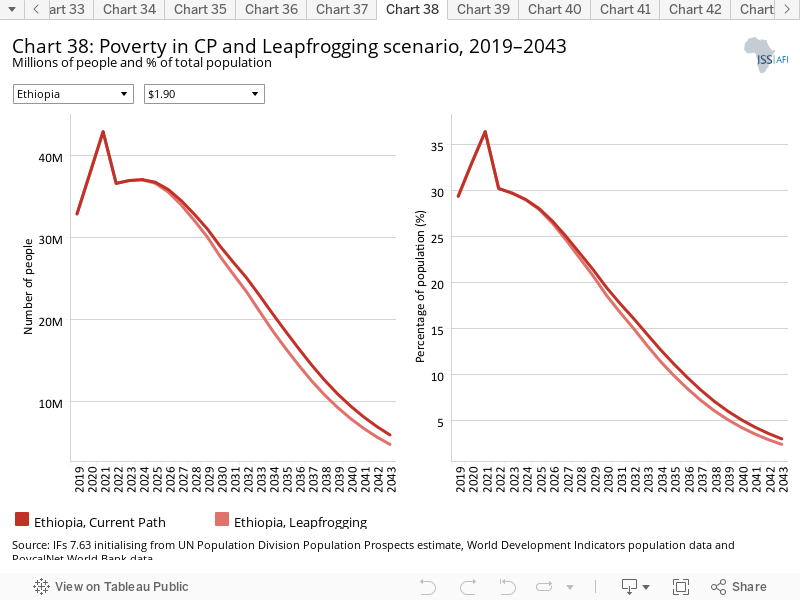
In the Leapfrogging scenario, the number of poor people in 2043 is 4.7 million, representing 2.5% of the population. This is 1.15 million fewer poor people (equivalent to a 0.6 percentage point decline) than the Current Path forecast for the same year. In the Current Path forecast for other countries, the poverty rate in the Leapfrogging scenario by 2043 is 22.7 percentage points below the projected average for Africa’s low-income countries.
The Free Trade scenario represents the impact of the full implementation of the African Continental Free Trade Area (AfCFTA) by 2034 through increases in exports, improved productivity and increased trade and economic freedom.
The intervention is explained here in the thematic part of the website.
The trade balance is the difference between the value of a country's exports and its imports. A country that imports more goods and services than it exports in terms of value has a trade deficit, while a country that exports more goods and services than it imports has a trade surplus.
The external trade pattern of Ethiopia is similar to that of many other African countries that rely on a few key primary commodity exports while importing higher-value manufactured goods, consumer items and foodstuffs. Coffee is the main export product of Ethiopia. Going forward, this is likely to change as the country is doing relatively well in developing its manufacturing sector.
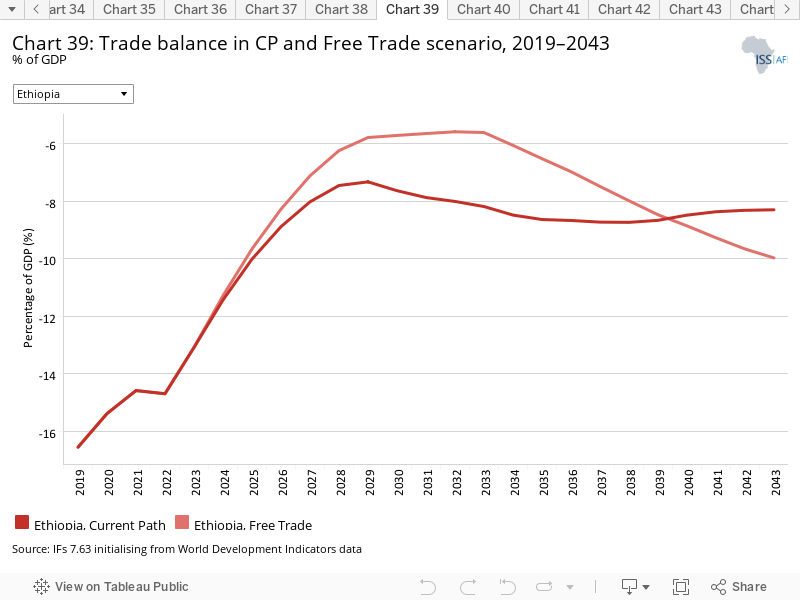
In 2019, the country's trade deficit amounted to nearly 16.6% of GDP. In the Free Trade scenario, Ethiopia’s trade balance improves to reach a deficit of 5.6% of GDP in 2033. After that, the trade deficit increases to nearly 10% of GDP by 2043 compared to a deficit of 8.3% of GDP in the Current Path forecast. With the removal of trade restrictions, following trade liberalisation, it becomes easier to import while Ethiopian firms face intense competition on the export markets. However, only using the trade balance is not a viable indicator to conclude that in the long term, Ethiopia will be a loser in the implementation of AfCFTA, as other indicators need to be considered too.
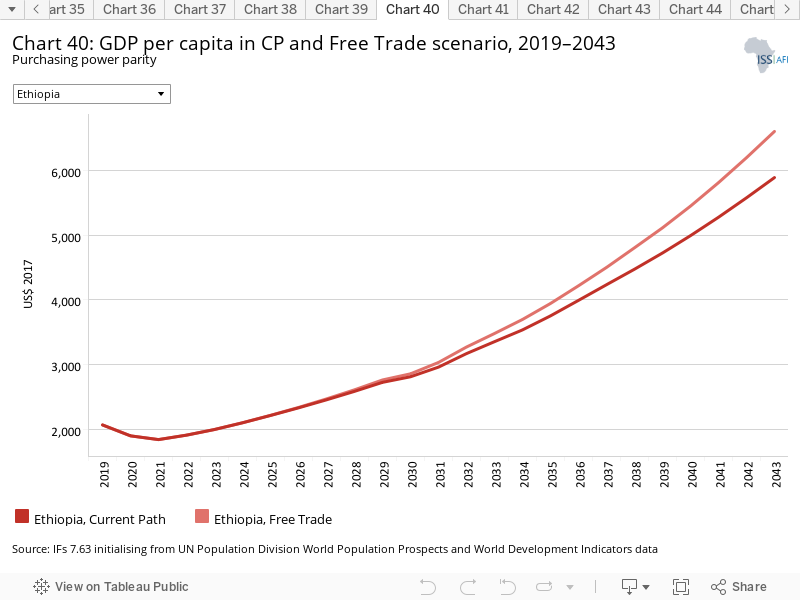
Generally, trade liberalisation improves productivity through competition and technology diffusion, stimulating growth and raising income levels. In the Current Path forecast, GDP per capita increases from US$2 063 in 2019 to US$5 888 in 2043 but is US$6 602 in the Free Trade scenario, an increase of US$714 above the Current Path forecast for that year. This shows that the full implementation of AfCFTA will enhance economic growth in Ethiopia.
Trade openness will reduce poverty in the long term after initially increasing it due to the redistributive effects of trade. Most African countries export primary commodities and low-tech manufacturing products, and therefore a continental free trade agreement (AfCFTA) that reduces tariffs and non-tariff barriers across Africa will increase competition among countries in primary commodities and low-tech manufacturing exports. Countries with inefficient, high-cost manufacturing sectors might be displaced as the AfCFTA is implemented, thereby pushing up poverty rates. In the long term, as the economy adjusts and produces and exports its comparatively advantaged (lower relative cost) goods and services, poverty rates will decline.
The poverty rate at US$1.90 in the Free Trade scenario is 2.3% (4.4 million people) in 2043 compared to 3.1% in the Current Path forecast — this is equivalent to 1.46 million fewer poor people living in extreme poverty than on the Current Path. The full implementation of the AfCFTA will improve growth, raise incomes and reduce Ethiopia’s poverty. In 2043, the projected poverty rate in the Free Trade scenario of 2.3% is far below the average of 25.2% in the Current Path forecast for low-income Africa.
The Financial Flows scenario represents a reasonable but ambitious increase in worker remittances and aid flows to poor countries, and an increase in the stock of foreign direct investment (FDI) and additional portfolio investment inflows to middle-income countries. We also reduced outward financial flows to emulate a reduction in illicit financial outflows.
The intervention is explained here in the thematic part of the website.
Many countries in sub-Saharan Africa are still heavily dependent on foreign aid to provide basic services like education and health. This is the case of Ethiopia. In absolute terms, most aid inflows into the Horn of Africa go to Ethiopia. Aid constituted roughly 6% of the country's GDP in 2019, below the average of 8.5% of GDP for low-income Africa. In the Financial Flows scenario, foreign aid flows to Ethiopia as a percentage of GDP will converge with the Current Path forecast to reach 1.05% of GDP by 2043, which is below the average of 3.8% of GDP for low-income countries in Africa.
The Ethiopian government has recently implemented several policies and reforms to attract more foreign direct investment, especially to the manufacturing sector. In absolute terms, most FDI inflows into the Horn of Africa go to Ethiopia. Foreign direct investment flows to Ethiopia roughly quadrupled from 2011 to 2017, and the vast majority — about 80% — flowed into the manufacturing sector.[21The Economist, The violence in Ethiopia imperils an impressive record growth, 20 November 2021] However, it still remains below the level that could be a game changer for the country’s development, probably due to political instability and poor business climate. In the 2020 Doing Business report by the World Bank, Ethiopia ranked 159 out of 190 countries.[22World Bank, Doing Business report]
In 2019, FDI inflows represented 2.6% of the country's GDP, below the 4.3% average for low-income African countries. It dropped to 1.4% in 2020 due to political turmoil and the COVID-19 pandemic and its associated economic crisis.
In the Financial Flows scenario, FDI inflows in 2043 will represent about 3.4% of GDP compared to 3.1% on the Current Path but remain below the Current Path average of 4.7% of GDP for low-income countries. FDI can act as a catalyst for economic development as it brings much needed capital and technology to recipient countries. A diplomatic resolution to the conflict in Tigray would help Ethiopia regain investor confidence and attract more FDI.
International remittance is an essential source of foreign exchange for Ethiopia. Official remittance flows to Ethiopia reached US$5 billion in 2018 — a large increase from only US$140 million in 2002/03.[23K Yeboua and J Cilliers, Development Prospects for the Horn of Africa Countries to 2040, East Africa Report 42, Institute of Security Studies, 20 October 2021] The actual amount is likely much larger as informal remittances are not captured in official data.
Remittances flows to Ethiopia amounted to US$1.7 billion in 2019, or 2.4% of GDP above the average of 1.1% of GDP for low-income countries in Africa. Across the forecast horizon, Ethiopia remains a net recipient of remittances. In the Financial Flows scenario, the total net remittances to Ethiopia are US$19.7 billion (3.3% of GDP) by 2043, compared with US$18.1 billion (3.1% of GDP) in the Current Path forecast for 2043. Remittances as a percentage of GDP to Ethiopia in 2043 will be 2 percentage points higher than the average for low-income countries in Africa.
In the Financial Flows scenario, the GDP per capita of Ethiopia increases from US$2 063 in 2019 to US$5 939 in 2043, which is US$51 (0.9%) higher than in the Current Path forecast for the same year. Overall, the Financial Flows scenario has a marginal impact on GDP per capita in Ethiopia. FDI, for instance, can boost growth and development but is not straightforward. Studies have shown that the impact of FDI on economic growth is conditional on the recipient countries’ absorptive capacities (domestic conditions) such as the level of human capital stock, infrastructure development, financial development and institutional development, among others.[24K Yeboua, Foreign Direct Investment and Economic Growth in Africa: New Empirical Approach on the Role of Institutional Development, Journal of African Business, 22:3, 2021, 361–78.] Ethiopian authorities should not only implement policies to attract FDI but they should also improve domestic conditions to harness the growth enhancing effect of FDI and other external financial flows.
The Financial Flows scenario reduces the number of extremely poor Ethiopian people by only additional 310 000 by 2043 compared to the Current Path forecast, using the US$1.90 poverty threshold. Whereas 29.4% of the Ethiopian population lived in extreme poverty in 2019, by 2043, it would be 2.9% in the Financial Flows scenario compared to 3.1% in the Current Path forecast. The extreme poverty rate in this scenario will be 22.3 percentage points lower than Current Path average for low-income African countries.
The Infrastructure scenario represents a reasonable but ambitious increase in infrastructure spending across Africa, focusing on basic infrastructure (roads, water, sanitation, electricity access and ICT) in low-income countries and increasing emphasis on advanced infrastructure (such as ports, airports, railway and electricity generation) in higher-income countries.
Note that health and sanitation infrastructure is included as part of the Health/WaSH scenario and that ICT infrastructure and more rapid uptake of renewables are part of the Leapfrogging scenario. The interventions there push directly on outcomes, whereas those modelled in this scenario increase infrastructure spending, indirectly boosting other forms of infrastructure, including those supporting health, sanitation and ICT.
The intervention is explained here in the thematic part of the website.
In 2019, the total number of people with access to electricity in Ethiopia was 52.3 million, representing 46.6% of the population. The Infrastructure scenario increases it to 165.7 million in 2043, constituting 86.2% of the population. This is above the projected value of 160.8 million, representing 83.7% of the population, in the Current Path forecast.
By 2043 it is projected that 100% of the urban population in Ethiopia will have access to electricity in the Infrastructure scenario, compared to 99.9% in the Current Path forecast. In the Infrastructure scenario and Current Path forecast, 79.6% (102.5 million people) and 75.8% (97.66 million people) of the rural population, respectively, will have access to electricity in 2043, indicating the disparity in access to electricity between the urban and rural population in Ethiopia.
Indicator 9.1.1 in the Sustainable Development Goals refers to the proportion of the rural population who live within 2 km of an all-season road and is captured in the Rural Access Index.
Accessibility to rural areas spurs on socio-economic development and improves the rural population’s living standards. Better rural roads facilitate trade between rural and urban areas. For instance, they enable the rural population to enjoy products and amenities from nearby urban areas while allowing the urban population to more easily access agricultural products supplied by the population in rural areas.
In 2019, 46% of the rural population in Ethiopia resided within 2 km of an all-weather road, above the average of 43% for low-income African countries. In the Infrastructure scenario, it is projected to increase to 64.1% by 2043, slightly above the 58.8% projected in the Current Path forecast for that year and the 51% estimated for average low-income African countries on the Current Path.
Quality infrastructure not only enables business and industry development but also increases efficiency in the delivery of social services. Important basic infrastructure, such as roads and electricity, play a vital role in achieving sustainable and inclusive economic growth.
The Ethiopia's GDP per capita is forecast to rise to US$6 136 by 2043 in the Infrastructure scenario. This is US$248, or 4.2%, more than the Current Path forecast and 61.9% more than the Current Path forecast average of US$3 790 for low-income African countries in 2043.
The provision of quality roads reduces transaction costs, improves productivity and stimulates growth with a positive effect on poverty reduction. In the case of Ethiopia in particular, the provision of an improved transportation network will afford rural farmers the opportunity to have a readily accessible urban market to sell their products, reduce post-harvest losses and increase income thereby reducing household poverty which is widespread among the farmers.
In the Infrastructure scenario, the extreme poverty rate is projected to decline from 29.4% in 2019 to 2.7% in 2043, which is equivalent to 5.2 million poor people in 2043, compared to 5.9 million in the Current Path forecast. This suggests 700 000 fewer people will be living in extreme poverty in the Infrastructure scenario than in the Current Path forecast for the same year. The extreme poverty rate of 2.7% in the scenario by 2043 is far below the projected Current Path forecast average of 25.2% for low-income African countries.
The Governance scenario represents a reasonable but ambitious improvement in accountability and reduces corruption, and hence improves the quality of service delivery by government.
The intervention is explained here in the thematic part of the website.
As defined by the World Bank, government effectiveness ‘captures perceptions of the quality of public services, the quality of the civil service and the degree of its independence from political pressures, the quality of policy formulation and implementation, and the credibility of the government’s commitment to such policies’.
Chart 51 presents the impact of the interventions in the Governance scenario on government effectiveness.
The Ethiopian government has been engaged in several reform programmes to improve the delivery of services within the public sector. According to the 2020 Ibrahim Index of African Governance, Ethiopia is the only country to have improved in all 16 sub-categories of governance during the period 2010–2019.[25Mo Ibrahim Foundation, 2020 Ibrahim Index of African Governance: Key Findings, 25 November 2020]
In the Current Path forecast and in the Governance scenario, the government effectiveness score for Ethiopia is projected to increase. The projected score for government effectiveness in the Governance scenario by 2043 is 2.8 (out of a maximum of 5), up from the 1.9 in 2019. This is 0.2 points higher than the projected score of 2.6 in the Current Path forecast for the same year. Ethiopia will still have a higher government effectiveness score than the projected Current Path forecast average of 1.9 for low-income African countries by 2043.
Critical determinants of growth depend on governance and the institutional settings in a country. In the Governance scenario, Ethiopia's GDP per capita is projected to increase to US$6 075 in 2043, which is US$187, or 3.1%, more than the Current Path forecast for the same year. The GDP per capita of US$6 075 in the scenario in 2043 is 60.3% above the Current Path forecast average of US$3 790 for low-income countries in Africa for the same year.
Using the US$1.90 poverty threshold for low-income countries, the poverty rate in Ethiopia is projected to decline to 2.8% in 2043 in the Governance scenario, which is far below the projected average of 25.1% for low-income countries in Africa. The poverty rate of 2.8% in the scenario in 2043 equates to 520 000 fewer poor people than in the Current Path forecast by 2043.
This section presents projections for carbon emissions in the Current Path for Ethiopia and the 11 scenarios. Note that IFs uses carbon equivalents rather than CO2 equivalents.
In 2019, Ethiopia released about 2.2 million tons of carbon, and in the Current Path forecast the country will release 4.9 million tons by 2043 — an increase of 122.7%. Although carbon emissions are set to increase as economic activity increases, Ethiopia's carbon emissions come from a very low base. Like many developing countries, the country will disproportionately suffer from climate change which it has contributed very little to. Nonetheless, the country must reduce its carbon emissions and move towards renewable energy for sustainable growth to mitigate climate change.
The Free Trade scenario has the most significant impact on carbon emissions by 2043. The Leapfrogging scenario has the lowest level of carbon emissions. By 2043, the carbon emissions range from 8.3 million tons for the Free Trade scenario, 67.3% higher than the Current Path forecast, to 2.3 million tons of carbon in the Leapfrogging scenario.
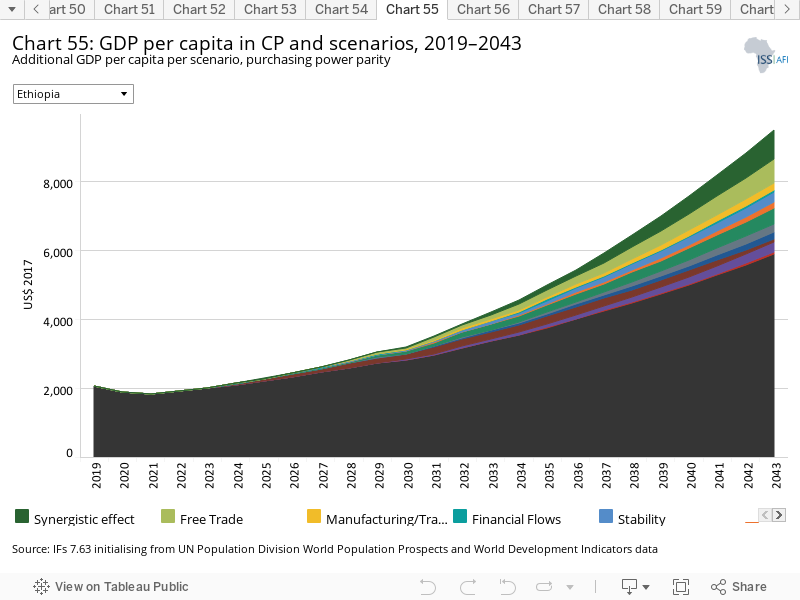
The Combined Agenda 2063 scenario consists of the combination of all 11 sectoral scenarios presented above, namely the Stability, Demographic, Health/WaSH, Agriculture, Education, Manufacturing/Transfers, Leapfrogging, Free Trade, Financial Flows, Infrastructure and Governance scenarios. The cumulative impact of better education, health, infrastructure, etc. means that countries get an additional benefit in the integrated IFs forecasting platform that we refer to as the synergistic effect. Chart 55 presents the contribution of each of these 12 components to GDP per capita in the Combined Agenda 2063 scenario as a stacked area graph.
The synergistic effect of all the scenarios on the GDP per capita is US$819.7 in 2043. The scenario with the most significant impact on the GDP per capita by 2043 is the Free Trade scenario followed by the Leapfrogging scenario, while the Health/WaSH scenario has the least impact on GDP per capita. The full implantation of the AfCFTA and investment in agriculture and ICT sectors will improve human and economic development the most in Ethiopia.
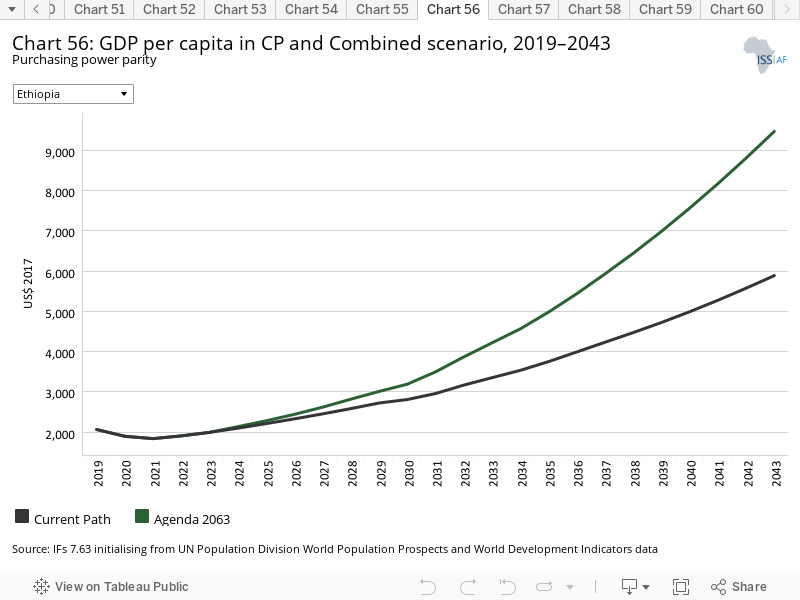
Whereas Chart 55 presents a stacked area graph on the contribution of each scenario to GDP per capita as well as the additional benefit or synergistic effect, Chart 56 presents only the GDP per capita in the Current Path forecast and the Combined Agenda 2063 scenario.
In the Combined Agenda 2063 scenario, It is assumed that the Government of Ethiopia makes a concerted effort to remove the binding constraints to growth and development. The Combined Agenda 2063 scenario has a much greater impact on the GDP per capita compared to the individual thematic scenarios. By 2033, the GDP per capita of Ethiopia in the Combined Agenda 2063 scenario is US$865, or 25.85%, larger than in the Current Path forecast, and by 2043 it would come to US$9 472, US$3 584, or 60.9%, more than in the Current Path forecast for that year. Furthermore, GDP per capita in the Combined Agenda 2063 scenario will be 2.5 times more than the average of US$3 790 for low-income African countries on the Current Path.
The Combined Agenda 2063 scenario shows that a policy push across all the development sectors is necessary to achieve sustained growth and development Ethiopia.
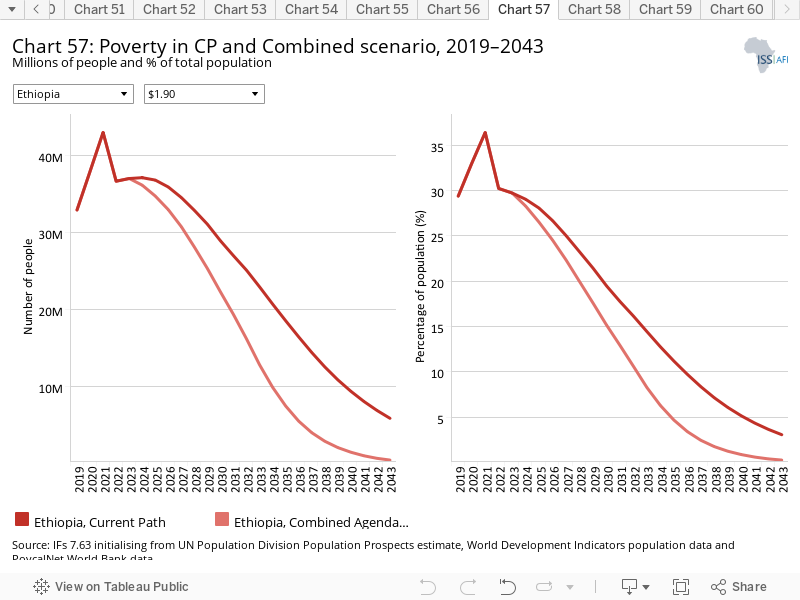
In the Combined Agenda 2063 scenario, by 2033 8.2% of Ethiopians will be living in extreme poverty compared to 14.4% in the Current Path forecast. This represents about 10 million fewer people living in extreme poverty compared to the 22.9 million in the Current Path forecast. By 2043, the extreme poverty rate in the Combined Agenda 2063 scenario will be only 0.3% (450 000 people) compared to 3.1% (5.9 million people) in the Current Path forecast — a reduction of 5.4 million people. The Combined Agenda 2063 scenario shows that a concerted policy push across all the development sectors could significantly reduce poverty in Ethiopia.
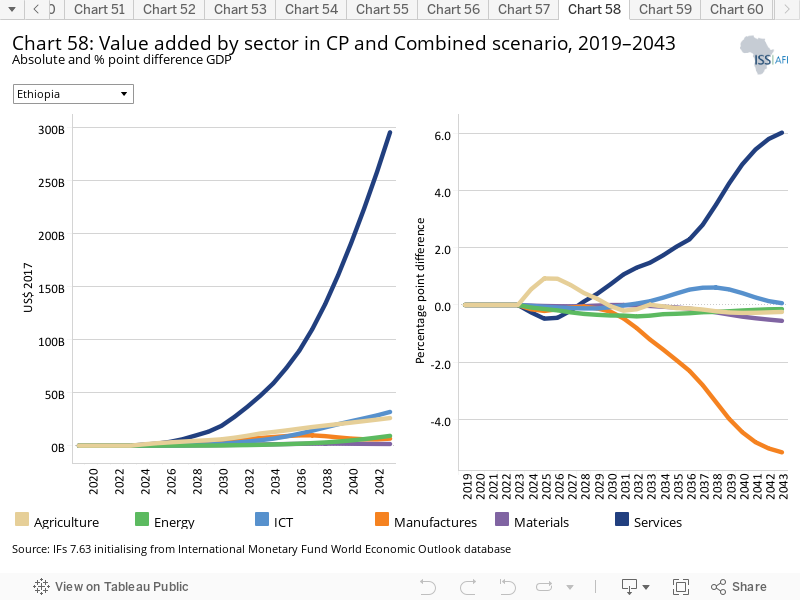
See Chart 8 to view the Current Path forecast of the sectoral composition of the economy.
In absolute terms, the contribution of the service sector to GDP will experience the largest improvement compared to the Current Path forecast by 2043. The contribution of the service sector in the Combined Agenda 2063 scenario is US$295.7 billion larger than in the Current Path forecast for 2043. The service sector is followed by the ICT and agriculture sectors, with their contributions to GDP in the scenario US$31.8 billion and US$26 billion larger than in the Current Path forecast, respectively.
As a percentage of GDP, the contribution of the service sector in the Combined Agenda 2063 scenario is 6 percentage points larger than the Current Path forecast for 2043, while the contribution of the manufacturing sector in the Combined Agenda 2063 is 5.2 percentage points lower than the Current Path forecast.
In sum, the service sector will continue to be the dominant sector of the Ethiopian economy, but the manufacturing sector will grow appreciably in the Combined Agenda 2063 scenario.
The Combined Agenda 2063 scenario dramatically impacts the expansion of the Ethiopian economy (GDP). In the Combined Agenda 2063 scenario, the size of the economy is projected to expand from US$70.6 billion in 2019 to US$959.4 billion in 2043, which is a 1 259% increase over the period compared to 733.7% in the Current Path forecast over the same period. In 2043, the GDP of Ethiopia in the Combined Agenda 2063 scenario is about US$370.8 billion, or 63%, larger than in the Current Path forecast for the same year.
The Combined Agenda 2063 scenario shows the benefit of a widespread policy push across all development sectors in achieving sustained growth in Ethiopia.
The Combined Agenda 2063 scenario significantly impacts carbon emissions, albeit from a very low base, due to the increased economic activity. In this scenario, carbon emissions increase from about 2.5 million tons in 2019 to peak at 23.9 million tons in 2039 before declining to 9.7 million tons by 2043. In 2043, the carbon emissions in the Combined Agenda 2063 scenario are 4.8 million tons, or 96.2%, higher than in the Current Path forecast.
The materialisation of the Combined Agenda 2063 scenario would stimulate high economic growth and eliminate extreme poverty in Ethiopia, but the cost in terms of environmental degradation is relatively high. To mitigate the environmental impact of the Combined Agenda 2063 scenario, its implementation should be accompanied by concrete steps to accelerate the green energy transition.
Endnotes
S Gebre, U.S. terminates duty-free trade access to Ethiopia over conflict, Bloomberg, 24 December 2021
UNHCR, Ethiopia
Trading Economics, Ethiopia unemployment rate
Country Studies, Ethiopia — Urbanization
World Bank, The World Bank in Ethiopia
The Economist, The violence in Ethiopia imperils an impressive record growth, 20 November 2021
The Economist, The violence in Ethiopia imperils an impressive record growth, 20 November 2021
B Gomez, The main causes of poverty in Ethiopia, The Borgen Project
World Bank, The World Bank in Ethiopia
IEA, Ethiopia Energy Outlook, 8 November 2019
The Federal Democratic Republic of Ethiopia Ministry of Health, Ethiopia Health Sector Transformation Plan, October 2015
Food and Agriculture Organization of the United Nations, Ethiopia
USDA Foreign Agricultural Service, Ethiopia: FAIRS Country Report, 30 September 2021
K Yeboua and J Cilliers, Development Prospects for the Horn of Africa Countries to 2040, East Africa Report 42, Institute of Security Studies, 20 October 2021
J Afrique, Ethiopia rewards Safaricom-led consortium with telco licence, The Africa Report, 25 May 2021
World Bank, ESMAP Impact, Ethiopia’s energy sector transformation, Issue 18, November 2019
World Bank, ESMAP Impact, Ethiopia’s energy sector transformation, Issue 18, November 2019
The Economist, The violence in Ethiopia imperils an impressive record growth, 20 November 2021
World Bank, Doing Business report
K Yeboua and J Cilliers, Development Prospects for the Horn of Africa Countries to 2040, East Africa Report 42, Institute of Security Studies, 20 October 2021
K Yeboua, Foreign Direct Investment and Economic Growth in Africa: New Empirical Approach on the Role of Institutional Development, Journal of African Business, 22:3, 2021, 361–78.
Mo Ibrahim Foundation, 2020 Ibrahim Index of African Governance: Key Findings, 25 November 2020
Page information
Contact at AFI team is Kouassi Yeboua
This entry was last updated on 13 December 2023 using IFs v7.63.
Donors and sponsors


Reuse our work
- All visualizations, data, and text produced by African Futures are completely open access under the Creative Commons BY license. You have the permission to use, distribute, and reproduce these in any medium, provided the source and authors are credited.
- The data produced by third parties and made available by African Futures is subject to the license terms from the original third-party authors. We will always indicate the original source of the data in our documentation, so you should always check the license of any such third-party data before use and redistribution.
- All of our charts can be embedded in any site.
Cite this research
Kouassi Yeboua (2024) Ethiopia. Published online at futures.issafrica.org. Retrieved from https://futures.issafrica.org/geographic/countries/ethiopia/ [Online Resource] Updated 13 December 2023.