 Eswatini
Feedback welcome
Our aim is to use the best data to inform our analysis. See our Technical page for information on the IFs forecasting platform. We appreciate your help and references for improvements via our feedback form.
Please note: This country report was developed using African Futures’ previous analytical framework, which organised the assessment across 11 sectoral scenarios. We have since updated and streamlined the analytical architecture to 8 sectoral scenarios. While the two frameworks remain broadly aligned, the current structure improves consistency, comparability and integration across themes and geographic studies. This page will therefore be updated to the current framework in due course. Read more about our analytical framework on the Technical Page.
In this entry, we first describe the Current Path (CP) forecast for Eswatini as it is expected to unfold to 2043, the end of the third ten-year implementation plan of the African Union’s Agenda 2063 long-term vision for Africa. The Current Path in the International Futures (IFs) forecasting model initialises from country-level data that is drawn from a range of data providers. We prioritise data from national sources.
The Current Path forecast is divided into summaries on demographics, economics, poverty, health/WaSH and climate change/energy. A second section then presents a single positive scenario for potential improvements in stability, demographics, health/WaSH, agriculture, education, manufacturing/transfers, leapfrogging, free trade, financial flows, infrastructure, governance and the impact of various scenarios on carbon emissions. With the individual impact of these sectors and dimensions having been considered, a final section presents the impact of the Combined Agenda 2063 scenario.
We generally review the impact of each scenario and the Combined Agenda 2063 scenario on gross domestic product (GDP) per person and extreme poverty except for Health/WaSH that uses life expectancy and infant mortality.
The information is presented graphically and supported by brief interpretive text.
All US$ numbers are in 2017 values.
Executive Summary
- Current Path forecast
- Eswatini is a member of the Southern African Development Community (SADC), the South African Customs Union (SACU), the Common Market for Eastern and Southern Africa (COMESA), and is one of 23 lower middle-income countries in Africa, according to the World Bank’s income classification. Jump to forecast: Current Path
- In the Current Path forecast, the population is expected to reach 1.6 million people by 2043 — an increase of 405 000 people in the next 24 years. Despite the growing elderly population, the youth dependency is shrinking and Eswatini can enter into its first demographic dividend as early as 2027. Jump to Demographics: Current Path
- Eswatini has high per capita income levels for a lower middle-income country. In the Current Path forecast, GDP per capita of Eswatini is expected to increase to US$15 162 in 2043, US$6 020 and US$8 005 above the projected averages for lower middle-income Africa and Africa, respectively, in the same year. Jump to Economics: Current Path
- In the Current Path forecast, the poverty rate is forecast to decline to 47.1% in 2043 (using the US$3.20 benchmark), equivalent to 750 000 people. The projected poverty rate in 2043 is 8.8 percentage points above the average for lower middle-income Africa in the same year. Jump to Poverty: Current Path
- In 2019, fossil fuels still make up the bulk of the energy production of the country, the result of the high import dependency from South Africa’s fossil fuel-intensive power utility Eskom. The current master energy plan supports the role of independent power providers in energy production and by 2043 it is forecast that renewable energy would make up the largest share of Eswatini’s energy production. Jump to Carbon emissions/Energy: Current Path
- Sectoral scenarios
- A more stable environment will benefit Eswatini greatly and GDP per capita can grow from US$8 440 in 2019 to US$15 729 in 2043, US$567 more than in the Current Path forecast. Jump to Stability scenario
- An infant mortality rate of 14.9 deaths per 1 000 live births is expected in 2043, compared to the 18.7 deaths in the Current Path forecast. This means that the Demographic scenario can reduce the infant mortality rate in Eswatini by an additional 3.8 deaths. Jump to Demographic scenario
- In the Current Path forecast, life expectancy in Eswatini is expected to continue improving, reaching 68.2 years by 2043. The interventions proposed in the Health/WaSH scenario can raise life expectancy by more than a year. The country is however forecast to continue lagging behind its lower middle-income peers. Jump to Health/WaSH scenario
- The Agriculture scenario has an immediate impact on reducing poverty and will reduce the poverty rate by 4.2 percentage points compared to the Current Path forecast in 2043, lifting an additional 70 000 people out of poverty. Jump to Agriculture scenario
- The mean years of education in Eswatini was 6 in 2019, below the average of 7.2 years for lower middle-income Africa and below the 6.2 years for Africa. The Education scenario will increase literacy rates from 92.6% to 100% by 2031. The Education scenario also has the potential to increase mean years of education by 2043 to 8.2 years compared to 7.9 years in the Current Path forecast. Jump to Education scenario
- In 2019, social welfare spending (government welfare transfers to unskilled workers) equated to US$200 million. In the Manufacturing/Transfers scenario, social welfare expenditure will increase to US$1 billion, US$300 million higher than in the Current Path forecast at US$700 million. Jump to Manufacturing/Transfers scenario
- In the Current Path forecast, it is projected that 90.2% of Eswatini’s population will have access to electricity by 2043, translating to 1.4 million people. In the Leapfrogging scenario, total electricity access is projected to reach 99.3% by 2043, while rural electricity access will increase from 62.5% in 2019 to 100% by 2040. For populations living in urban spaces, it is projected that in the Leapfrogging scenario, electricity access will increase from 84.9% in 2019 to 97% by 2043. Jump to Leapfrogging scenario
- By 2043, the poverty rate will drop from 47.1% in the Current Path forecast to 38.5% in the Free Trade scenario, the biggest impact on poverty from the various intervention scenarios. This scenario therefore contributes to an 8.6 percentage point reduction in the poverty rate compared to the Current Path forecast by 2043. Jump to Free Trade scenario
- The Financial Flows scenario has a modest impact on Eswatini’s GDP per capita. By 2043, GDP per capita is expected to increase to US$15 543 in the Financial Flows scenario, compared to US$15 162 in the Current Path forecast, an increase of US$381. The GDP per capita for the country will remain significantly above the average for lower middle-income Africa. Jump to Financial Flows
- The Infrastructure scenario will benefit rural accessibility, and by 2043 it is projected that 91.3% of the rural population will have access to an all-weather road, compared to 87.8% in the Current Path forecast. Jump to Infrastructure scenario
- By 2043, GDP per capita in Eswatini is expected to increase to US$15 511 in the improved Governance scenario, compared to US$15 162 in the Current Path forecast — an increase of US$349. Jump to Governance scenario
- Eswatini’s carbon emissions are projected to increase most in the Free Trade scenario, with an additional 700 000 tons of carbon emissions by 2043 compared to 2019, and a trivial amount more compared to the Current Path forecast for 2043. Jump to Impact of scenarios on carbon emissions
- Combined Agenda 2063 scenario
- Eswatini boasts great economic potential and there are plenty of opportunities to improve the future of the country. Improving intra-Africa trade (as captured in the Free Trade scenario) will raise GDP per capita the most by 2043 with an additional US$1 137 above the Current Path forecast. Improving manufacturing will raise GDP per capita by 2043 with US$861 above the Current Path forecast while leapfrogging could raise income by US$807 in 2043 above the Current Path forecast. Jump to Combined Agenda 2063 scenario
All charts for Eswatini Development Futures
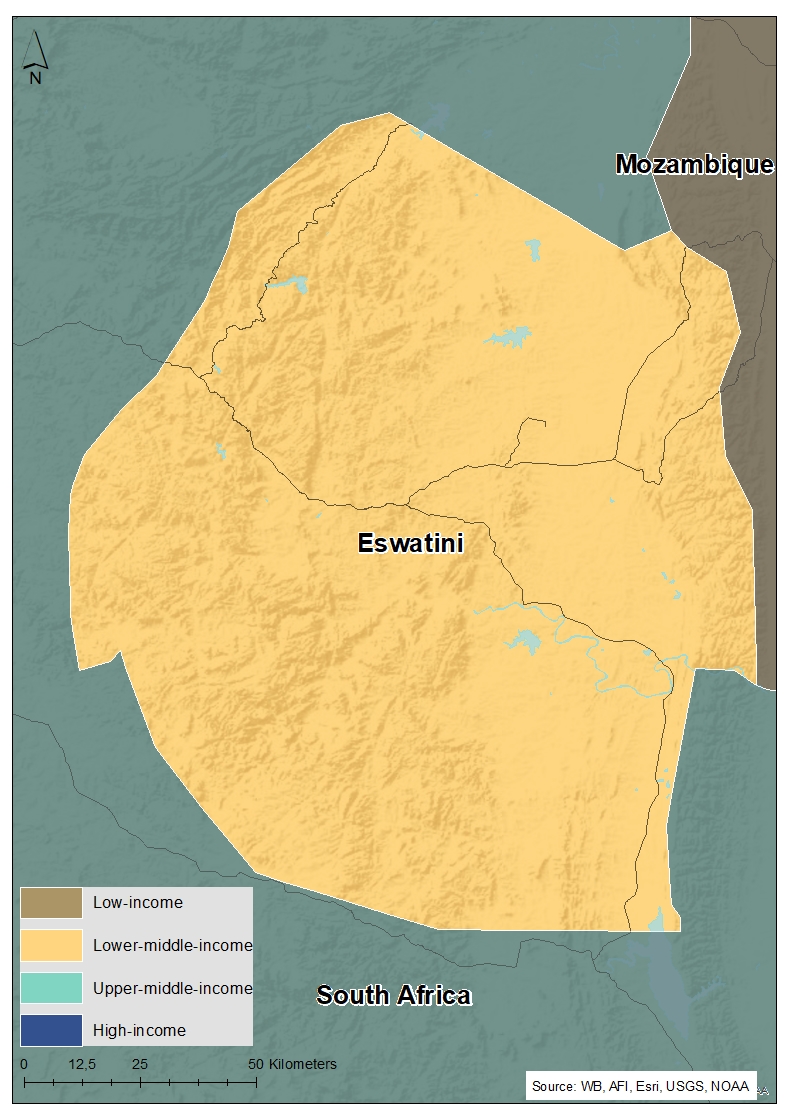
- Chart 1: Political map of Eswatini
- Chart 2: Population structure in CP, 1990–2043
- Chart 3: Urban and rural population in CP, 1990–2043
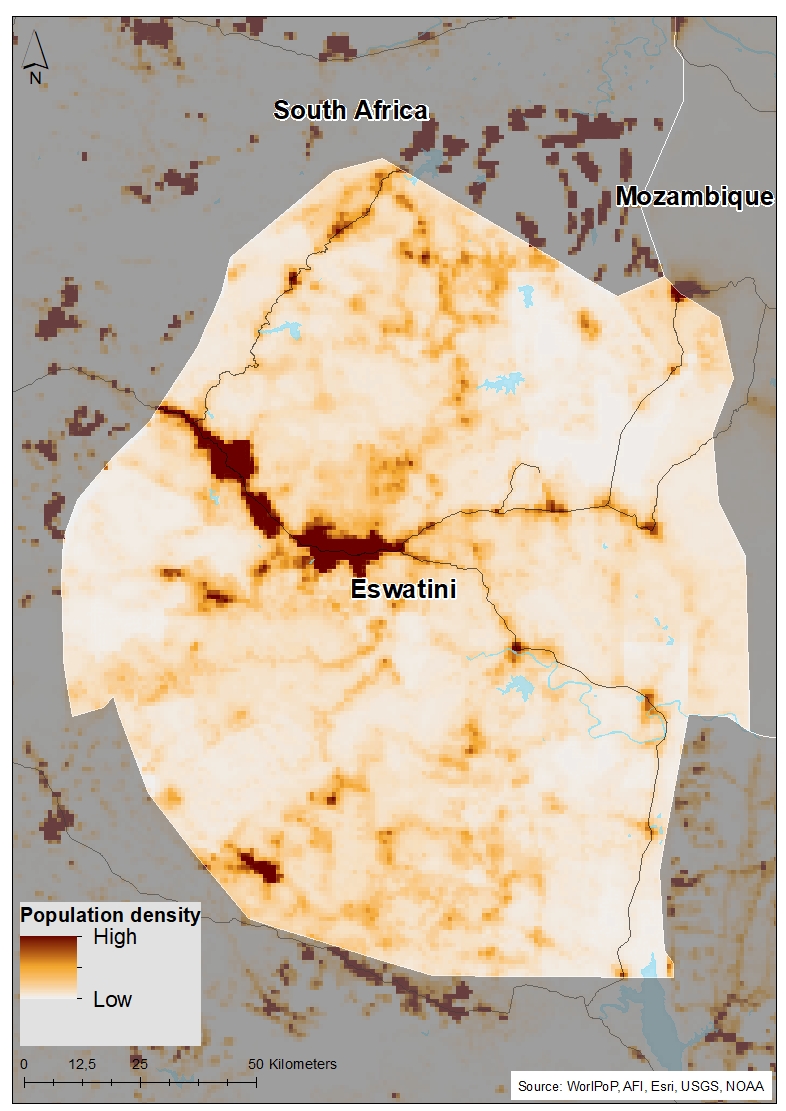
- Chart 4: Population density map for 2019
- Chart 5: GDP in CP, 1990–2043
- Chart 6: GDP per capita in CP, 1990–2043
- Chart 7: Informal sector value in CP, 2015–2043
- Chart 8: Value added by sector in CP, 2015–2043
- Chart 9: Agriculture production/demand in CP, 1990–2043
- Chart 10: Poverty in CP, 2015–2043
- Chart 11: Energy production by type in CP, 1990–2043
- Chart 12: Carbon emissions in CP, 1990–2043
- Chart 13: Governance security in CP and Stability scenario, 2019–2043
- Chart 14: GDP per capita in CP and Stability scenario, 2019–2043
- Chart 15: Poverty in CP and Stability scenario, 2019–2043
- Chart 16: Demographic dividend in CP and Demog scenario, 2019–2043
- Chart 17: Infant mortality in CP and Demog scenario, 2019–2043
- Chart 18: GDP per capita in CP and Demog scenario, 2019–2043
- Chart 19: Poverty in CP and Demog scenario, 2019–2043
- Chart 20: Life expectancy in CP and Health/WaSH scenario, 2019–2043
- Chart 21: Infant mortality in CP and Health/WaSH scenario, 2019–2043
- Chart 22: Yield/hectare in CP and Agric scenario, 2019–2043
- Chart 23: Agriculture imports in CP and Agric scenario, 2019–2043
- Chart 24: GDP per capita in the CP and Agric scenario, 2019–2043
- Chart 25: Poverty in CP and Agric scenario, 2019–2043
- Chart 26: Mean years of education in CP and Educ scenario, 2019–2043
- Chart 27: Education quality in CP and Educ scenario, 2019–2043
- Chart 28: GDP per capita in CP and Educ scenario, 2019–2043
- Chart 29: Poverty in CP and Educ scenario, 2019–2043
- Chart 30: Value added by sector in CP and Manufac/Transfers scenario, 2019–2043
- Chart 31: Gov welfare transfers in CP and Manufac/Transfers scenario, 2019–2043
- Chart 32: GDP per capita in CP and Manufac/Transfers scenario, 2019–2043
- Chart 33: Poverty in CP and Manufac/Transfers scenario, 2019–2043
- Chart 34: Fixed broadband access in CP and Leapfrogging scenario, 2019–2043
- Chart 35: Mobile broadband access in CP and Leapfrogging scenario, 2019–2043
- Chart 36: Electricity access in CP and Leapfrogging scenario, 2019–2043
- Chart 37: GDP per capita in CP and Leapfrogging scenario, 2019–2043
- Chart 38: Poverty in CP and Leapfrogging scenario, 2019–2043
- Chart 39: Trade balance in CP and Free Trade scenario, 2019–2043
- Chart 40: GDP per capita in CP and Free Trade scenario, 2019–2043
- Chart 41: Poverty in CP and Free Trade scenario, 2019–2043
- Chart 42: Foreign aid in CP and Financial Flows scenario, 2019–2043
- Chart 43: Inflow of FDI in CP and Financial Flows scenario, 2019–2043
- Chart 44: Remittances in CP and Financial Flows scenario, 2019–2043
- Chart 45: GDP per capita in CP and Financial Flows scenario, 2019–2043
- Chart 46: Poverty in CP and Financial Flows scenario, 2019–2043
- Chart 47: Electricity access in CP and Infrastructure scenario, 2019–2043
- Chart 48: Rural road access in CP and Infrastructure scenario, 2019–2043
- Chart 49: GDP per capita in CP and Infrastructure scenario, 2019–2043
- Chart 50: Poverty in CP and Infrastructure scenario, 2019–2043
- Chart 51: Gov effectiveness in CP and Governance scenario, 2019–2043
- Chart 52: GDP per capita in CP and Governance scenario, 2019–2043
- Chart 53: Poverty in CP and Governance scenario, 2019–2043
- Chart 54: Carbon emissions in CP and scenarios, 2019–2043
- Chart 55: GDP per capita in CP and scenarios, 2019–2043
- Chart 56: GDP per capita in CP and Combined scenario, 2019–2043
- Chart 57: Poverty in CP and Combined scenario, 2019–2043
- Chart 58: Value added by sector in CP and Combined scenario, 2019–2043
- Chart 59: GDP in CP and Combined scenario, 2019–2043
- Chart 60: Carbon emissions in CP and Combined scenario, 2019–2043


Eswatini Development Futures: Current Path
Download to pdfThis page provides an overview of the key characteristics of Eswatini along its likely (or Current Path) development trajectory. The Current Path forecast from the International Futures forecasting (IFs) platform is a dynamic scenario that imitates the continuation of current policies and environmental conditions. The Current Path is therefore in congruence with historical patterns and produces a series of dynamic forecasts endogenised in relationships across crucial global systems. We use 2019 as a standard reference year and the forecasts generally extend to 2043 to coincide with the end of the third ten-year implementation plan of the African Union’s Agenda 2063 long-term development vision.
The Kingdom of Eswatini, formerly named Swaziland, is a landlocked country surrounded by upper middle-income South Africa and low-income Mozambique. Eswatini is a member of the Southern African Development Community (SADC), the South African Customs Union (SACU), the Common Market for Eastern and Southern Africa (COMESA), and is one of 23 lower middle-income countries in Africa, according to the World Bank’s income classification. The country has strong economic ties to its upper middle-income neighbour South Africa.
As a former British protectorate, the country gained independence from the United Kingdom in 1968. While the newfound constitution made provision for a constitutional monarchy, the dismantlement thereof into an absolute monarchy transpired in the decades that followed independence. Eswatini is considered an absolute monarchy with King Mswati III, who has been reigning since 1986, holding executive power. Internal discontent on how the country is governed has recently escalated especially among disgruntled youth and pro-democracy movements. Protests escalated into full-scale riots in 2021 that revealed the underlying, growing tension within the country.
The country is the seventh smallest in Africa and its geographical position on the Southern Africa eastern escarpment contributes to a wide variety of landscapes with rich biodiversity. Four distinct regions are observed ranging in altitudes from 1 800 m to 21 m above sea level. The country has ample natural resources and its economy is fairly well diversified. It boasts varied geology with large coal reserves that occupy one sixth of the country’s area, numerous iron ore deposits, gold and additional mineral resources such as talc, barite, kaolin, silica and diamonds. The country is, however, very susceptible to severe drought and its high reliance on subsistence farming subjects the population to food insecurity.
Eswatini remains the epicentre of the global HIV/AIDS pandemic with the highest HIV prevalence rates globally. Eswatini’s development prospects are unpacked in more detail in the subsequent charts and sections.
Eswatini’s population of 1.2 million in 2019 gives it the position as the sixth smallest nation in Africa in population size and the seventh smallest in geographical area. Total fertility rates have dropped significantly in the past four decades, down from 6.7 births per woman in 1980 to 2.9 in 2019, below the 4.3 average of lower middle-income Africa. Low fertility rates and a high prevalence of HIV/AIDS in the late 1990s and early 2000s resulted in a significant drop in population growth rates with population growth of less than 1% recorded in 2005. In response to this burden, the country developed the National Strategic Plan for HIV/AIDS in 2000 but the enormous burden of the pandemic continues to impact on the demography and health of the country. In 2019, Eswatini’s growth rates were 1 percentage point below the average for its income peers.
In the Current Path forecast, the population is expected to reach 1.6 million people by 2043 — an increase of 405 000 people in the next 24 years. The drop in fertility rates and increased life expectancy will alter the age structure of the country with the median age expected to increase from 20.6 years in 2019 to 28.1 years by 2043. This figure was on par with the average of lower middle-income Africa that had a median population age of 20.8 years in 2019, but it is significantly above 24.7 projected for the income peers by 2043.
Eswatini’s demographic composition is changing. The share of the population aged below 15 declined from 49% in 1990 to 37% in 2019 and is expected to continue declining to 26% by 2043. The working-age population (age 15–65) increased from 48% in 1990 to 59% in 2019, and is expected to be just shy of 70% by 2043. The country has a small elderly population, with fewer than 46 000 people 65 years and older in 2019. This figure will grow, reaching 83 000 by 2043 — the result of a longer life expectancy, climbing by 9.2 years from 2019 to 2043. Despite the growing elderly dependency, the youth dependency is shrinking and Eswatini can enter into its first demographic dividend as early as 2027.
Eswatini lacks a formalised land ownership structure but does provide perceived security of tenure with access to landholdings through traditional land governance. Eswatini is a predominantly rural country, with 76.8% of its population in 2019 living in rural agglomerations/clusters throughout the countryside, making it the eighth most rural state in lower middle-income Africa. Rural traditional family clusters throughout Eswatini host 903 000 dwellers. Between 1990 and 2019, urbanisation rates increased only marginally from 20.2% to 23.2%, indicative of an urbanisation stagnation.
Eswatini is expected to remain predominantly rural throughout the forecast horizon, and by 2043 it is forecast that 76.1% of the population will still be living in rural spaces throughout the country. This is in contrast to the average urbanisation rate of lower middle-income Africa that is expected to be 59% compared to 23.9% for Eswatini in 2043. The high rural rates result in an uncontrolled process of development and lack of basic services, creating additional environmental issues such as degradation and pollution.
Much of Eswatini’s population is distributed along the MR3 corridor that connects the country’s administrative capital Mbabane to the industrial hub and second biggest town of Manzini. This east to west corridor has seen much development the past couple of decades and continued infrastructure development will likely further attract people towards this corridor.
Eswatini has a small land area with a geographical size of 17 364 km2. Its population density of 0.7 people per hectare in 2019 is above the 0.6 average for Africa’s lower middle-income countries and above the 0.5 average for Africa. The country boasts four distinct agro-ecological zones with topography varying from mountainous to flat. In the Current Path forecast, the population density is expected to increase to 0.9 people per hectare, falling below the average for lower middle-income Africa that is projected to be 1 person per hectare by 2043. With a slower urbanisation rate than its lower middle-income peers, much of the expected densification will be within rural clusters.
Eswatini enjoyed sustained economic growth in the first decade of the century, growing from US$3.6 billion in 2000 to US$5.1 billion by 2010 — an annual average of 4.2% growth. This was still on the back of heavy investment in Eswatini in the 1980s and 1990s that attracted sizable foreign investment and boasted a vibrant private sector. Economic growth rates in 2005 and 2006 neared 6%. However, the past decade has seen a slowing down of growth, mainly due to the country’s overreliance on volatile SACU revenues, the negative effect of the COVID-19 pandemic on trade, increasing debt, growing income inequality and a persistently high disease burden. The poor economic performance over the past decade saw the economy only grow by US$1.1 billion to US$6.2 billion in 2020 — 2.7% annual growth.
Eswatini’s currency is linked to the South African rand; its economy is also closely tied to South Africa’s and the country is reliant on its neighbour for imports and exports. The country has a rich mineral base and the economy is fairly well diversified. While the service sector contributes the most to the country’s GDP, industry inclusive of construction and agriculture also plays a very important role. The country’s rich biodiversity and cultural history attracts tourists, while agriculture is the main source of income for the vast majority of the country’s rural households. On the Current Path, the economy of Eswatini is forecast to grow from US$6.4 billion in 2019 to US$19 billion by 2043 — a sizable increase of US$12.7 billion, or 67%, within the next 24 years. Unlocking this potential would however demand a more favourable investment climate.
Although many of the charts in the sectoral scenarios also include GDP per capita, this overview is an essential point of departure for interpreting the general economic outlook of Eswatini.
Eswatini has high per capita income levels for a lower middle-income country. Even though the country has the sixth smallest economy among the group, its small population size contributes to the fourth highest GDP per capita among its peers. The per capita income of US$8 441 in 2019 for Eswatini was above the average of US$6 989 for lower middle-income Africa and above the average of US$5 289 for Africa. The income is however not evenly distributed and the country had the tenth highest income inequality in the world in 2019. The majority of the rural population still lives in extreme poverty while a small number of elites earn the vast majority of the country’s income.
The gap between Eswatini’s income per capita and that of the average for lower middle-income Africa has stayed relatively consistent the past couple of decades. In 1990 Eswatini’s income per capita was US$1 439 above the average for its income peers on the continent; in 2019 the gap remained at US$1 432. In the Current Path forecast, GDP per capita for Eswatini is expected to increase to US$15 162 in 2043, US$6 020 and US$8 005 above the projected averages for lower middle-income Africa and Africa, respectively, in the same year.
The informal economy comprises activities that have market value and would add to tax revenue and GDP if they were recorded. Countries with high informality have a host of development challenges such as higher poverty, lower per capita incomes, greater income inequality, and weaker productivity investment, among others. They also struggle with a lack of social safety nets and unregulated work environments. In Eswatini the informal economy is a vital mechanism for income earning and supporting a livelihood and the cornerstone of many small and medium sized enterprises. Although the sector provides a means of survival for those employed at these enterprises, increased formalisation holds various benefits, including increased government revenue through taxation, higher productivity per capita and increased security for the workforce.
Eswatini has a large informal sector, albeit smaller than the average for its lower middle-income peers. In 2019, the size of the informal economy was estimated at 27.8% of GDP, amounting to a value of US$1.6 billion. This is 1.4 percentage points below the average of lower middle-income Africa and 1.9 percentage points higher than the average of Africa. The informal economy is an important employer in Eswatini, and in 2019, 45% of Eswatini’s labour force worked in the informal sector.
On the current development trajectory, the size of the informal sector is forecast to modestly decline to 21.1% of GDP by 2043. This will amount to an informal economy with a value of US$3.7 billion by 2043 — a much faster rate of reduction compared to Africa and lower middle-income Africa.
The IFs platform uses data from the Global Trade and Analysis Project (GTAP) to classify economic activity into six sectors: agriculture, energy, materials (including mining), manufacturing, services and information and communication technologies (ICT). Most other sources use a threefold distinction between only agriculture, industry and services with the result that data may differ.
Eswatini’s economic structure has changed significantly from the 1970s to date. In 1970, agriculture made up a significant portion of the economy contributing as much as 30% to the total GDP. Manufacturing contributed an already steady 11.5% of GDP, while the service sector contributed nearly 35% to the economy. Today the economy is fairly well diversified. While agriculture has subsided in regard to its economic contribution, the manufacturing sector has grown significantly, signalling a shift away from the primary economy.
In 2019, the agriculture sector contributed nearly 9% of GDP (valued at US$600 million), while the manufacturing sector had grown to 35% (valued at US$2.3 billion) and the service sector stood strong at 45.8% (valued at US$2.9 billion). In the Current Path forecast, the contribution of the service sector is expected to still stand at 45.6% (valued at US$8.7 billion) throughout the forecast horizon. The manufacturing sector is expected to continue growing steadily and is likely to contribute 42% (US$8 billion) while agriculture will continue to decrease contributing only 2.9% (US$500 million) by 2043.
The data on agricultural production and demand in the IFs forecasting platform initialises from data provided on food balances by the Food and Agriculture Organization (FAO). IFs contains data on numerous types of agriculture but aggregates its forecast into crops, meat and fish, presented in million metric tons. Chart 9 shows agricultural production and demand as a total of all three categories.
The large rural population in Eswatini engages in subsistence farming and an estimated 70% are dependent on this sector for supporting their livelihoods. Food security remains a consistent challenge for the country and droughts, natural disasters, unsustainable farming techniques and variable rainfall patterns threaten the sector. The government has substantially invested in irrigation projects to guard against droughts through numerous small-scale dams, but soil erosion, overgrazing and low productivity in this sector still threaten food security. Most local farmers are small-scale subsistence farmers cultivating rain-fed maize, while commercial farming is dominated by sugar cane, cotton, citrus and livestock. The agriculture sector is highly susceptible to drought and variability in rainfall, which, together with a lack of water provision and reticulation, remain obstacles for development of the sector.
In 2019, the country produced 7.5 million tons of agricultural produce, many through commercial farms earmarked for export. The sector remains vital to the country and sugar cane continues to be a key part of this sector's outputs. Maize production has ramped up in the past two decades but is highly susceptible to drought. Much of the 7.7 million metric tons of agricultural demand in 2019 could not be met with current internal production and the country does not produce enough food to feed itself. Food assistance has been brought into the country on previous occasions to stave off nutritional and food insecurity and much of the demand for agricultural products are met through imports from South Africa. Top imported commodities include wheat, maize, rice, fruits and vegetables.
Land release, especially from the government, can open up more arable land for cultivation. In the Current Path forecast, the country will continue to produce around 7.7 million metric tons by 2043 and while much of this would be earmarked for export, the growing demand for basic foodstuff will be increasingly unmet through local production. By 2043 demand for agricultural produce will be 11.2 million metric tons. While the country has a strong import market from South Africa, fluctuations in food prices and regional droughts threaten food security and makes the country susceptible to food price shocks.
There are numerous methodologies for and approaches to defining poverty. We measure income poverty and use GDP per capita as a proxy. In 2015, the World Bank adopted the measure of US$1.90 per person per day (in 2011 international prices), also used to measure progress towards the achievement of Sustainable Development Goal (SDG) 1 of eradicating extreme poverty. To account for extreme poverty in richer countries occurring at slightly higher levels of income than in poor countries, the World Bank introduced three additional poverty lines in 2017:
- US$3.20 for lower middle-income countries
- US$5.50 for upper middle-income countries
- US$22.70 for high-income countries.
The country has made steady progress in raising GDP per capita, but unemployment remains high, especially among the youth, causing discontent and tension within this group. Furthermore, poverty remains an endemic problem that burdens communities, especially those situated in rural areas. The growth of the manufacturing sector in Eswatini, together with the introduction of grants to support vulnerable households, has however significantly reduced poverty over the past four decades.
The past decade has seen slow progress. Poverty rates had fallen to 60% (710 000 people) in 2019 using the US$3.20 benchmark and although a reasonable feat, this is still 10 percentage points above the average for lower middle-income Africa. Inequality is also high and apart from income poverty, the population suffers from a lack of access to basic social services. In 2017, it was estimated that nearly 57% of children were deprived in four or more dimensions of well-being.
Eswatini’s export markets were affected by the COVID-19 pandemic and this negatively affected the country’s fight against poverty, although the country is forecast to recover in the short term. In the Current Path forecast, the extreme poverty rate is forecast to decline to 47.1% in 2043 (using the US$3.20 benchmark), equivalent to 750 000 people. The projected extreme poverty rate in 2043 is 8.8 percentage points above the average for lower middle-income Africa in the same year.
The IFs platform forecasts six types of energy, namely oil, gas, coal, hydro, nuclear and other renewables. To allow comparisons between different types of energy, the data is converted into billion barrels of oil equivalent (BBOE). The energy contained in a barrel of oil is approximately 5.8 million British thermal units (MBTUs) or 1 700 kilowatt-hours (kWh) of energy.
Eswatini’s state-owned power utility EEC operates four hydropower plants that provide an estimated 17% of the total energy consumed in the country. Eswatini currently has independent power producers (IPPs) that run hydro, biomass and solar PV technologies but the country has potential for bringing onboard more IPPs. The country is heavily reliant on imports from South Africa to meet the rest of its energy demands, while energy is occasionally imported from Mozambique too.
In 2019, fossil fuels still made up the bulk of the energy production in the country, the result of the high import dependency from South Africa’s fossil fuel intensive energy utility Eskom. The current master energy plan further supports the role of IPPs in energy production and increased energy self-sufficiency, and by 2043 it is forecast that renewables will make up the largest share of energy production in the country. For economic growth to take off, the country needs to urgently address the supply gap as well as the rural electricity access rate.
Carbon is released in many ways, but the three most important contributors to greenhouse gases are carbon dioxide (CO2), carbon monoxide (CO) and methane (CH4). Since each has a different molecular weight, IFs uses carbon. Many other sites and calculations use CO2 equivalent.
Eswatini is a low carbon emitter, with 100 000 tons of carbon emissions in 2019. Its carbon emissions are dwarfed by South Africa, yet Eswatini is still reliant on its neighbour’s energy exports to meet its own needs. In 2019, Eswatini’s emissions placed it in 44th position in Africa and 157th in the world, and among lower middle-income countries in Africa it ranked fifth lowest. In the Current Path forecast, carbon emissions are likely to increase to 1.1 million tons by 2043. The country has great renewable energy potential and its energy plans cater to that.
Sectoral Scenarios for Eswatini Development Futures
Download to pdfThe Stability scenario represents reasonable but ambitious reductions in the risk of regime instability and lower levels of internal conflict. Stability is generally a prerequisite for other aspects of development and this would encourage inflows of foreign direct investment (FDI) and improve business confidence. Better governance through the accountability that follows substantive democracy is modelled separately.
The intervention is explained here in the thematic part of the website.
Eswatini is an absolute monarchy with a strong patriarchal society. The country has roughly 300 chiefs who answer to the king and are responsible for allocating Swazi Nation Land and settling disputes. The country does not enjoy political freedom and suffers from a democracy deficit. Calls for reform and pro-democracy demonstrations turned into civil unrest, protests and riots in June 2021. The 2021 riots were mobilised by the disgruntled youth’s growing discontent with rising unemployment and worsening socio-economic conditions. Citizens demanded democratisation, civil liberties and greater participation in economic and political affairs of the country. Tension remains high, and discontent with the ruling elite and their opulence is growing.
IFs’ governance security index ranges from 0 (low security) to 1 (high security). In 2019, Eswatini's score on the governance security index was 0.65, lower than the average of 0.72 for lower middle-income Africa and slightly lower than the average of 0.69 for Africa. Eswatini does not enjoy civil and political freedom and in 2019 scored 3.2 percentage points below its income peers on the continent on the Freedom House index. Eswatini stands to gain substantially from the interventions proposed in the Stability scenario. In this scenario, the score for the country on the governance security index is 12% higher by 2043, compared to the Current Path forecast.
Stability stimulates economic growth as it attracts foreign investment and creates an enabling environment for businesses to thrive. The underlying tension and discontent especially among the youth that fuelled the riots and unrest in 2021 would have to be addressed to create a more stable environment conducive to attracting foreign investors. A more stable environment will however benefit Eswatini greatly and GDP per capita can grow from US$8 440 in 2019 to US$15 729 in 2043 — US$567 more than in the Current Path forecast for the same year. In both the Current Path forecast and the Stability scenario, GDP per capita remains significantly above the average for lower middle-income African countries throughout the forecast horizon to 2043.
Improving stability within the country and avoiding the same tension flare-ups as observed in June 2021 can go a long way in raising investor confidence and lowering the perception of risks within the country. The endemic nature of poverty however still dominates the poverty picture. The Stability scenario therefore has a positive although small impact on poverty rate reduction and will only benefit the country from 2029 onwards.
Poverty rates in this scenario are likely to reach 45.1% by 2043, 2 percentage points lower compared to the Current Path forecast. Poverty rates will also remain above the average for lower middle-income Africa. In this scenario, 710 000 instead of 750 000 Eswatini will still be subjected to poverty by 2043, indicating that improved stability can lift an additional 40 000 people out of poverty.
This section presents the impact of a Demographic scenario that aims to hasten and increase the demographic dividend through reasonable but ambitious reductions in the communicable-disease burden for children under five, the maternal mortality ratio and increased access to modern contraception.
The intervention is explained here in the thematic part of the website.
Demographers typically differentiate between a first, second and even a third demographic dividend. We focus here on the contribution of the size of the labour force (between 15 and 64 years of age) relative to dependants (children and the elderly) as part of the first dividend. A window of opportunity opens when the ratio of the working-age population to dependants is equal to or surpasses 1.7.
In 2019, Eswatini had a 1.4 ratio of working-age persons to dependants. This ratio, albeit shy of a demographic dividend, was above the ratio for lower middle-income Africa at 1.3. Eswatini’s demographic dividend will materialise sooner than its income peers on the continent and it will likely start reaping the benefits of a larger workforce by as early as 2027. This demographic transition within the country will open up opportunities for economic prosperity. In the Demographic scenario, it is forecast that the ratio of working-age people to dependants will increase much quicker than in the Current Path forecast as more people enter the working-age group.
While the country's large, young workforce is an advantage, employment opportunities would have to be created to engage them. Absence of employment opportunities, similar to what is currently observed, will add to the youth’s discontent and create further tension between them and the government. It is therefore prudent that the country provides a sound macroeconomic environment with progressive social policies.
The infant mortality rate is the number of infant deaths per 1 000 live births and is an important marker of the overall quality of the health system in a country.
Infant mortality in lower middle-income Africa has substantially and consistently dropped over the past couple of decades and is less than half the figures recorded in the 1980s. Eswatini’s infant mortality rates initially declined faster compared to its income peers. In the 1960s, infant mortality in Eswatini was higher than the average for lower middle-income Africa, but in 1990 the rates had substantially dropped below its income peers, more than 30 deaths per 1 000 live births. However, the 1990s and the first decade of this century marked a deterioration in the development indicator. Infant mortality started climbing again, mainly due to rampant HIV/AIDS infections within the country, so much so that by 2010 infant mortality rates were nearly 10 deaths per 1 000 live births higher compared to lower middle-income Africa.
Dramatic action by the government and various health organisations ensured that mothers and infants received the necessary medication. By 2019 infant mortality rates stood at 36.5 deaths per 1 000 live births dropping below the 46.4 average for lower middle-income Africa.
Many of the most severe challenges have received attention and Eswatini’s downward trend is expected to accelerate in the Demographic scenario reaching an infant mortality rate of 14.9 deaths per 1 000 live births in 2043, compared to 18.7 in the Current Path forecast. This means that the Demographic scenario can reduce the infant mortality rate in Eswatini by an additional 3.8 deaths.
In the Demographic scenario, GDP per capita will grow from US$8 441 in 2019 to US$15 500 in 2043 — US$338 more than in the Current Path forecast for the same year. In both the Current Path forecast and the Demographic scenario, GDP per capita remains significantly above the average for lower middle-income African countries throughout the forecast horizon to 2043.
The interventions proposed in the Demographic scenario have a modest impact on poverty reduction in Eswatini. The poverty rate in this scenario is likely to reach 45.1% by 2043, 2 percentage points lower than in the Current Path forecast. The scenario would therefore lift an additional 60 000 people out of poverty. The poverty rate will remain significantly above the average for lower middle-income Africa.
This section presents reasonable but ambitious improvements in the Health/WaSH scenario, which include reductions in the mortality rate associated with both communicable diseases (e.g. AIDS, diarrhoea, malaria and respiratory infections) and non-communicable diseases (NCDs) (e.g. diabetes), as well as improvements in access to safe water and better sanitation. The acronym WaSH stands for water, sanitation and hygiene.
The intervention is explained here in the thematic part of the website.
Life expectancy in Eswatini drastically improved between 1960 and 1990. In 1960, the average Swazi could expect to reach an age of 44 years. By 1990, life expectancy had climbed to 62 years. However, the onset of the HIV/AIDS pandemic affected the country severely. Several policies and actions were taken to curb the spread and attend to the high mortality among mothers and children. To date the country still bears the effects of the HIV/AIDS pandemic and has the misfortune of bearing the world’s highest prevalence of HIV/AIDS infection. In 2019 life expectancy recovered to 59 years, 8.5 years below the average for lower middle-income Africa and the fifth lowest in Africa.
In the Current Path forecast, life expectancy in Eswatini is expected to continue improving, reaching 68.2 years by 2043. Swazi households, however, continue to suffer from the aftermath and ongoing effects of the pandemic. The interventions proposed in the Health/WaSH scenario can raise life expectancy by more than a year. The country is however forecast to continue lagging behind its lower middle-income peers.
The Agriculture scenario represents reasonable but ambitious increases in yields per hectare (reflecting better management and seed and fertiliser technology), increased land under irrigation and reduced loss and waste. Where appropriate, it includes an increase in calorie consumption, reflecting the prioritisation of food self-sufficiency above food exports as a desirable policy objective.
The intervention is explained here in the thematic part of the website. The data on yield per hectare (in metric tons) is for crops but does not distinguish between different categories of crops.
Eswatini’s yield per hectare ranked second in Africa in 2019 at 43.8 tons per hectare. While this might seem exorbitant given its neighbours and current issues within the sector (see Chart 9), it should be seen in the light of its main export commodity being sugar cane. Its commercial sugar cane farms can deliver yields of over 60 tons per hectare. Sugar cane produces over half of total annual agricultural production output. Maize hovers in the vicinity of 2 tons per hectare and is severely affected by rainfall variability. In 2015, a higher yielding maize was introduced to the country that is more drought tolerant with potential yields of ten metric tons per hectare. This will support Eswatini in moving to food self-sufficiency especially among its rural subsistence farmers.
In the Current Path forecast, the country will remain profitable in its commercial farming activities aimed at exporting, but subsistence farming practices will not keep up with the growing demand and will be highly susceptible to rainfall variability brought about by climate change. Yields will also be unchanged throughout its forecast horizon. In the Agriculture scenario, the introduction of newer technologies and the continued roll-out of irrigation schemes (to protect against rainfall variability) will boost yields per hectare by nearly 6 tons by 2043, compared to the Current Path forecast.
Eswatini’s large rural population, which depends on subsistence farming, remains vulnerable to food insecurity especially in periods of regional drought. The country imports basic foodstuff and is not self-reliant. However, the country has a strong agricultural export market with sugar cane leading export incomes. Total agricultural production exceeded demand, with surplus exports equivalent to 2.6% of total demand. In the Current Path forecast, demand is forecast to far exceed production by 2043, resulting in a significant import dependency of 31.8% of total demand.
The Agriculture scenario will benefit Eswatini by increasing land access to irrigation and improving yields through new technologies and higher yielding seeds. In this scenario, Eswatini can lower its import dependency to 23.6% by 2043. Lowering import dependence will be beneficial to the country as it will release funds for other productive investments in the economy. It would also improve the country's current account balance and make it less vulnerable to international food price shocks.
By 2043, the Agriculture scenario will have a modest impact on GDP per capita, increasing income by only US$65 over the Current Path forecast. This will result in a GDP per capita of US$15 227 in 2043. Although the scenario benefits lower middle-income Africa much more compared to Eswatini, the country’s GDP per capita will remain significantly above the average for lower middle-income countries in Africa throughout the forecast horizon.
Eswatini’s agriculture sector is underperforming and can benefit substantially from interventions in the Agriculture scenario. The large percentage of subsistence farmers that struggle with endemic poverty can benefit from a more productive sector that boasts higher yields. The Agriculture scenario will therefore have a positive impact on poverty reduction in the country. The scenario has an immediate impact on reducing poverty and will reduce poverty by 4.2 percentage points compared to the Current Path forecast by 2043, lifting an additional 70 000 people out of poverty.
Boosting the agriculture sector’s efficiency is vital to improving livelihoods and to transforming the face of poverty, especially in rural areas. More investment in the sector, particularly in small-scale farming, will increase consumption and income levels and even pave the way for these actors to partake in agro-industrial activities.
The Education scenario represents reasonable but ambitious improved intake, transition and graduation rates from primary to tertiary levels and better quality of education. It also models substantive progress towards gender parity at all levels, additional vocational training at secondary school level and increases in the share of science and engineering graduates.
The intervention is explained here in the thematic part of the website.
Eswatini spends a significant share of its GDP on education, the fourth highest in Africa. In 2019, Eswatini spent 6.8% of its GDP on education, 0.3 percentage points above the average for lower middle-income Africa. However, the education sector suffers from high repetition rates among primary learners, low primary completion rates and high drop-out rates. High poverty levels and the unaffordability of school fees, pregnancy and high secondary education costs are among the reasons stated for this low figure.
The mean years of education in Eswatini was 6 years in 2019, below the average of 7.2 years for lower middle-income Africa and below the 6.2 years for Africa. Increased investment in education as proposed in the Education scenario will increase literacy rates from 92.6% to 100% by 2031. The Education scenario will also increase mean years of education to 8.2 years by 2043, compared to 7.9 in the Current Path forecast.
Education is a key lever for growth and development and given the country’s large youth bulge and its potential for entering a period of demographic dividend, investment in the sector remains crucial for prosperity.
The quality of education at primary level in Eswatini is higher than its income peers on the continent. In 2019, the primary average test score (an indication of quality education) was 35, slightly above the 24.8 average for lower middle-income Africa. The interventions proposed in the Education scenario can lift the primary test score to 45.7, 6.5 percentage points above the Current Path forecast by 2043.
The test score for Eswatini in 2019 at secondary level was 38.8, which is below the average for lower middle-income Africa at 41.7. The Education scenario is expected to result in test scores for secondary learners of 53.5 by 2043. This is 8.8 percentage points higher compared to the Current Path forecast at 44.7.
Quality education is crucial for economic development. It not only allows the country to increase its current added value but also creates tomorrow's technological innovations. Thus, Eswatini’s authorities should accelerate reforms to improve the quality of education in the country and as well as keep learners enrolled.
Eswatini has a low Human Development Index score, ranking 138 out of 186 countries globally. Education can improve the human capital of a country, which ultimately leads to economic growth in the long term. By 2043, GDP per capita in Eswatini is expected to increase to US$15 772 in the Education scenario, compared to US$15 162 in the Current Path forecast. It means that the Education scenario can improve average GDP per capita in Eswatini by an additional US$610. The GDP per capita for Eswatini is expected to continue to excel above its income peers throughout the forecast horizon, with this scenario making a greater impact in Eswatini compared to its income peers.
In the Education scenario, it is expected that the poverty rate in Eswatini will decrease to 44.9% by 2043, down from 60% in 2019. This is a 2.2 percentage point improvement to the Current Path forecast that is expected to be 47.1% by 2043. Poverty rates in both the Current Path forecast and the Education scenario will remain above the average for lower middle-income African countries. The Education scenario can lift an additional 40 000 people out of extreme poverty by 2043 compared to the Current Path forecast. Although education is a powerful tool for poverty reduction, as it equips individuals to obtain livelihoods, its benefits take long to manifest.
The Manufacturing/Transfers scenario represents reasonable but ambitious manufacturing growth through greater investment in the economy, investments in research and development, and promotion of the export of manufactured goods. It is accompanied by an increase in welfare transfers (social grants) to moderate the initial increases in inequality that are typically associated with a manufacturing transition. To this end, the scenario improves tax administration and increases government revenues.
The intervention is explained here in the thematic part of the website.
Chart 30 should be read with Chart 8 that presents a stacked area graph on the contribution to GDP and size, in billion US$, of the Current Path economy for each of the sectors.
In the Manufacturing/Transfers scenario, the service sector will continue to be the largest contributor to the economy, contributing an additional US$900 million to GDP by 2043, which as a percentage of GDP is a 1 percentage point increase compared to the Current Path forecast.
The scenario will improve the contribution of the ICT sector too, which will contribute an additional US$100 million (0.2 percentage improvement) to GDP by 2043 compared to the Current Path forecast. As a percentage of GDP, the contribution of the energy, materials, agriculture and manufacturing sectors to GDP in the scenario is lower than in the Current Path forecast by 2043. However, in absolute terms, the contribution of the manufacturing sector to GDP is US$400 million larger than in the Current Path forecast by 2043.
In 2019, social welfare spending (government welfare transfers to unskilled workers) equated to US$200 million. In the Manufacturing/Transfers scenario, social welfare expenditure will increase to US$1 billion, US$300 million higher than in the Current Path forecast at US$700 million.
Although a manufacturing transition increases inequality in the short term, increased manufacturing activity stimulates inclusive growth with greater impact on poverty alleviation in the long term. Eswatini already has an established manufacturing sector and additional value chains (especially from the mining sector) can boost economic growth.
Eswatini already boasts a strong manufacturing sector but the interventions proposed in the Manufacturing/Transfers scenario will still improve GDP per capita of the country significantly. By 2043, this scenario can increase income by as much as US$864 above the Current Path forecast. The GDP per capita is expected to increase to US$16 023 in this scenario compared to US$15 162 in the Current Path forecast. The GDP per capita in both the Current Path forecast and the Manufacturing/Transfers scenario will still be significantly above the average for lower middle-income countries in Africa by 2043.
The Manufacturing/Transfers scenario will have a significant impact on poverty reduction in the country by 2043. The benefits of this scenario already start to impact poverty reduction by as early as 2025. In this scenario, the poverty rate is reduced to 43.2% by 2043, a 3.9 percentage point reduction compared to the Current Path forecast. An additional 70 000 people will be lifted out of poverty in the Manufacturing/Transfers scenario compared to the Current Path forecast by 2043.
The Leapfrogging scenario represents a reasonable but ambitious adoption of and investment in renewable energy technologies, resulting in better access to electricity in urban and rural areas. The scenario includes accelerated access to mobile and fixed broadband and the adoption of modern technology that improves government efficiency and allows for the more rapid formalisation of the informal sector.
The intervention is explained here in the thematic part of the website.
Fixed broadband includes cable modem Internet connections, DSL Internet connections of at least 256 KB/s, fibre and other fixed broadband technology connections (such as satellite broadband Internet, ethernet local area networks, fixed-wireless access, wireless local area networks, WiMAX, etc.).
Greater Internet connectivity through fixed broadband increases the speed at which information can be shared and so spurs on innovation and knowledge transfer between communities and countries. Eswatini’s fixed broadband subscriptions of 2 per 100 people in 2019 was below the average for lower middle-income countries in Africa, which was 3.7, and below the average of 3.2 for Africa. In the Leapfrogging scenario, fixed broadband subscriptions increase to 50 subscriptions per 100 people by 2041. In the Current Path forecast, Eswatini only reaches 28.9 subscriptions by 2043. The interventions proposed in the Leapfrogging scenario accelerate access from 2024 onwards.
Mobile broadband refers to wireless Internet access delivered through cellular towers to computers and other digital devices.
For many decades, Eswatini was stuck with one mobile service provider but the landscape has changed dramatically with the introduction of two new mobile service providers the past few years. Eswatini’s mobile broadband subscriptions stood at 18.5 per 100 people in 2019, below the 49 subscriptions for Africa’s lower middle-income countries. The Leapfrogging scenario will accelerate access to mobile broadband. In the Leapfrogging scenario, mobile broadband subscriptions will increase to 151.7 subscriptions per 100 people by 2043, with access accelerating from 2023 onwards. Compared to the Current Path forecast this scenario has an immediate effect that peaks in 2028.
In total, 67.7% of the country’s population had access to electricity in 2019 — 1.4 percentage points higher than the average for lower middle-income Africa and 14.5 percentage points more than the average for Africa. The country does boast renewable energy potential but this remains underused. The bulk of the energy needs are currently met through imports from the struggling Eskom power utility in neighbouring South Africa with limited hydropower and renewable energy sources in-house.
In the Current Path forecast, it is projected that 90.2% of Eswatini’s population will have access to electricity by 2043, translating to 1.4 million people. In the Leapfrogging scenario, electricity access is projected to reach 99.3% by 2043. The projection indicates that in the Leapfrogging scenario rural electricity access will increase from 62.5% in 2019 to 100% by 2040, while access in the Current Path forecast will reach 84.4% by 2043. For populations living in urban spaces, it is projected that in the Leapfrogging scenario, electricity access will increase from 84.9% in 2019 to 97% by 2043. This rapid acceleration in electricity access will support the country's socio-economic development.
Technology improves the skill level of workers and allows them to be more productive. Technological advances can however increase income levels that are already very high in the country. By 2043, GDP per capita in Eswatini is expected to increase to US$15 969 in the Leapfrogging scenario, compared to US$15 162 in the Current Path forecast. It means that compared to the Current Path, the scenario could improve GDP capita by US$807. The GDP per capita for Eswatini is expected to continue to excel above its income peers.
The Leapfrogging scenario has a positive impact on poverty reduction by 2043, lowering it by 1.9 percentage points compared to the Current Path forecast. The interventions proposed in this scenario will lift an additional 40 000 people out of extreme poverty. Poverty rates remain above the average for lower middle-income Africa throughout the forecast horizon.
The Free Trade scenario represents the impact of the full implementation of the African Continental Free Trade Area (AfCFTA) by 2034 through increases in exports, improved productivity and increased trade and economic freedom.
The intervention is explained here in the thematic part of the website.
The trade balance is the difference between the value of a country's exports and its imports. A country that imports more goods and services than it exports in terms of value has a trade deficit, while a country that exports more goods and services than it imports has a trade surplus.
The economy of Eswatini is heavily dependent on the importation and exportation of basic foodstuffs. The country has several trade agreements in place and is a key link between the economic heartland of Gauteng, in South Africa, and the harbour city of Maputo in Mozambique. Exports include sugar, cotton, beef and soft drink concentrates and the main export recipient is neighbouring South Africa, and to a lesser extent Mozambique, Namibia, Botswana and the EU. The value of agricultural exports in 2019 stood at US$130 million, while the agricultural importation bill stood at US$266 million.
Eswatini’s trade deficit therefore in 2019 stood at 6.1% of GDP. In the Free Trade scenario, Eswatini is projected to record a trade deficit across the forecast horizon. However, between 2026 and 2031, the trade deficit in the scenario remains lower than in the Current Path forecast. In 2043, the deficit is projected to reach 7.9% of GDP compared to the Current Path forecast at a possible surplus of 0.5%.
The full implementation of the AfCFTA will likely improve Eswatini’s trade balance in the short to medium term and deteriorate it in the long term. With the removal of trade restrictions, following trade liberalisation, it becomes easier to import, while Eswatini firms face intense competition on the export markets. However, only using the trade balance is not a viable indicator to conclude that in the long term Eswatini will be a loser in the implementation of the AfCFTA. The country’s total trade will increase significantly in the Free Trade scenario, growing from US$19.7 billion in the Current Path forecast to US$28.6 billion by 2043. Furthermore, employment in the ICT sector will increase by 21% in 2043 compared to the Current Path forecast, a positive shift towards activities with higher productivity rates.
Trade enables countries to export comparatively advantageous products while importing goods that they have less advantage in producing. This eventually results in higher growth due to increased income from export and reduced expenditure on cheaper imported commodities. From all the interventions introduced in the scenarios, it is the Free Trade scenario that will have the biggest positive impact on per capita income in Eswatini. By 2043, GDP per capita in the country is expected to increase to US$16 296 in the Free Trade scenario, compared to US$15 162 in the Current Path forecast — an increase of US$1 134. The GDP per capita for Eswatini is expected to continue to excel above its income peers.
Trade openness will reduce poverty in the long term after initially increasing it due to the redistributive effects of trade. Most African countries export primary commodities and low-tech manufacturing products, and therefore a continental free trade agreement (AfCFTA) that reduces tariffs and non-tariff barriers across Africa will increase competition among countries in primary commodities and low-tech manufacturing exports. Countries with inefficient, high-cost manufacturing sectors might be displaced as the AfCFTA is implemented, thereby pushing up poverty rates. In the long term, as the economy adjusts and produces and exports its comparatively advantaged (lower relative cost) goods and services, poverty rates will decline.
By 2043, the poverty rate will drop from 47.1% in the Current Path forecast to 38.5% in the Free Trade scenario — the biggest impact on poverty from the various intervention scenarios. This scenario therefore causes an 8.6 percentage point reduction in the poverty rate compared to the Current Path forecast, meaning that the Free Trade scenario can move an additional 140 000 people out of extreme poverty by 2043. The Free Trade scenario boosts exports from the manufacturing sector by 10.5% compared to the Current Path forecast by 2043 — an increase which will have a huge impact on poverty reduction due to the large proportion of the country’s labour force employed in the industrial sector. The increase in intra-Africa trade will improve the livelihoods of these people through increased sales and incomes, while opening up new employment opportunities for others not currently employed in the sector.
The Financial Flows scenario represents a reasonable but ambitious increase in worker remittances and aid flows to poor countries, and an increase in the stock of foreign direct investment (FDI) and additional portfolio investment inflows to middle-income countries. We also reduced outward financial flows to emulate a reduction in illicit financial outflows.
The intervention is explained here in the thematic part of the website.
The Eswatini economy benefits significantly from foreign aid inflows, and in 2019 foreign aid represented 3.8% of the country’s GDP, significantly above the average for lower middle-income Africa at 1.7%. Foreign aid flows are projected to decrease both in the Financial Flows scenario and in the Current Path forecast, equating to 0.4% of GDP by 2043. This is a trend that has been observed over the past couple of decades. Foreign aid will also decrease in absolute terms, a sure sign of the country reducing its dependence on foreign aid: by 2043, the Eswatini will receive US$80 million of aid in the scenario, down from US$240 million in 2019. Foreign aid receipts will peak by 2027 in the Financial Flows scenario.
In 2019, foreign direct investment in Eswatini was 1.7 percentage points above the average for lower middle-income Africa. In 2019, FDI inflows represented 4.2% of the country's GDP before declining to 1.6% in 2020 due to the multiple shocks associated with the COVID-19 pandemic. The discontent with the king’s regime, as highlighted by the 2021 riots, is also a cause for concern and will impact investor confidence if not addressed. The country remains strong in terms of attracting investment and has recently released several mining prospect documents. In the Financial Flows scenario, FDI inflows increase to 5.6% of GDP by 2043, 0.6 percentage points higher than the Current Path forecast.
Although Eswatini is a net receiver of remittances, it receives less compared to the average for Africa’s lower middle-income countries. In 2019, the Swazi diaspora remitted an estimated US$100 million — about 1% of GDP. This remittance trend is likely to continue throughout the forecast horizon and in 2043 it is estimated that in the Financial Flows scenario remittances will amount to US$400 million — 0.74% of GDP compared to 0.66% of GDP in the Current Path forecast.
The Financial Flows scenario has a more modest impact on Eswatini’s GDP per capita. By 2043, GDP per capita is expected to increase to US$15 543 in the Financial Flows scenario, compared to US$15 162 in the Current Path forecast — an increase of US$381. The GDP per capita for the country will remain significantly above the average for lower middle-income Africa.
The Financial Flows scenario has a positive effect on poverty reduction in Eswatini. It is expected that this scenario will reduce the poverty rate by 1.2 percentage points by 2043 compared to the Current Path forecast. The scenario has the potential to lift an additional 20 000 people out of poverty compared to the Current Path forecast by 2043.
The Infrastructure scenario represents a reasonable but ambitious increase in infrastructure spending across Africa, focusing on basic infrastructure (roads, water, sanitation, electricity access and ICT) in low-income countries and increasing emphasis on advanced infrastructure (such as ports, airports, railway and electricity generation) in higher-income countries.
Note that health and sanitation infrastructure is included as part of the Health/WaSH scenario and that ICT infrastructure and more rapid uptake of renewables are part of the Leapfrogging scenario. The interventions there push directly on outcomes, whereas those modelled in this scenario increase infrastructure spending, indirectly boosting other forms of infrastructure, including those supporting health, sanitation and ICT.
The intervention is explained here in the thematic part of the website.
In 2019, 84.9% of urban and 62.5% of rural populations in Eswatini had access to electricity. The Infrastructure scenario stands to benefit the country by increasing the total electricity access to 89.7% in 2043 — 3.1 percentage points above the Current Path forecast. It will also improve rural access to 87.9% by 2043 — 3.5 percentage points above the Current Path forecast. In the urban areas, electricity access rates in this scenario will reach 95.2% by 2043 — 1.9 percentage points above the Current Path forecast.
Indicator 9.1.1 in the Sustainable Development Goals refers to the proportion of the rural population who live within 2 km of an all-season road and is captured in the Rural Access Index.
Measuring rural accessibility is a very important development indicator. There is a strong link between investing in rural access roads and positive socio-economic impacts, such as improving rural income, reducing poverty, reducing maternal deaths, improving paediatric health and increasing agricultural productivity.
Eswatini’s small geographic size and the significant historical investment in accessibility has placed the country far above the average for lower middle-income Africa and it boasts the tenth highest rural access in Africa. Eswatini’s geographical position between South Africa’s economic heartland, Gauteng, and the harbour capital city of Mozambique, Maputo, facilitates trade and investment. The MR3 corridor that connects and facilitates this trade route has increased accessibility vastly. In 2019, 77.7% of the rural population of Eswatini had access to an all-weather road, compared to an average of 61.4% for lower middle-income countries in Africa and 53% for the average of Africa. The Infrastructure scenario will benefit rural accessibility, and by 2043 it is projected that 91.3% of the rural population will have access to an all-weather road, compared to 87.8% in the Current Path forecast.
Quality infrastructure not only enables business and industry development but also increases efficiency in the delivery of social services. Important basic infrastructure, such as roads and electricity, plays a vital role in achieving sustained economic growth and in Eswatini’s case can facilitate trade with its neighbours through the MR3 corridor. By 2043, GDP per capita in Eswatini is expected to increase to US$15 772 in the Infrastructure scenario, compared to US$15 162 in the Current Path forecast — an increase of US$610. The GDP per capita for Eswatini will remain above the average for lower middle-income Africa throughout the forecast horizon.
The Infrastructure scenario has a small impact on poverty reduction by 2043 compared to the Current Path forecast, lowering poverty by 2.2 percentage points and lifting an additional 40 000 people out of poverty. By 2043, in the Infrastructure scenario 710 000 people will still be living in extreme poverty. Poverty rates remain significantly above the average for lower middle-income Africa throughout the forecast horizon.
The Governance scenario represents a reasonable but ambitious improvement in accountability and reduces corruption, and hence improves the quality of service delivery by government.
The intervention is explained here in the thematic part of the website.
As defined by the World Bank, government effectiveness ‘captures perceptions of the quality of public services, the quality of the civil service and the degree of its independence from political pressures, the quality of policy formulation and implementation, and the credibility of the government’s commitment to such policies’.
Chart 51 presents the impact of the interventions in the Governance scenario on government effectiveness.
Eswatini scored above the average for lower middle-income Africa and Africa on government effectiveness. In 2019, Eswatini had the 15th highest government effectiveness score in Africa and the eighth highest among its income peers. The Governance scenario improves the score from 2 (out of a maximum of 5) in 2019 to 2.7 in 2043. The lack of democracy and judicial independence has however stirred tension within Eswatini in the past few years and the economic climate has been further complicated by the fall in SACU revenues and the weak economy within the country. Foreign investment is at risk of being impacted by the ongoing deterioration of the governance system if not addressed.
By 2043, GDP per capita in Eswatini will increase to US$15 511 in the improved Governance scenario, compared to US$15 162 in the Current Path forecast — an increase of US$349. The GDP per capita for Eswatini will remain above the average for lower middle-income Africa throughout the forecast horizon.
The Governance scenario will have a small impact on alleviating poverty by 2043. The Governance scenario will reduce poverty by 1.1 percentage points, translating to 20 000 fewer people being extremely poor, compared to the Current Path forecast by 2043. The poverty rate will remain very high at 46% and Eswatini will continue to suffer endemic poverty throughout the forecast horizon.
Chart 54 displays projected tons of carbon emissions for Eswatini in the Current Path and the 11 intervention scenarios. Note that IFs uses carbon equivalents rather than CO2 equivalents.
Eswatini’s carbon emissions are projected to increase most in the Free Trade scenario, with an additional 700 000 tons of carbon emissions by 2043 compared to 2019, and a trivial amount more compared to the Current Path forecast for 2043.
In the Leapfrogging and Demographic scenarios, emissions are forecast to be the lowest. This is largely the result of the population being smaller in the Demographic scenario compared to the Current Path forecast and the streamlining of more modern, low emission technologies in the Leapfrogging scenario. The most carbon-intensive intervention is the Free Trade scenario, which will result in the greatest increase in GDP per capita, due to the related substantial economic growth forecasted in this scenario.
The Combined Agenda 2063 scenario consists of the combination of all 11 sectoral scenarios presented above, namely the Stability, Demographic, Health/WaSH, Agriculture, Education, Manufacturing/Transfers, Leapfrogging, Free Trade, Financial Flows, Infrastructure and Governance scenarios. The cumulative impact of better education, health, infrastructure, etc. means that countries get an additional benefit in the integrated IFs forecasting platform that we refer to as the synergistic effect. Chart 55 presents the contribution of each of these 12 components to GDP per capita in the Combined Agenda 2063 scenario as a stacked area graph.
Eswatini boasts great economic potential and there are plenty of opportunities to improve the future of the country. Improving intra-Africa trade (as captured in the Free Trade scenario) will raise GDP per capita the most by 2043 with an additional US$1 137 above the Current Path forecast. Improving manufacturing will raise GDP per capita with US$861 above the Current Path forecast while leapfrogging could raise income by US$807 in 2043 above the Current Path forecast by 2043. The synergistic effect of a Combined Agenda 2063 scenario that assumes improvements are made in all 11 broad intervention areas could add an additional US$1 864 in 2043 on top of the combined per capita income. The Health/WaSH, Financial Flows and Governance scenarios are the interventions that will lead to the least improvement in GDP per capita by 2043.
Whereas Chart 55 presents a stacked area graph on the contribution of each scenario to GDP per capita as well as the additional benefit or synergistic effect, Chart 56 presents only the GDP per capita in the Current Path forecast and the Combined Agenda 2063 scenario.
In the Combined Agenda 2063 scenario, it is assumed that improvements are made in all the 11 broad intervention areas. It is a concerted effort to remove the binding constraints to growth and development in the country. The Combined Agenda 2063 scenario has the potential to raise GDP per capita in Eswatini to US$22 901 by 2043 — a significant US$7 739 above the Current Path forecast for the same year. The Combined Agenda 2063 scenario shows that a policy push across all the development sectors is necessary to achieve growth and development in Eswatini. An intervention at this scale is crucial to addressing the low productivity of human capital, high rural poverty rates and high disease burden in the country.
The Combined Agenda 2063 interventions can benefit the economy of Eswatini, significantly reducing the poverty burden of the country. If Eswatini can effectively implement measures as outlined in the Combined Agenda 2063 scenario, poverty can be reduced from 60% in 2019 to 24.5% in 2043 using the US$3.20 benchmark for lower middle-income countries. The scenario has the potential to reduce poverty in 2043 by 22.6 percentage points compared to the Current Path forecast, lifting an additional 400 000 people out of poverty. Despite this significant improvement, 380 000 people will still be living in extreme poverty by 2043.
See Chart 8 to view the Current Path forecast of the sectoral composition of the economy.
The service sector will contribute 2.6 percentage points more to GDP in the Combined Agenda 2063 scenario compared to the Current Path forecast, equivalent to a difference of US$5.5 billion by 2043. The ICT sector will contribute 0.9 percentage points more to GDP in the Combined Agenda 2063 scenario compared to the Current Path forecast, adding an additional US$800 million by 2043.
Even though the manufacturing sector will contribute 2.2 percentage points less by 2043, the value would be US$3.7 billion more by 2043 compared to the Current Path. Similarly, the agriculture sector will contribute 0.7 percentage points less compared to the Current Path by 2043, but the value would be US$100 million more compared to the Current Path forecast in the same year.
Eswatini’s GDP is forecast to grow to US$29.3 billion by 2043 in the Combined Agenda 2063 scenario, compared to US$19 billion in the Current Path forecast. It means that in the Combined Agenda 2063 scenario, the size of the Eswatini economy will grow by an additional 54.2%. This shows the value that the interventions in the 11 sectoral scenarios will have on economic growth.
In 2019, Eswatini emitted 0.4 million tons of carbon and it is projected to increase to 1.4 million tons of carbon by 2043 in the Combined Agenda 2063 scenario, 0.3 million tons above the Current Path forecast for 2043. The higher carbon emissions in the Combined Agenda 2063 scenario reflect the ambitious economic growth that is projected to occur in this scenario.
Page information
Contact at AFI team is Alize le Roux
This entry was last updated on 31 May 2026 using IFs v7.63.
Donors and sponsors


Reuse our work
- All visualizations, data, and text produced by African Futures are completely open access under the Creative Commons BY license. You have the permission to use, distribute, and reproduce these in any medium, provided the source and authors are credited.
- The data produced by third parties and made available by African Futures is subject to the license terms from the original third-party authors. We will always indicate the original source of the data in our documentation, so you should always check the license of any such third-party data before use and redistribution.
- All of our charts can be embedded in any site.
Cite this research
Alize le Roux (2026) Eswatini Development Futures. Published online at futures.issafrica.org. Retrieved from https://futures.issafrica.org/geographic/countries/eswatini/ [Online Resource] Updated 31 May 2026.