 Equatorial Guinea
Feedback welcome
Our aim is to use the best data to inform our analysis. See our Technical page for information on the IFs forecasting platform. We appreciate your help and references for improvements via our feedback form.
Please note: This country report was developed using African Futures’ previous analytical framework, which organised the assessment across 11 sectoral scenarios. We have since updated and streamlined the analytical architecture to 8 sectoral scenarios. While the two frameworks remain broadly aligned, the current structure improves consistency, comparability and integration across themes and geographic studies. This page will therefore be updated to the current framework in due course. Read more about our analytical framework on the Technical Page.
In this entry, we first describe the Current Path forecast for Equatorial Guinea as it is expected to unfold to 2043, the end of the third ten-year implementation plan of the African Union’s Agenda 2063 long-term vision for Africa. The Current Path in the International Futures (IFs) forecasting model initialises from country-level data that is drawn from a range of data providers. We prioritise data from national sources.
The Current Path forecast is divided into summaries on demographics, economics, poverty, health/WaSH and climate change/energy. A second section then presents a single positive scenario for potential improvements in stability, demographics, health/WaSH, agriculture, education, manufacturing/transfers, leapfrogging, free trade, financial flows, infrastructure, governance and the impact of various scenarios on carbon emissions. With the individual impact of these sectors and dimensions having been considered, a final section presents the impact of the Combined Agenda 2063 scenario.
We generally review the impact of each scenario and the Combined Agenda 2063 scenario on gross domestic product (GDP) per person and extreme poverty except for Health/WaSH that uses life expectancy and infant mortality.
The information is presented graphically and supported by brief interpretive text.
All US$ numbers are in 2017 values.
Executive Summary
- Current Path forecast
- Although Equatorial Guinea is considered an upper middle-income country as a result of its oil income, few of its population benefit from its riches and many of its development indicators are more typical of a low or low middle-income country. Jump to forecast: Current Path
- Equatorial Guinea has a small population and is the second most urbanised country in Africa. Jump to Demographics: Current Path
- The discovery of oil in 1995 transformed the fortunes of the governing elite, but little of its benefits trickled down and there is a large disparity between its economic status and key development indicators. Like most other African countries, the service sector dominates its economy and the agriculture sector has declined in spite of its potential. Jump to Economics: Current Path
- Poverty is pervasive and widespread. Almost 98% of the population lived below US$5.50 per person per day in 2019, declining to only 95% in 2043. Jump to Poverty: Current Path
- Equatorial Guinea has relatively small oil and gas reserves and modest production rates, although these are important given its small population and economy. Because of its large forest area, it currently absorbs more carbon than it releases but will become a net carbon contributor as from 2027. Jump to Carbon emissions/Energy: Current Path
- Sectoral scenarios
- Because of its autocratic status, the situation in Equatorial Guinea is stable but repressive. The country will experience inevitable turbulence as pressure for better governance and democratic reform mounts. Jump to Stability scenario
- In contrast to the general trend in Africa of steady improvements in the ratio of working-age persons to dependants, the ratio in Equatorial Guinea is currently declining, forecast to slowly improve as from 2023. The country will not achieve a demographic dividend by 2043. Jump to Demographic scenario
- In 2019, life expectancy in Equatorial Guinea was 63.8 years and will increase to 71.7 years by 2043 on the Current Path forecast, which is the second lowest among upper middle-income countries globally. In the Health/WaSH scenario, it improves to 72.5 years. Jump to Health/WaSH scenario
- Equatorial Guinea’s agriculture sector is small, in spite of its huge potential. In the Agriculture scenario, domestic food production increases significantly and import dependence is only at 12.1% in 2043, roughly similar to the situation in 2019. Jump to Agriculture scenario
- Average years of adult education is high, but the quality of education is poor and falling further behind Equatorial Guinea’s income peers. In the Education scenario, mean years of adult education increases by almost 6% to 10.2 years in 2043. Jump to Education scenario
- The Manufacturing/Transfers scenario increases GDP per capita by 7.6% above the Current Path forecast in 2043. Jump to Manufacturing/Transfers scenario
- Fixed and mobile broadband in Equatorial Guinea is among the lowest in Africa but is set to increase rapidly. Although urban electricity access is high, rural electricity access is poor. The Leapfrogging scenario increases GDP per capita by 5.7% above the Current Path forecast in 2043. Jump to Leapfrogging scenario
- The Free Trade scenario increases the value of manufacturing exports by 9.7 percentage points in 2043. Jump to Free Trade scenario
- Equatorial Guinea gets very little aid, and experiences a small outflow of remittances. The Financial Flows scenario increases foreign direct investment inflows by 2 percentage points of GDP above the Current Path forecast in 2043. Jump to Financial Flows scenario
- In 2019, electricity access in Equatorial Guinea was 68.1% and will increase to 89.9% in 2043. In the Infrastructure scenario it increases to 93.5% in 2043. Jump to Infrastructure scenario
- In 2019, Equatorial Guinea ranked 49th out of 54 African countries on the World Bank Government Effectiveness index, just ahead of Eritrea. The IFs forecast is, however, for an improvement in effectiveness to 36th position in Africa by 2043. The Governance scenario would improve government effectiveness score by a further 5%. Jump to Governance scenario
- Because of its large forest area, Equatorial Guinea’s net carbon emissions are low, and, because of the recent contraction in economic growth, will only recover to the 2019 levels around 2030 in all scenarios. The Manufacturing/Transfers scenario will result in the highest emissions. Jump to Impact of scenarios on carbon emissions
- Combined Agenda 2063 scenario
- In the Combined Agenda 2063, the GDP per capita for Equatorial Guinea is almost 64% above the Current Path forecast for 2043, and extreme poverty will be five percentage points lower (using US$5.50). Jump to Combined Agenda 2063 scenario
All charts for Equatorial Guinea Development Futures
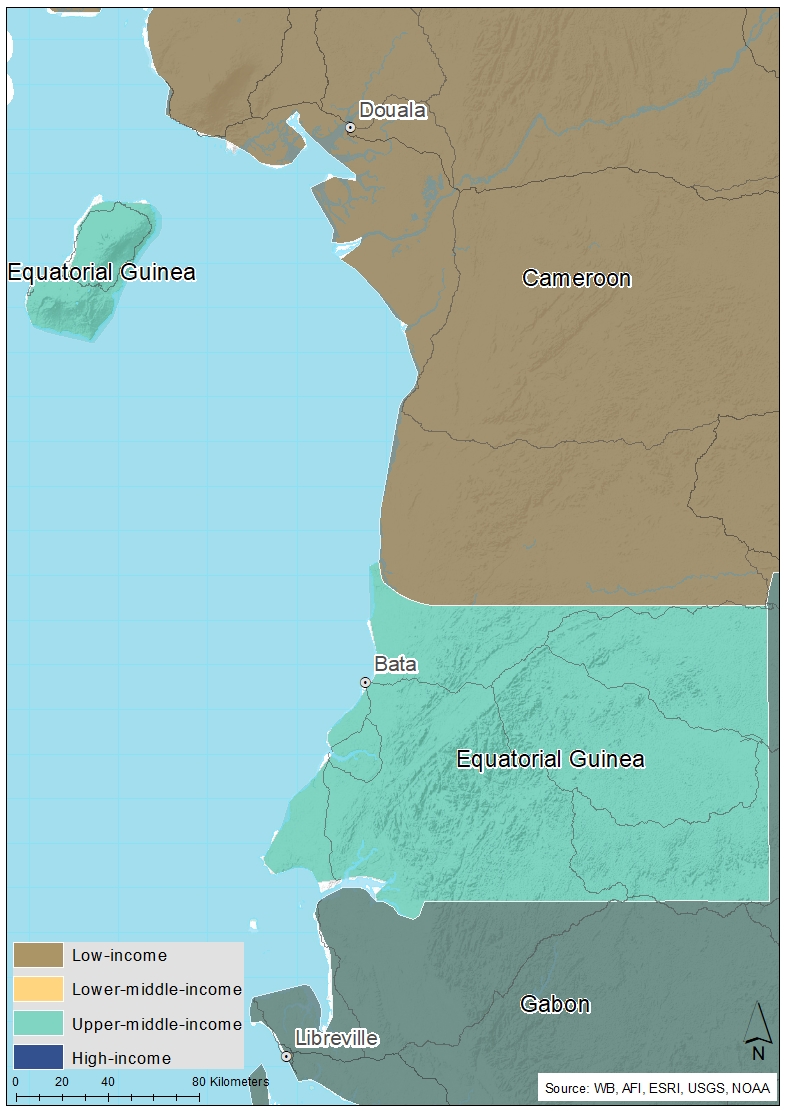
- Chart 1: Political map of Equatorial Guinea
- Chart 2: Population structure in CP, 1990–2043
- Chart 3: Urban and rural population in CP, 1990–2043
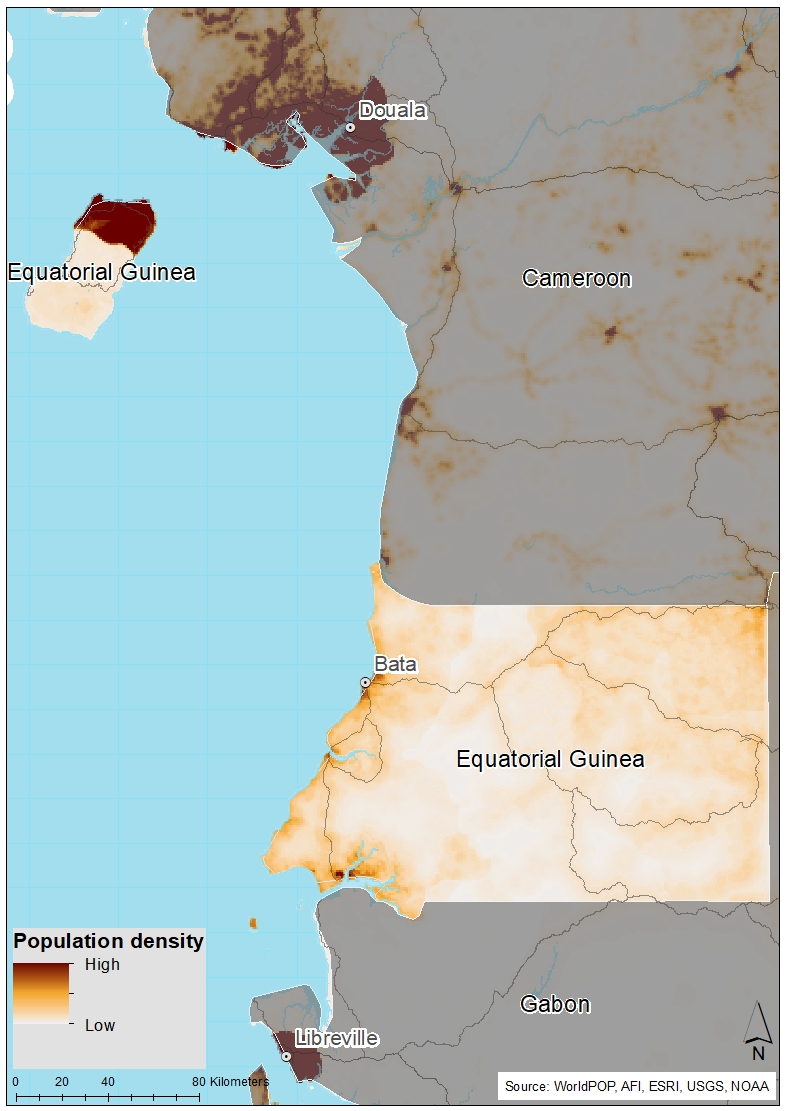
- Chart 4: Population density map for 2019
- Chart 5: GDP in CP, 1990–2043
- Chart 6: GDP per capita in CP, 1990–2043
- Chart 7: Informal sector value in CP, 2015–2043
- Chart 8: Value added by sector in CP, 2015–2043
- Chart 9: Agriculture production/demand in CP, 1990–2043
- Chart 10: Poverty in CP, 2015–2043
- Chart 11: Energy production by type in CP, 1990–2043
- Chart 12: Carbon emissions in CP, 1990–2043
- Chart 13: Governance security in CP and Stability scenario, 2019–2043
- Chart 14: GDP per capita in CP and Stability scenario, 2019–2043
- Chart 15: Poverty in CP and Stability scenario, 2019–2043
- Chart 16: Demographic dividend in CP and Demog scenario, 2019–2043
- Chart 17: Infant mortality in CP and Demog scenario, 2019–2043
- Chart 18: GDP per capita in CP and Demog scenario, 2019–2043
- Chart 19: Poverty in CP and Demog scenario, 2019–2043
- Chart 20: Life expectancy in CP and Health/WaSH scenario, 2019–2043
- Chart 21: Infant mortality in CP and Health/WaSH scenario, 2019–2043
- Chart 22: Yield/hectare in CP and Agric scenario, 2019–2043
- Chart 23: Agriculture imports in CP and Agric scenario, 2019–2043
- Chart 24: GDP per capita in the CP and Agric scenario, 2019–2043
- Chart 25: Poverty in CP and Agric scenario, 2019–2043
- Chart 26: Mean years of education in CP and Educ scenario, 2019–2043
- Chart 27: Education quality in CP and Educ scenario, 2019–2043
- Chart 28: GDP per capita in CP and Educ scenario, 2019–2043
- Chart 29: Poverty in CP and Educ scenario, 2019–2043
- Chart 30: Value added by sector in CP and Manufac/Transfers scenario, 2019–2043
- Chart 31: Gov welfare transfers in CP and Manufac/Transfers scenario, 2019–2043
- Chart 32: GDP per capita in CP and Manufac/Transfers scenario, 2019–2043
- Chart 33: Poverty in CP and Manufac/Transfers scenario, 2019–2043
- Chart 34: Fixed broadband access in CP and Leapfrogging scenario, 2019–2043
- Chart 35: Mobile broadband access in CP and Leapfrogging scenario, 2019–2043
- Chart 36: Electricity access in CP and Leapfrogging scenario, 2019–2043
- Chart 37: GDP per capita in CP and Leapfrogging scenario, 2019–2043
- Chart 38: Poverty in CP and Leapfrogging scenario, 2019–2043
- Chart 39: Trade balance in CP and Free Trade scenario, 2019–2043
- Chart 40: GDP per capita in CP and Free Trade scenario, 2019–2043
- Chart 41: Poverty in CP and Free Trade scenario, 2019–2043
- Chart 42: Foreign aid in CP and Financial Flows scenario, 2019–2043
- Chart 43: Inflow of FDI in CP and Financial Flows scenario, 2019–2043
- Chart 44: Remittances in CP and Financial Flows scenario, 2019–2043
- Chart 45: GDP per capita in CP and Financial Flows scenario, 2019–2043
- Chart 46: Poverty in CP and Financial Flows scenario, 2019–2043
- Chart 47: Electricity access in CP and Infrastructure scenario, 2019–2043
- Chart 48: Rural road access in CP and Infrastructure scenario, 2019–2043
- Chart 49: GDP per capita in CP and Infrastructure scenario, 2019–2043
- Chart 50: Poverty in CP and Infrastructure scenario, 2019–2043
- Chart 51: Gov effectiveness in CP and Governance scenario, 2019–2043
- Chart 52: GDP per capita in CP and Governance scenario, 2019–2043
- Chart 53: Poverty in CP and Governance scenario, 2019–2043
- Chart 54: Carbon emissions in CP and scenarios, 2019–2043
- Chart 55: GDP per capita in CP and scenarios, 2019–2043
- Chart 56: GDP per capita in CP and Combined scenario, 2019–2043
- Chart 57: Poverty in CP and Combined scenario, 2019–2043
- Chart 58: Value added by sector in CP and Combined scenario, 2019–2043
- Chart 59: GDP in CP and Combined scenario, 2019–2043
- Chart 60: Carbon emissions in CP and Combined scenario, 2019–2043


Equatorial Guinea Development Futures: Current Path
Download to pdfThis page provides an overview of the key characteristics of Equatorial Guinea along its likely (or Current Path) development trajectory. The Current Path forecast from the International Futures forecasting (IFs) platform is a dynamic scenario that imitates the continuation of current policies and environmental conditions. The Current Path is therefore in congruence with historical patterns and produces a series of dynamic forecasts endogenised in relationships across crucial global systems. We use 2019 as a standard reference year and the forecasts generally extend to 2043 to coincide with the end of the third ten-year implementation plan of the African Union’s Agenda 2063 long-term development vision.
Equatorial Guinea is the only former Spanish colony in sub-Saharan Africa. It is composed of a mainland, Rio Muni, and small islands including Bioko, where the capital Malabo is located, Annobon, Corisco, Elobey, and others. The country is bordered in the north by Cameroon, to the east and south by Gabon, and to the west by the Gulf of Guinea. Its location just north of the Equator means that the climate is tropical, hot and humid throughout the year with plentiful rain. Equatorial Guinea is fortunate to have arable land and mineral resources including gold, oil, uranium, diamond and columbite-tantalite, and notably petroleum in the 1990s.
Using gross domestic product (GDP) per capita adjusted for purchasing power parity (PPP), Equatorial Guinea ranks at 63rd in the world in 2019; however, the wealth is distributed extremely unevenly, with few people benefiting from the oil riches. The country ranks 145th on the Human Development Index, with less than half the population having access to clean drinking water and around 1 in 12 children dying before the age of five. These large disparities in development indicators and a lack of dependable national data mean that the forecasts on prospects for Equatorial Guinea have a large degree of uncertainty.
Equatorial Guinea is a member of the Economic Community of Central African States (ECCAS) and joined the CFA franc zone in 1985. It is currently classified as an upper middle-income country.
Equatorial Guinea has a small population: in 1990 it was 419 000 people and increased to 1.356 million in 2019 (eighth smallest in Africa), and it is expected to reach 2.462 million in 2043. In 2019, around 38.1% of the population (501 322 people) consisted of children under 15 years of age; this figure is expected to decline to 35.1% (864 100 people) in 2043. Almost 26% of Equatorial Guinea’s adult population was in the age bracket 15 to 29 years in 2019, generally considered to constitute the youth bulge, increasing to 27.4% in 2043. Both numbers are quite low by comparative African standards.
Equatorial Guinea has the smallest population aged 65 and above among Africa’s seven upper middle-income countries. Its population aged 65 years and over only constituted 2.87% (37 800 people) in 2019, forecast to increase to 5.3% (129 406 people) in 2043. In Gabon, the portion was 3.6% in 2019; Mauritius had the largest at 12.1% in 2019.
Equatorial Guinea has urbanised rapidly. In 1990, only 34.7% (or 145 600) of its population was considered urban, increasing dramatically to 75.5% in 2019 (fourth most urban in Africa) and is forecast to get to 88.7% (2.183 million) in 2043. At that point it will be the second most urban country in Africa. Gabon will be most urban. Urbanisation, if well planned, offers an opportunity to promote inclusive economy by accelerating the provision of a range of services including education.
Population density in 2019 was 0.5 people per hectare, roughly comparable to South Africa and Madagascar, with three quarters of the population living in urban areas. The largest cities are Bata and Malabo although both have fewer than 200 000 inhabitants.
The discovery of oil in 1995 transformed the fortune of the governing elite in Equatorial Guinea. The discovery saw economic growth rates regularly exceed 20% per year until 2008 after which growth slowed. Whereas in 1995 Equatorial Guinea had the fourth smallest economy in Africa, by 2019 it was ranked as the 28th largest and will be 26th in 2043. Little of the wealth has trickled down to the general population, however, and there is a large misalignment between the country’s economic status and key development indicators including extreme poverty and inequality.
In addition to oil, Equatorial Guinea is endowed with large tracts of arable land and various minerals, namely gold, uranium, diamonds and columbite-tantalite.
Its dependence upon oil means that Equatorial Guinea is vulnerable to commodity shocks, as occurred with the collapse of the oil price in 2014. Fluctuations of the oil price have also resulted in a significant retraction of the economy over the past six years. The economy peaked in size from 2012 to 2014 and, in the Current Path forecast, will only regain that size in 2029 in spite of population growth. In 2019, the size of the economy was US$16.8 billion and it will grow to US$53.8 billion in 2043.
Equatorial Guinea’s dependency on the oil sector, poor economic performance and high levels of corruption raise significant questions and uncertainty relating to the country's long-term development prospects. Key among these are its development outcomes in sectors such as health.
The country has set out ambitious goals in its 2020–2035 National Sustainable Development Plan that aspire to create a more prosperous future for its citizens through diversifying its economy and doing so in a manner that reconciles economic growth with the protection of natural resources.
Although many of the charts in the sectoral scenarios also include GDP per capita, this overview is an essential point of departure for interpreting the general economic outlook of Equatorial Guinea.
The discovery of oil in the 1990s and the associated high economic growth significantly increased the GDP per capita of Equatorial Guinea. Indeed, the GDP per capita increased from US$1 900 in 1995 and peaked at US$44 000 in 2008. Between 2004 and 2015, the country boasted the highest GDP per capita in Africa. However, with the retraction of the economy over the past six years, the GDP per capita declined by more than 50% from its level in 2008 to reach US$20 942 in 2019.
Using GDP per capita, Equatorial Guinea ranked 63rd out of 186 countries globally in 2019 within the IFs system, and fourth highest in Africa, behind only Seychelles, Mauritius and Libya. On the Current Path, GDP per capita is forecast to increase from U$20 942 in 2019 to US$30 522 in 2043 — an increase of 46%.
The reality for the majority of Equatorial Guinea’s population is very different, with most of the wealth being amassed by a single extended family and much of the population living in abject poverty. These disparities are generally not captured when using the Gini coefficient, according to which Equatorial Guinea is the ninth most unequal country in Africa, doing only slightly worse than Botswana and Mozambique.
Data on the size of the informal sector in Equatorial Guinea is scarce. In 2019, the size of the informal economy in the country was estimated at 34% of GDP (US$5.71 billion). In the Current Path forecast, it will decline to 23.8% of GDP in 2043 but will increase in size to US12.81 billion.
The IFs platform uses data from the Global Trade and Analysis Project (GTAP) to classify economic activity into six sectors: agriculture, energy, materials (including mining), manufacturing, service and information and communication technologies (ICT). Most other sources use a threefold distinction between only agriculture, industry and services with the result that data may differ.
In 2019, the service sector contributed to 42% of Equatorial Guinea’s economy (GDP), followed by manufacturing at 19.3%, energy at 17%, ICT at 10.8%, agriculture at 6.9%, and materials at 4.4%. By 2043, services will contribute 51.8% and manufacturing 24.9%, with agriculture declining to 2.4%, slightly below energy at 2.7%.
The IFs estimate for the contribution from agriculture is higher than from the African Development Bank which has it at less than 2% in 2011 because of differences in the aggregation of economic sectors.
The data on agricultural production and demand in the IFs forecasting platform initialises from data provided on food balances by the Food and Agriculture Organization (FAO). IFs contains data on numerous types of agriculture but aggregates its forecast into crops, meat and fish, presented in million metric tons. Chart 9 shows agricultural production and demand as a total of all three categories.
Before independence, Equatorial Guinea exported cocoa, coffee and timber, but the contribution of the agriculture sector has steadily declined since the discovery of oil, particularly cocoa and fishing. According to the African Development Bank the agriculture sector accounted for less than 2% of GDP. The estimate in IFs for 2019 is at almost 7% because of differences in the aggregation of economic sectors.
Around 6.3% (177 million hectares) of Equatorial Guinea’s land area is used for crops, 3.7% (104 000 hectares) is used for grazing, 56% (1.6 million hectares) is covered by forests, and 1.4% (40 000 hectares) is used for urban settlements. Just over 9 000 hectares are irrigated. Much of the agriculture sector consists of subsistence farming, which suffers from decades of neglect in spite of various efforts to improve matters. In 2015, the Government of Equatorial Guinea and the FAO signed a US$31.5 million partnership agreement to promote agricultural development in Equatorial Guinea.
Agricultural (crop) production in 2019 stood at 0.82 million metric tons, below the domestic demand at 0.94 million metric tons. The gap between agricultural production and demand is forecast to widen across the forecast horizon. By 2043, crop production and demand are forecast to be 1.23 million metric tons and 12.32 million metric tons, respectively. This is equivalent to excess demand of 1.1 million metric tons that will likely be met through imports.
There are numerous methodologies for and approaches to defining poverty. We measure income poverty and use GDP per capita as a proxy. In 2015, the World Bank adopted the measure of US$1.90 per person per day (in 2011 international prices), also used to measure progress towards the achievement of Sustainable Development Goal (SDG) 1 of eradicating extreme poverty. To account for extreme poverty in richer countries occurring at slightly higher levels of income than in poor countries, the World Bank introduced three additional poverty lines in 2017:
- US$3.20 for lower middle-income countries
- US$5.50 for upper middle-income countries
- US$22.70 for high-income countries.
The last poverty rate data available for Equatorial Guinea is for 2006, according to which extreme poverty stood at 76.8%, and serves as initiation point for subsequent forecasts within IFs. Within IFs, 83.2% of Equatorial Guinea’s population (1.094 million people) lived below US$1.90 and 97.8% below US$5.50 in 2019. In the Current Path forecast, extreme poverty in 2043 will be 73.3% (at US$1.90) and 95% (at US$5.50). Child poverty is particularly high. A 2012 report from the African Development Bank reads as follows: ‘Equatorial Guinea faces serious challenges in the fight against poverty and income inequality. The most recent estimates suggest that three quarters of the population live on less than 2 US dollars (USD) per day. The 15 to 24 age group, single women and large one-parent families with at least six children are the hardest hit. These categories account for 79% of households or 89% of the population.’
The IFs platform forecasts six types of energy, namely oil, gas, coal, hydro, nuclear and other renewables. To allow comparisons between different types of energy, the data is converted into billion barrels of oil equivalent (BBOE). The energy contained in a barrel of oil is approximately 5.8 million British thermal units (MBTUs) or 1 700 kilowatt-hours (kWh) of energy.
In 2019, Equatorial Guinea had the 12th largest oil reserves in Africa (around 2% of the oil reserves of Libya, which is the largest in Africa) and the tenth largest reserves of gas (around 1% of the gas reserves of Algeria, which has Africa’s largest gas reserves). While, in 2019, it had oil reserves equivalent to 15 years of oil production, gas production will last much longer. In that year, it produced 66 million barrels of oil and, in the Current Path forecast, will produce 16 million barrels in 2043 as its current reserves become depleted. Recently, additional gas reserves have been discovered and the country is actively engaged in extending exploration and investments in the sector, but the size of its confirmed reserves are quite small. Gas production was 4 million barrels (oil equivalent) in 2019, increasing to 23 million barrels in 2043. Measured in million barrels of oil, gas production will overtake oil production in 2042.
Carbon is released in many ways, but the three most important contributors to greenhouse gases are carbon dioxide (CO2), carbon monoxide (CO) and methane (CH4). Since each has a different molecular weight, IFs uses carbon. Many other sites and calculations use CO2 equivalent.
Because of its small population and large forest area, Equatorial Guinea contributed very little carbon to the atmosphere prior to the discovery of oil in 1995. Even in 2019, its contribution is only at 438 000 tons per annum, expected to increase to 2.2 million tons in 2043. Because of its large forests, the IFs forecast is that Equatorial Guinea currently absorbs more carbon that it releases and will only again become a small net contributor as from 2027.
Sectoral Scenarios for Equatorial Guinea Development Futures
Download to pdfThe Stability scenario represents reasonable but ambitious reductions in risk of regime instability and lower levels of internal conflict. Stability is generally a prerequisite for other aspects of development and this would encourage inflows of foreign direct investment (FDI) and improve business confidence. Better governance through the accountability that follows substantive democracy is modelled separately.
The intervention is explained here in the thematic part of the website.
IFs’ governance security index ranges from 0 (low security) to 1 (high security). The Current Path forecast is for a steady improvement in stability. In 2019, Equatorial Guinea ranked 27th most stable country in Africa on the IFs Governance security index, placing it in the middle of the 54 African countries. By 2043, its ranking improves to 18th most stable in Africa in the Current Path forecast. However, stability in Equatorial Guinea is associated with its autocratic political systems in which the governing elite have a virtual monopoly on the centralised use of force and are able and willing to suppress dissent and opposition. Its autocratic system allows for one of Africa’s most extreme rentier economic systems. The suppression of political freedom obscures high levels of dissatisfaction and the potential for civil unrest should the opportunity arise. Various attempts at coups have not succeeded and the absence of checks and balances means that President Mbasogo and his executive have the ability to govern with little accountability or oversight.
The Stability scenario improves the score for Equatorial Guinea on the governance security index by 7% in 2043 compared to the Current Path forecast for that year.
It seems inevitable that political reform, highly necessary, will be accompanied by increased levels of instability if unaccompanied by efforts to ensure a better distribution of the oil revenue for long-term peace and stability.
Due to its oil wealth, GDP per capita for Equatorial Guinea was estimated at US$20 942 in 2019. Globally, the country ranked 63rd out of 186 countries in 2019 — the fourth highest in Africa, behind only Seychelles, Mauritius and Libya. GDP per capita is forecast to increase to US$30 522 in 2043. At that point, Equatorial Guinea will have the highest GDP per capita in Africa. In the Stability scenario, GDP per capita improves to US$31 077 in 2043 — an improvement of US$555 or 2% above the Current Path forecast.
The reality for the majority of its population is, however, very different from the averages presented in these numbers, with most of the wealth being amassed by a single extended family, and much of the population living in abject poverty. These disparities are not fully captured when using the Gini coefficient, according to which Equatorial Guinea is the ninth most unequal country in Africa, doing only slightly worse than Botswana and Mozambique.
The Current Path forecast is for a steady reduction in rates of extreme poverty with relatively small improvements as a result of the Stability scenario. Within IFs, 83.2% of Equatorial Guinea’s population (1.094 million people) lived below US$1.90 and 97.8% below US$5.50 in 2019. In the Current Path forecast, 73.3% of the population (1.808 million people) will be in extreme poverty in 2043 using US$1.90, and 95% (2.345 million people) at US$5.50. In the Stability, scenario extreme poverty declines to 72.7% (1.795 million people) in 2043, using US$1.90, or 94.9% (2.341 million people), using US$5.50.
This section presents the impact of a Demographic scenario that aims to hasten and increase the demographic dividend through reasonable but ambitious reductions in the communicable-disease burden for children under five, the maternal mortality ratio and increased access to modern contraception.
The intervention is explained here in the thematic part of the website.
Demographers typically differentiate between a first, second and even a third demographic dividend. We focus here on the contribution of the size of the labour force (between 15 and 64 years of age) relative to dependants (children and the elderly) as part of the first dividend. A window of opportunity opens when the ratio of the working-age population to dependants is equal to or surpasses 1.7.
Due to changes in the total fertility rate, the ratio of working-age people to dependants in Equatorial Guinea is above the African average, but it is currently declining, in contrast to the general trend in Africa of steady improvements.
The IFs forecast is that the ratio will bottom out at 1.43 working-age persons to every dependant in 2022/23 and thereafter slowly improve to 1.46 working-age persons to every dependant in 2043. The Demographic scenario improves the ratio of working-age persons to dependants to 1.54 to 1 in 2043, still below the minimum ratio of 1.7 required to expect the materialisation of the demographic dividend. The implication is that Equatorial Guinea will not benefit from a demographic dividend, even by 2043, in the Demographic scenario. By comparison, the average ratio for upper middle-income Africa in 2019 is 1.8 working-age persons to every dependant, improving to 2 by 2043.
The infant mortality rate is the number of infant deaths per 1 000 live births and is an important marker of the overall quality of the health system in a country.
Rates of infant mortality in Equatorial Guinea are much higher than other upper middle-income countries in Africa. In 2019, the infant mortality rate in Equatorial Guinea was 51.8 deaths per 1 000 live births compared to an average of 30 for other African upper middle-income countries. According to estimates from the UNICEF, the 2019 rate for Equatorial Guinea was even higher, at 60 deaths. The IFs forecast is that the rate for Equatorial Guinea will decline to 37.6 in 2043 and 30.7 in the Demographic scenario. The latter would represent an 18% improvement on the Current Path forecast.
In the Current Path forecast, GDP per capita increases from U$20 942 in 2019 to US$30 522 in 2043, and to US$31 000 in the Demographic scenario — an improvement of US$478 or 1.6% above the Current Path forecast.
The Current Path forecast is for a modest reduction in rates of extreme poverty with relatively small improvements as a result of the Demographic scenario, probably a result of Equatorial Guinea’s high levels of inequality. Within IFs, 83.2% of Equatorial Guinea’s population (1.094 million people) lived below US$1.90 and 97.8% below US$5.50 in 2019. In the Current Path forecast, 73.3% of the population (1.808 million people) will be in extreme poverty in 2043 using US$1.90, and 95% (2.345 million people) at US$5.50. In the Demographic scenario, extreme poverty declines to 1.761 million people (or 71.4%), using US$1.90. Using the US$5.50 extreme poverty line, the 2043 number is 2.341 million people (94.9%).
This section presents reasonable but ambitious improvements in the Health/WaSH scenario, which include reductions in the mortality rate associated with both communicable diseases (e.g. AIDS, diarrhoea, malaria and respiratory infections) and non-communicable diseases (NCDs) (e.g. diabetes), as well as improvements in access to safe water and better sanitation. The acronym WaSH stands for water, sanitation and hygiene.
The intervention is explained here in the thematic part of the website.
The quality of a nation's health system can be gauged through indicators such as maternal mortality, infant mortality, and life expectancy, among others.
Life expectancy in Equatorial Guinea is low, even below the average for Africa which, in 2019, was 65.8 years. Except for South Africa (as a result of HIV/AIDS), Equatorial Guinea also has the lowest life expectancy globally among upper middle-income countries. In 2019, life expectancy in Equatorial Guinea was 63.8 years and will increase to 71 years by 2043 in the Current Path forecast. In the Health/WaSH scenario it improves to 72.8 years. Average life expectancy among upper middle-income countries globally in 2019 was 76 years and is forecast to be 79.3 years by 2043.
The SDG target for infant mortality is 12 or fewer deaths per 1 000 live births by 2030 (indicator 3.2.2). In 2019, the rate was almost 52 deaths in Equatorial Guinea, significantly higher than any other upper middle-income country in Africa and the 13th highest in Africa. With current policies, Equatorial Guinea would get to 48 in 2030 and 38 in 2043. Under-five mortality in Equatorial Guinea in 2019 at 14.6 deaths per 1 000 live births is, for example, double that of South Africa, the next worse country.
In the Health/WaSH scenario, infant mortality in Equatorial Guinea declines to 32.3 in 2043, an improvement of more than 6% compared to the Current Path forecast.
The Agriculture scenario represents reasonable but ambitious increases in yields per hectare (reflecting better management and seed and fertiliser technology), increased land under irrigation and reduced loss and waste. Where appropriate, it includes an increase in calorie consumption, reflecting the prioritisation of food self-sufficiency above food exports as a desirable policy objective.
The intervention is explained here in the thematic part of the website.
The data on yield per hectare (in metric tons) is for crops but does not distinguish between different categories of crops.
In 2019, crop yields per hectare in Equatorial Guinea was roughly 12% below the average for Africa at 3.5 tons per hectare, forecast to improve to 4.7 tons in 2043. In the Agriculture scenario, yields increase massively by 120% to 10.3 tons per hectare in 2043. In spite of its fertile soils, agriculture makes a small contribution to the economy of Equatorial Guinea. More than 55% of Equatorial Guinea’s land area is covered by forest with only 6.3% (177 000 hectares) used for crops and 3.4% (104 000 hectares) for grazing. The majority of land is used for the cultivation of stable foods such as cassava, sweet potatoes, plantains, groundnuts and bananas.
Within IFs, agriculture contributed 6.9% (US$1.15 billion) to the GDP of Equatorial Guinea in 2019. Other estimates, such as from FAO, have lower estimates, with agriculture contributing only 2% to GDP. In the Current Path forecast, the contribution from agriculture will decline to 2.9% (US$1.6 billion) by 2043, and reach 4.7% (US$2.6 billion) in the Agriculture scenario.
In 2019, Equatorial Guinea imported around 12.5% of its food requirements. In the Current Path forecast that number will increase dramatically to 48.7% in 2043 meaning that Equatorial Guinea will become increasingly food insecure. In the Agriculture scenario, domestic food production increases significantly and import dependence is only at 12.1% in 2043, roughly similar to the situation in 2019.
The Current Path forecast is for a steady reduction in rates of extreme poverty with relatively small improvements as a result of the Agriculture scenario, probably a result of Equatorial Guinea’s high levels of inequality and the small size of its agriculture sector.
In the Current Path forecast, GDP per capita increases from U$20 942 in 2019 to US$30 522 in 2043. The Agriculture scenario increases GDP per capita by about 2.4%, or US$725, above the Current Path forecast to US$31 247 in 2043. This is about US$13 500 lower than the projected average for low-income countries in Africa in 2043.
Because the size of the agriculture sector in Equatorial Guinea is small, the impact of the Agriculture scenario on extreme poverty is low. Within IFs, 83.2% of the population (1.094 million people) lived below US$1.90 and 97.8% below US$5.50 in 2019. In the Current Path forecast, 73.3% of the population (1.808 million people) will be in extreme poverty in 2043 using US$1.90, and 95% (2.345 million people) at US$5.50. In the Agriculture scenario, extreme poverty will decline to 72.6% of the population (1.791 million people) at US$1.90 and to 95% (2.344 million people) at US$5.50 in 2043.
The Education scenario represents reasonable but ambitious improved intake, transition and graduation rates from primary to tertiary levels and better quality of education. It also models substantive progress towards gender parity at all levels, additional vocational training at secondary school level and increases in the share of science and engineering graduates.
The intervention is explained here in the thematic part of the website.
The average years of education of the adult population (aged 15 years and older) is a good indicator of the stock of education in a country.
Equatorial Guinea had the fifth highest mean years of adult education in Africa in 2019, at 9.4 years, but the IFs forecast is for these relatively high rates to decline in the decade ahead as the recent years of slow and declining economic growth has reduced government spending on education. On the Current Path, the country will only get back to its 2019 mean years of adult education by 2037. The Current Path forecast is that Equatorial Guinea will achieve only 9.7 years of mean adult education in 2043.
In 2019, the gap between male and female mean years of education was 2.3 years, forecast to modestly decline to 1.6 years in 2043 in the Current Path forecast.
Equatorial Guinea spends less on education than any other upper middle-income country in Africa. In fact, it is one of the African countries with the lowest expenditure on education as a per cent of GDP in Africa in spite of its oil wealth. In the Education scenario, expenditure on education increases from 2.4% of GDP in 2019 to 4.2% in 2043. The result is that the mean years of adult education increases by almost 6% to 10.2 years in 2043 and the gap between male and female mean years narrows to 1.4 years in 2043.
Quality education is crucial for economic development. It not only allows the country to increase its current added value but also to create tomorrow's technological innovations.
Education quality in Equatorial Guinea is low [1Note that IFs does not have education quality data for Equatorial Guinea and the high quality estimation from the IFs preprocessor that is reflected in Chart 27 is influenced by the country’s status as an upper middle-income country and relatively high GDP per capita.] with overpopulated schools that are understaffed, a lack of quality teachers, lack of learning materials, poor physical conditions, etc. In the Education scenario, the score for the quality of primary education improves from 39.3 out of a possible 100 in 2019 to 42.8 in 2043, a 16% increase compared to the Current Path forecast of 36.8 in the same year. The score for the quality of secondary education increases from 46.7 in 2019 to 52.8 in 2043 in the Education scenario, a 19.7% improvement compared to the Current Path forecast of 44.1 in 2043.
The Education scenario increases GDP per capita by 4.5% above the Current Path forecast in 2043. In the Current Path forecast, GDP per capita increases from U$20 942 in 2019 to US$30 522 in 2043, and to US$31 905 in the Education scenario. Investment in education significantly impacts economic growth, but it takes time to materialise.
Education is one of the important tools to reduce poverty. It improves the employment and income prospects of the proportion of poor people in society.
The Current Path forecast is for a steady reduction in rates of extreme poverty from the current high levels with relatively small improvements as a result of the Education scenario, probably a result of Equatorial Guinea’s high levels of inequality.
Within IFs, 83.2% of Equatorial Guinea’s population (1.094 million people) lived below US$1.90 and 97.8% below US$5.50 in 2019. In the Current Path forecast, 73.3% of the population (1.808 million people) will be in extreme poverty in 2043 using US$1.90, and 95% (2.345 million people) at US$5.50. In the Education scenario in 2043, extreme poverty at US$1.90 will decline to 1.762 million people, equivalent to 71.4% of the population, and at US$5.50 it will decline to 2.339 million people (94.7%).
The Manufacturing/Transfers scenario represents reasonable but ambitious manufacturing growth through greater investment in the economy, investments in research and development, and promotion of the export of manufactured goods. It is accompanied by an increase in welfare transfers (social grants) to moderate the initial increases in inequality that are typically associated with a manufacturing transition. To this end, the scenario improves tax administration and increases government revenues.
The intervention is explained here in the thematic part of the website.
Chart 30 should be read with Chart 8 that presents a stacked area graph on the contribution to GDP and size, in billion US$, of the Current Path economy for each of the sectors.
Similar to most other countries in Africa, low-level services dominate economic activity in Equatorial Guinea, accounting for almost 42% of GDP in 2019, increasing to 50% in 2043.
In absolute terms, the contribution of the service sector to GDP will grow most rapidly in the Manufacturing/Transfers scenario. It is forecast to be US$4.3 billion larger than in the Current Path forecast in 2043. The service sector is followed by the manufacturing sector with an increase in size of US$1.1 billion above the Current Path in 2043. With the exception of the agriculture sector that remains unchanged, all sectors are larger in US$ value in 2043.
In terms of percentage of GDP, the share of the service sector is 2.1 percentage points larger in the Manufacturing/Transfers scenario than in the Current Path forecast in 2043. The contribution of manufacturing increases until 2038 after which it declines below the Current Path forecast, although still much larger in value in 2043. By 2043, the share of manufacturing is 0.7 percentage points lower. Similarly, the share of agriculture in GDP is 0.25 percentage points lower in the scenario than on the Current Path in 2043 (although still roughly at the 2043 Current Path forecast), trends that reflect the structural shifts occurring in Equatorial Guinea’s economy.
In 2019, household transfers amounted to US$111 million in Equatorial Guinea and will increase to US$0.7 billion in 2043 in the Current Path forecast. In the Manufacturing/Transfers scenario, transfers increase to US$1.12 billion, a difference of US$401 million. These transfers address the initial increase in poverty, which is generally associated with the investment in the manufacturing sector. Industrialisation is funded by an initial crunch in consumption which increases poverty in the first few years. However, these efforts stimulate economic growth with greater impact on poverty alleviation in the long term.
The Manufacturing/Transfers scenario increases GDP per capita by US$2 313, or 7.6%, above the Current Path forecast in 2043. GDP per capita was US$20 942 in 2019; on the Current Path it will increase to US$30 522 in 2043, and to US$32 835 in the Manufacturing/Transfers scenario.
Manufacturing is important for economic growth due to its backward and forward linkages with other sectors and its ability to transform the productivity structures across an economy. Thus, a robust manufacturing sector is crucial for sustained growth and significantly improves the living standard of the population.
The Current Path forecast is a steady reduction in rates of extreme poverty with relatively small improvements as a result of the Manufacturing/Transfers scenario, probably a result of Equatorial Guinea’s high levels of inequality.
Within IFs, 83.2% of Equatorial Guinea’s population (1.094 million people) lived below US$1.90 and 97.8% below US$5.50 in 2019. In the Current Path forecast, 73.3% of the population (1.808 million people) will be in extreme poverty in 2043 using US$1.90, and 95% (2.345 million people) at US$5.50. In the Manufacturing/Transfers scenario, extreme poverty will decline to 1.790 million people (72.5% of the population) at US$1.90, and to 3.343 million people (94.9%) at US$5.50 in 2043.
The Leapfrogging scenario represents a reasonable but ambitious adoption of and investment in renewable energy technologies, resulting in better access to electricity in urban and rural areas. The scenario includes accelerated access to mobile and fixed broadband and the adoption of modern technology that improves government efficiency and allows for the more rapid formalisation of the informal sector.
The intervention is explained here in the thematic part of the website.
Fixed broadband includes cable modem Internet connections, DSL Internet connections of at least 256 KB/s, fibre and other fixed broadband technology connections (such as satellite broadband Internet, ethernet local area networks, fixed-wireless access, wireless local area networks, WiMAX, etc.).
Only South Sudan had a lower level of fixed broadband connections per 100 people in Africa than Equatorial Guinea in 2019. The 2019 rate in Equatorial Guinea was 1.3, forecast to rapidly improve to 25.1 in the Current Path forecast in 2043. The 2043 rate doubles in the Leapfrogging scenario to 50 subscriptions per 100 people.
Mobile broadband refers to wireless Internet access delivered through cellular towers to computers and other digital devices.
Similar to fixed broadband, Equatorial Guinea trails in mobile broadband connections. In 2019 it had 6.6 subscribers per 100 people, among the lowest in Africa, but is set to increase very rapidly
although slowing down once rates exceed 80 subscriptions per 100 people. The Current Path forecast is that Equatorial Guinea reaches 138 subscriptions per 100 people in 2043 compared to 141.3 subscriptions in the Leapfrogging scenario. Given the aggressive Current Path forecast, the impact of the Leapfrogging scenario is limited.
Because of its high rates of urbanisation, electricity access in Equatorial Guinea is high, at 68% in 2019, and will increase to 90% in 2043. Access in urban areas, where 75% of the population stays, was more than 88% in 2019, and will increase to 94.5% in 2043. By contrast, rural electricity access was below 10% in 2019. In the Current Path forecast, rural electricity access will increase to 55% in 2043.
In the Leapfrogging scenario, electricity access in rural Equatorial Guinea will increase to 69.9% in 2043 and to 96.6% in urban Equatorial Guinea. As a result, total electricity access will improve to 93.5%.
Widespread access to electricity and high-speed Internet has the potential to improve a country's socio-economic outcomes. Broadband can increase productivity, reduce transaction costs and optimise supply chains, positively affecting economic growth.
The Leapfrogging scenario increases GDP per capita by 5.7% or US$1 737 above the Current Path forecast in 2043 to US$32 264. In the Current Path forecast, GDP per capita increases from U$20 942 in 2019 to US$30 522 in 2043.
The Current Path forecast is a steady reduction in rates of extreme poverty with relatively small improvements as a result of the Leapfrogging scenario, probably due to Equatorial Guinea’s high levels of inequality. A high level of income inequality reduces the poverty-reducing effect of economic growth.
Within IFs, 83.2% of Equatorial Guinea’s population (1.094 million people) lived below US$1.90 and 97.8% below US$5.50 in 2019. In the Current Path forecast, 73.3% of the population (1.808 million people) will be in extreme poverty in 2043 using US$1.90, and 95% (2.345 million people) at US$5.50. In the Leapfrogging scenario, extreme poverty will decline to 1.766 million people (71.6% of the population) at US$1.90, and to 2.332 million people (94.5%) at US$5.50 in 2043.
The Free Trade scenario represents the impact of the full implementation of the African Continental Free Trade Area (AfCFTA) by 2034 through increases in exports, improved productivity and increased trade and economic freedom.
The intervention is explained here in the thematic part of the website.
The trade balance is the difference between the value of a country's exports and its imports. A country that imports more goods and services than it exports in terms of value has a trade deficit, while a country that exports more goods and services than it imports has a trade surplus.
Crude petroleum exports and gas dominate Equatorial Guinea’s exports, with more than a third of its exports going to China, followed by Spain, Portugal and India. Imports are dominated by scrap vessels.
In recent years, the country has consistently experienced a negative trade balance. As the Free Trade scenario boosts manufacturing, services and agriculture exports, the impact of the scenario is modest given the much larger value of its oil and gas exports, improving its trade balance by up to 1% of GDP across the forecast horizon, but often less. Over time, the value of Equatorial Guinea’s energy exports will decline without the discovery of additional oil and gas reserves.
The Free Trade scenario increases the value of manufacturing exports by 9.7 percentage points. Whereas exports were at 47.4% of GDP in 2019, they improve to 49.3% by 2043 in the Current Path forecast and to 56.7% of GDP in the Free Trade scenario. On the other hand, imports, at 56.2% of GDP in 2019, increase by 8 percentage points above the Current Path forecast by 2043.
The Free Trade scenario increases GDP per capita by 6.6% above the Current Path forecast in 2043, reflecting the large, positive impact that the implementation of the AfCFTA could have. Generally, trade liberalisation improves productivity through competition and technology diffusion, stimulating growth and raising income levels. In the Current Path forecast, GDP per capita increases from U$20 942 in 2019 to US$30 522 in 2043, and to US$32 528 in the Free Trade scenario.
The Current Path forecast is for a steady reduction in rates of extreme poverty with relatively small improvements as a result of the Free Trade scenario, probably a result of Equatorial Guinea’s high levels of inequality.
Within IFs, 83.2% of the population (1.094 million people) lived below US$1.90 and 97.8% below US$5.50 in 2019. In the Current Path forecast, 73.3% of the population (1.808 million people) will be in extreme poverty in 2043 using US$1.90, and 95% (2.345 million people) at US$5.50. In the Free Trade scenario, extreme poverty will decline to 1.75 million people (70.9% of the population) at US$1.90, and to 2.325 million (94.3%) at US$5.50 in 2043.
The Financial Flows scenario represents a reasonable but ambitious increase in worker remittances and aid flows to poor countries, and an increase in the stock of foreign direct investment (FDI) and additional portfolio investment inflows to middle-income countries. We also reduced outward financial flows to emulate a reduction in illicit financial outflows.
The intervention is explained here in the thematic part of the website.
Because of its status as an upper middle-income country, its dependence on oil and gas exports as well as concerns about corruption, human rights and poor governance, Equatorial Guinea gets very little aid. In 2019, it received US$14 million in aid (0.08% of GDP), which will increase to US$26 million in 2043 (0.05% of GDP). In the Financial Flows scenario, foreign aid declines to US$23 million (0.04% of GDP). Equatorial Guinea gains more FDI than aid.
FDI to Equatorial Guinea is small and almost entirely directed at oil and gas exploration. The country embarked on an ambitious scheme to attract additional investment in this sector that preceded the Russian invasion of Ukraine. In 2019, Equatorial Guinea received 1.8% of GDP in FDI (US$303 million), which will increase to 11.6% of GDP in 2043 (US$6.2 billion). In the Financial Flows scenario, FDI inflows increase to 13.7% of GDP in 2043 (US$7.7 billion).
Remittance flows to Equatorial Guinea are minimal. Rather than a recipient, Equatorial Guinea is a source of around US$1 million net remittance outflows that will increase to US$5 million in 2043. The Financial Flows scenario slightly increases remittance outflows.
The Financial Flows scenario increases GDP per capita by 2.9% above the Current Path forecast in 2043. In the Current Path forecast, GDP per capita increases from U$20 942 in 2019 to US$30 522 in 2043, and to US$31 392 in the Financial Flows scenario.
Trade openness will reduce poverty in the long term after initially increasing it due to the redistributive effects of trade. Most African countries export primary commodities and low-tech manufacturing products, and therefore a continental free trade agreement (AfCFTA) that reduces tariffs and non-tariff barriers across Africa will increase competition among countries in primary commodities and low-tech manufacturing exports. Countries with inefficient, high-cost manufacturing sectors might be displaced as the AfCFTA is implemented, thereby pushing up poverty rates. In the long term, as the economy adjusts and produces and exports its comparatively advantaged (lower relative cost) goods and services, poverty rates will decline.
The Current Path forecast is for a steady reduction in rates of extreme poverty with relatively small improvements as a result of the Financial Flows scenario, probably a result of Equatorial Guinea’s high levels of inequality. In addition, the largest benefit in this scenario follows inflows of FDI, with little or no benefit flowing to poor people. This is because FDI is concentrated in the oil sector, which does not have strong forward and backward linkages to other sectors of the economy.
Within IFs, 83.2% of Equatorial Guinea’s population (1.094 million people) lived below US$1.90 and 97.8% below US$5.50 in 2019. In the Current Path forecast, 73.3% of the population (1.808 million people) will be in extreme poverty in 2043 using US$1.90, and 95% (2.345 million people) at US$5.50. In the Financial Flows scenario, extreme poverty will decline to 1.792 million people at US$1.90, and to 2.34 million people (94.8%) at US$5.50 in 2043.
The Infrastructure scenario represents a reasonable but ambitious increase in infrastructure spending across Africa, focusing on basic infrastructure (roads, water, sanitation, electricity access and ICT) in low-income countries and increasing emphasis on advanced infrastructure (such as ports, airports, railway and electricity generation) in higher-income countries.
Note that health and sanitation infrastructure is included as part of the Health/WaSH scenario and that ICT infrastructure and more rapid uptake of renewables are part of the Leapfrogging scenario. The interventions there push directly on outcomes, whereas those modelled in this scenario increase infrastructure spending, indirectly boosting other forms of infrastructure, including those supporting health, sanitation and ICT.
The intervention is explained here in the thematic part of the website.
In 2019, 68.1% of the population in Equatorial Guinea had access to electricity; this figure will increase to 89.9% in 2043. In the Infrastructure scenario, however, it increases to 93.5% in 2043. Much of that improvement is due to the rapid increase in rural electricity access which improves from 9.9% in 2019 to 70% in 2043 as opposed to 55% in the Current Path forecast.
In the Infrastructure scenario, by 2043, it is projected that 96.6% of the urban population in Equatorial Guinea will have access to electricity compared to 94.5% in the Current Path forecast. In the Infrastructure scenario and the Current Path forecast, respectively, 69.9% (200 000 people) and 55% (160 000 people) of rural population will have access to electricity in 2043, indicating the disparity in access to electricity between the urban and rural population in the country.
Indicator 9.1.1 in the Sustainable Development Goals refers to the proportion of the rural population who live within 2 km of an all-season road and is captured in the Rural Access Index.
Accessibility to rural areas spurs socio-economic development and improves the rural population’s living standards as better rural roads facilitate trade between rural and urban areas. For instance, they enable the rural population to enjoy products from nearby urban areas while allowing the urban population to more easily access agricultural products supplied by rural areas.
In 2019, less than a third of Equatorial Guinea’s population lived in rural areas, and the portion will decline to 11.4% in 2043. Data on rural road access for Equatorial Guinea is unreliable but within IFs is among the highest in Africa. In 2019, 95.8% of the rural population in Equatorial Guinea resided within 2 km from an all-weather road; this is above the average of 83.5% for upper middle-income African countries. In the Infrastructure scenario, it is projected to increase to 100% by 2043, on par with the Current Path forecast for that year. The Infrastructure scenario therefore has a marginal impact due to the aggressive Current Path forecast.
The Infrastructure scenario increases GDP per capita by 5.7% above the Current Path forecast in 2043. In the Current Path forecast, GDP per capita increases from U$20 942 in 2019 to US$30 522 in 2043, and to US$32 260 in the Infrastructure scenario.
The Current Path forecast projects a steady reduction in rates of extreme poverty with relatively small improvements as a result of the Infrastructure scenario, probably due to Equatorial Guinea’s high levels of inequality.
Within IFs, 83.2% of Equatorial Guinea’s population (1.094 million people) lived below US$1.90 and 97.8% below US$5.50 in 2019. In the Current Path forecast, 73.3% of the population (1.808 million people) will be in extreme poverty in 2043 using US$1.90, and 95% (2.345 million people) at US$5.50. In the Infrastructure scenario, extreme poverty will decline to 1.966 million people (71.6% of the population) at US$1.90, and to 2.332 million (94.5%) at US$5.50 in 2043.
The Governance scenario represents a reasonable but ambitious improvement in accountability and reduces corruption, and hence improves the quality of service delivery by government.
The intervention is explained here in the thematic part of the website.
As defined by the World Bank, government effectiveness ‘captures perceptions of the quality of public services, the quality of the civil service and the degree of its independence from political pressures, the quality of policy formulation and implementation, and the credibility of the government’s commitment to such policies’.
Chart 51 presents the impact of the interventions in the Governance scenario on government effectiveness.
Equatorial Guinea has among the worst human rights records in Africa, indeed globally. The country is effectively a family business. The 1982 constitution grants extensive powers to President Teodora Obiang, who essentially rules by decree. A new constitution approved in 2011, provided for two seven-year terms for the president, already in power since 1979, and is not retroactive. Nominally a multiparty democracy, elections are generally considered to be a sham with President Obiang’s Partido Democrático de Guinea Ecuatorial (PDGE) holding 99 out of 100 seats in the Chamber of Deputies and all the seats in the Senate. The country regularly features close to the bottom of indices such as those of Transparency International on their Corruption Perception Index. In 2019, Equatorial Guinea ranked 51st lowest out of 54 African countries on the combined Polity IV democracy/autocracy index. That year Equatorial Guinea was also ranked 49th out of 54 African countries on the World Bank government effectiveness index, just ahead of Eritrea. The IFs forecast is, however, for an improvement in effectiveness to 36th position in Africa by 2043. The Governance scenario would improve government effectiveness score by a further 5% compared to the Current Path forecast in the same year
Equatorial Guinea, however, does well on the Fraser Institute’s index of economic freedom, with the sixth highest score in Africa in 2019, and is actively working to improve the investment climate. Ostensibly boasting an open investment regime, the business climate in Equatorial Guinea is challenging.
The Governance scenario increases GDP per capita by 2.7% above the Current Path forecast in 2043. In the Current Path forecast, GDP per capita increases from U$20 942 in 2019 to US$30 522 in 2043, and to US$31 352 in the Governance scenario.
The Current Path forecast projects a steady reduction in rates of extreme poverty with relatively small improvements as a result of the Governance scenario, probably due to Equatorial Guinea’s high levels of inequality.
Within IFs, 83.2% of Equatorial Guinea’s population (1.094 million people) lived below US$1.90 and 97.8% below US$5.50 in 2019. In the Current Path forecast, extreme poverty in 2043 will be 73.3% (1.808 million people) using US$1.90, and 95% (2.345 million people) at US$5.50. In the Governance scenario, extreme poverty will decline to 1.79 million people (72.5% of the total population) at US$1.90, and to 2.34 million people (94.8%) at US$5.50 in 2043.
This section presents projections for carbon emissions in the Current Path for Equatorial Guinea and the 11 scenarios. Note that IFs uses carbon equivalents rather than CO2 equivalents.
Because of its large forest area, Equatorial Guinea’s net carbon emissions are low, and, because of the recent contraction in economic growth, will only recover to their 2019 levels around 2030 in all scenarios. In 2019, Equatorial Guinea emitted 438 000 tons of carbon and will emit 2.17 million tons in 2043. The Manufacturing/Transfers scenario will result in the highest emissions in 2043 (at 2.62 million tons of carbon), followed by the Free Trade scenario (at 2.56 million tons) and the Infrastructure scenario (at 2.52 million tons). Because of the smaller population that accompanies the Demographic scenario, carbon emissions in that scenario are below the Current Path forecast in 2043.
The Combined Agenda 2063 scenario consists of the combination of all 11 sectoral scenarios presented above, namely the Stability, Demographic, Health/WaSH, Agriculture, Education, Manufacturing/Transfers, Leapfrogging, Free Trade, Financial Flows, Infrastructure and Governance scenarios. The cumulative impact of better education, health, infrastructure, etc. means that countries get an additional benefit in the integrated IFs forecasting platform that we refer to as the synergistic effect. Chart 55 presents the contribution of each of these 12 components to GDP per capita in the Combined Agenda 2063 scenario as a stacked area graph.
In 2019, GDP per capita for Equatorial Guinea was US$20 942, increasing to US$30 522 in 2043 in the Current Path forecast. The synergistic effect of all the scenarios on the GDP per capita is US$5 488 in 2043.The Manufacturing/Transfers scenario has the largest impact on GDP per capita by 2043: it increases GDP per capita by 7.6% above the Current Path forecast to US$32 835. It is followed by the Free Trade scenario (US$32 528) and the Infrastructure scenario (US$32 259). The Demographic scenario sees the smallest increase in GDP per capita of 1.6% above the Current Path forecast to US$30 999.
These findings reveal that manufacturing, the full implementation of the AfCFTA, and infrastructure development have the potential to improve human and economic development the most in Equatorial Guinea.
Whereas Chart 55 presents a stacked area graph on the contribution of each scenario to GDP per capita as well as the additional benefit or synergistic effect, Chart 56 presents only the GDP per capita in the Current Path forecast and the Combined Agenda 2063 scenario.
In the Current Path forecast, GDP per capita increases from U$20 942 in 2019 to US$30 522 in 2043. In the Combined Agenda 2063, GDP per capita will be US$49 924, almost 64% higher than the Current Path forecast in 2043. The Combined Agenda 2063 scenario is a scenario where the government of Equatorial Guinea makes a concerted effort to remove the binding constraints to inclusive growth and development.
The Current Path forecast is for a steady reduction in rates of extreme poverty with below expected improvements as a result of the Combined Agenda 2063 Stability scenario, probably due to Equatorial Guinea’s high levels of inequality.
Within IFs, 83.2% of Equatorial Guinea’s population (1.094 million people) lived below US$1.90 and 97.8% below US$5.50 in 2019. In the Current Path forecast, 73.3% of the population (1.808 million people) will be in extreme poverty in 2043 using US$1.90, and 95% (2.345 million people) at US$5.50. In the Combined Agenda 2063 scenario, extreme poverty declines to 1.434 million people (using US$1.90). Instead of an extreme poverty rate of 73.3% in 2043, Equatorial Guinea will only have 60% of its population in extreme poverty. Using US$5.50, the difference is almost five percentage points (90.6% compared to 95%). The Free Trade scenario has the largest effect on extreme poverty as by 2043 it will reduce the number of extremely poor people in Equatorial Guinea to 1.75 million (or 70.9% of the population) using US$1.90, and to 2.325 million (94.3%) using US$5.50. The Demographic scenario is second in impact.
See <Chart 8> to view the Current Path forecast of the sectoral composition of the economy.
In 2043, all six economic sectors will be larger than they were in 2019. In absolute terms, the contribution of the service sector to GDP will experience the largest improvement compared to the Current Path forecast by US$26.4 billion by 2043. The service sector is followed by the manufacturing and ICT sectors, with their contributions to GDP in the scenario respectively US$4.6 billion and US$4.1 billion larger than the Current Path forecast.
As a percentage of GDP, the contribution of the service sector in the Combined Agenda 2063 scenario is 7.5 percentage points larger than the Current Path forecast for 2043 while the contribution of the manufacturing sector in the Combined Agenda 2063 is 5.7 percentage points lower than the Current Path forecast.
Going forward, the service sector will be the dominant sector of Equatorial Guinea’s economy, but the manufacturing sector will grow appreciably in the Combined Agenda 2063 scenario.
In the Combined Agenda 2063 scenario, the economy of Equatorial Guinea will be 72% larger in 2043 when compared to the Current Path forecast. In 2019, the size of its economy was US$16.78 billion and will grow to US$53.83 billion in 2043 on the Current Path forecast. Instead, in the Combined Agenda 2063 scenario it will be US$92.5 billion.
The Combined Agenda 2063 scenario shows the benefit of policy push across all development sectors in achieving sustained growth in Equatorial Guinea.
Because of its large forest area, Equatorial Guinea’s net carbon emissions are low. Due to the recent contraction in economic growth, its carbon emissions will only recover to their 2019 levels around 2030 in the Current Path forecast. In 2019, Equatorial Guinea emitted 438 000 tons of carbon and will emit 2.17 million tons in the Current Path forecast in 2043. In the Combined Agenda 2063 scenario, emissions will increase to 5.3 million tons in 2043, an increase of almost 150%.
Endnotes
Note that IFs does not have education quality data for Equatorial Guinea and the high quality estimation from the IFs preprocessor that is reflected in Chart 27 is influenced by the country’s status as an upper middle-income country and relatively high GDP per capita.
Page information
Contact at AFI team is Jakkie Cilliers
This entry was last updated on 31 May 2026 using IFs v7.63.
Donors and sponsors


Reuse our work
- All visualizations, data, and text produced by African Futures are completely open access under the Creative Commons BY license. You have the permission to use, distribute, and reproduce these in any medium, provided the source and authors are credited.
- The data produced by third parties and made available by African Futures is subject to the license terms from the original third-party authors. We will always indicate the original source of the data in our documentation, so you should always check the license of any such third-party data before use and redistribution.
- All of our charts can be embedded in any site.
Cite this research
Jakkie Cilliers (2026) Equatorial Guinea Development Futures. Published online at futures.issafrica.org. Retrieved from https://futures.issafrica.org/geographic/countries/equatorial-guinea/ [Online Resource] Updated 31 May 2026.