 Central African Republic
Feedback welcome
Our aim is to use the best data to inform our analysis. See our Technical page for information on the IFs forecasting platform. We appreciate your help and references for improvements via our feedback form.
Please note: This country report was developed using African Futures’ previous analytical framework, which organised the assessment across 11 sectoral scenarios. We have since updated and streamlined the analytical architecture to 8 sectoral scenarios. While the two frameworks remain broadly aligned, the current structure improves consistency, comparability and integration across themes and geographic studies. This page will therefore be updated to the current framework in due course. Read more about our analytical framework on the Technical Page.
In this entry, we first describe the Current Path (CP) forecast for the Central African Republic as it is expected to unfold to 2043, the end of the third ten-year implementation plan of the African Union’s Agenda 2063 long-term vision for Africa. The Current Path in the International Futures (IFs) forecasting model initialises from country-level data that is drawn from a range of data providers. We prioritise data from national sources.
The Current Path forecast is divided into summaries on demographics, economics, poverty, health/WaSH and climate change/energy. A second section then presents a single positive scenario for potential improvements in stability, demographics, health/WaSH, agriculture, education, manufacturing/transfers, leapfrogging, free trade, financial flows, infrastructure, governance and the impact of various scenarios on carbon emissions. With the individual impact of these sectors and dimensions having been considered, a final section presents the impact of the Combined Agenda 2063 scenario.
We generally review the impact of each scenario and the Combined Agenda 2063 scenario on gross domestic product (GDP) per person and extreme poverty except for Health/WaSH that uses life expectancy and infant mortality.
The information is presented graphically and supported by brief interpretive text.
All US$ numbers are in 2017 values.
Executive Summary
- Current Path forecast
- The Central African Republic is a landlocked country in West Africa with a population of 4.8 million people. With a GDP per capita (PPP) of US$843 in 2019, the Central African Republic is classified as one of the world’s least developed countries. In 2019, it ranked second to last globally after Burundi and last on the United Nations Human Development Index (HDI). Close to three-quarters of the population live in extreme poverty (73.9%), and the country is experiencing high levels of violent conflict. In 2019, life expectancy in the Central African Republic at 51.22 years was the lowest in the world and over a decade lower than in the average African low-income economy. This is mostly the result of an exceptionally high communicable-disease burden. Jump to Current Path forecast
- The Central African Republic is projected to continue recording fast population growth with its population increasing by about 75%, reaching 8.4 million people in 2043. The country will remain predominantly rural with its urbanisation rate dropping from 39.8% in 2019 to about 37.6% in 2043 and the share of the population living in rural areas increasing from 60.3% to 62.4% over the same time period. Jump to Demographics: Current Path
- In the Current Path forecast, the Central African Republic is expected to experience economic growth and roughly triple its GDP (MER) from US$2.2 billion to US$6.4 billion in 2043, and increase its GDP per capita from US$843 in 2019 to US$1 516 by 2043 but remains far below the average of its low-income peer group on the continent at US$3 790. Jump to Economics: Current Path
- The poverty rate in the Central African Republic is projected to decrease from 73.9% in 2019 to 68.3% in 2043. The number of people living in extreme poverty will increase from 3.6 million to 7.7 million people. Jump to Poverty: Current Path
- Carbon emissions are forecast to increase ninefold to 900 000 tons of carbon by 2043. Jump to Carbon emissions/Energy: Current Path
- Sectoral scenarios:
- The Stability scenario has the potential to raise the Central African Republic’s score on governance security index from 0.58 to 0.79 by 2043. The scenario also has the potential to accelerate poverty reduction and reduce the share of the population living below US$1.90 by 1.4 percentage points to 65.9%. Jump to Stability scenario
- The interventions in the Demographic scenario will speed up the ratio of working-age population to dependants from 1.16 in 2019 to 1.7 in 2043 and reduce infant mortality rate from 81 deaths per 1000 live births in 2019 to 27.3 deaths in 2043. Jump to Demographic scenario
- The Health/WaSH scenario has the potential to increase life expectancy in the Central African Republic from 51.22 years in 2019 to 61.4 years in 2043 versus 60.4 years in the Current Path forecast. It will also lead to a reduction in infant mortality rate from 81 deaths per 1 000 live births in 2019 to 30.7 deaths in 2043. Jump to Health/WaSH scenario
- The Agriculture scenario has the potential to increase production to meet the rapid increase in demand fuelled by population growth. By 2043, yield per hectare will increase from 1.5 metric tons in 2019 to 3.5 metric tons and net agricultural imports will account for 10.5% of demand instead of 39.3% on the Current Path. Jump to Agriculture scenario
- The Education scenario raises mean years of education from 4.2 years in 2019 to 6.2 years in 2043 and improves average test scores for primary and secondary learners by 5 and 10 percentage points, respectively. The scenario only translates into a modest increase in Central African Republic’s GDP per capita: US$1 613 versus US$1 516 on the Current Path. Jump to Education scenario
- In the Manufacturing/Transfers scenario, the manufacturing sector is forecast to experience the largest long-term gain in terms of its relative contribution to GDP (by 0.56 percentage points in 2043). Jump to Manufacturing/Transfers scenario
- The Leapfrogging scenario will accelerate access to electricity and push access rates from 26.2% to 62.8% by 2043 compared to 58.1% in the Current Path forecast. The scenario will also raise fixed and mobile broadband subscriptions to 50 and 118 subscriptions per 100 people in 2043. Jump to Leapfrogging scenario
- In the Free Trade scenario, GDP per capita is expected to increase from US$843 in 2019 to US$1 720, compared to US$1 516 on the Current Path. Jump to Free Trade scenario
- In the Financial Flows scenario, FDI as a share of GDP is projected to recover and slightly surpass pre-pandemic levels accounting for 3.7% of GDP in 2043 versus 3.2% on the Current Path. Jump to Financial Flows scenario
- The Infrastructure scenario would improve electricity access rates from 26.2% in 2019 to 70% in 2043 versus 58.1% on the Current Path. Jump to Infrastructure scenario
- In the Governance scenario, the score of governance effectiveness will improve to 1.48 by 2043 and the share of the population living below the poverty line will reduce to 67% by 2043 versus 68.3% in the Current Path forecast. Jump to Governance scenario
- Combined Agenda 2063 scenario Jump to Combined Agenda 2063 scenario
- The Combined Agenda 2063 scenario sees increased carbon emissions of 1.2 million tons, 12 times the volume of emission in 2019 and 0.3 million tons more than in the Current Path forecast, as well as a significant increase in the Central African Republic’s GDP per capita in 2043 which could reach US$2 702, about 70% higher than on the Current Path. The scenario brings the Central African Republic closer to eliminating extreme poverty by 2043: 5.1% of the population (1.79 million people) is expected to live below the US$1.90 poverty line versus 68.3% (3.56 million people) in the Current Path forecast. The Central African Republic’s economy will be valued at US$13.6 billion by 2043, more than twice as large as on the Current Path.
All charts for Central African Republic Development Futures
- Chart 1: Political map of Central African Republic
- Chart 2: Population structure in CP, 1990–2043
- Chart 3: Urban and rural population in CP, 1990–2043
- Chart 4: Population density map for 2019
- Chart 5: GDP in CP, 1990–2043
- Chart 6: GDP per capita in CP, 1990–2043
- Chart 7: Informal sector value in CP, 2015–2043
- Chart 8: Value added by sector in CP, 2015–2043
- Chart 9: Agriculture production/demand in CP, 1990–2043
- Chart 10: Poverty in CP, 2015–2043
- Chart 11: Energy production by type in CP, 1990–2043
- Chart 12: Carbon emissions in CP, 1990–2043
- Chart 13: Governance security in CP and Stability scenario, 2019–2043
- Chart 14: GDP per capita in CP and Stability scenario, 2019–2043
- Chart 15: Poverty in CP and Stability scenario, 2019–2043
- Chart 16: Demographic dividend in CP and Demog scenario, 2019–2043
- Chart 17: Infant mortality in CP and Demog scenario, 2019–2043
- Chart 18: GDP per capita in CP and Demog scenario, 2019–2043
- Chart 19: Poverty in CP and Demog scenario, 2019–2043
- Chart 20: Life expectancy in CP and Health/WaSH scenario, 2019–2043
- Chart 21: Infant mortality in CP and Health/WaSH scenario, 2019–2043
- Chart 22: Yield/hectare in CP and Agric scenario, 2019–2043
- Chart 23: Agriculture imports in CP and Agric scenario, 2019–2043
- Chart 24: GDP per capita in the CP and Agric scenario, 2019–2043
- Chart 25: Poverty in CP and Agric scenario, 2019–2043
- Chart 26: Mean years of education in CP and Educ scenario, 2019–2043
- Chart 27: Education quality in CP and Educ scenario, 2019–2043
- Chart 28: GDP per capita in CP and Educ scenario, 2019–2043
- Chart 29: Poverty in CP and Educ scenario, 2019–2043
- Chart 30: Value added by sector in CP and Manufac/Transfers scenario, 2019–2043
- Chart 31: Gov welfare transfers in CP and Manufac/Transfers scenario, 2019–2043
- Chart 32: GDP per capita in CP and Manufac/Transfers scenario, 2019–2043
- Chart 33: Poverty in CP and Manufac/Transfers scenario, 2019–2043
- Chart 34: Fixed broadband access in CP and Leapfrogging scenario, 2019–2043
- Chart 35: Mobile broadband access in CP and Leapfrogging scenario, 2019–2043
- Chart 36: Electricity access in CP and Leapfrogging scenario, 2019–2043
- Chart 37: GDP per capita in CP and Leapfrogging scenario, 2019–2043
- Chart 38: Poverty in CP and Leapfrogging scenario, 2019–2043
- Chart 39: Trade balance in CP and Free Trade scenario, 2019–2043
- Chart 40: GDP per capita in CP and Free Trade scenario, 2019–2043
- Chart 41: Poverty in CP and Free Trade scenario, 2019–2043
- Chart 42: Foreign aid in CP and Financial Flows scenario, 2019–2043
- Chart 43: Inflow of FDI in CP and Financial Flows scenario, 2019–2043
- Chart 44: Remittances in CP and Financial Flows scenario, 2019–2043
- Chart 45: GDP per capita in CP and Financial Flows scenario, 2019–2043
- Chart 46: Poverty in CP and Financial Flows scenario, 2019–2043
- Chart 47: Electricity access in CP and Infrastructure scenario, 2019–2043
- Chart 48: Rural road access in CP and Infrastructure scenario, 2019–2043
- Chart 49: GDP per capita in CP and Infrastructure scenario, 2019–2043
- Chart 50: Poverty in CP and Infrastructure scenario, 2019–2043
- Chart 51: Gov effectiveness in CP and Governance scenario, 2019–2043
- Chart 52: GDP per capita in CP and Governance scenario, 2019–2043
- Chart 53: Poverty in CP and Governance scenario, 2019–2043
- Chart 54: Carbon emissions in CP and scenarios, 2019–2043
- Chart 55: GDP per capita in CP and scenarios, 2019–2043
- Chart 56: GDP per capita in CP and Combined scenario, 2019–2043
- Chart 57: Poverty in CP and Combined scenario, 2019–2043
- Chart 58: Value added by sector in CP and Combined scenario, 2019–2043
- Chart 59: GDP in CP and Combined scenario, 2019–2043
- Chart 60: Carbon emissions in CP and Combined scenario, 2019–2043


Central African Republic Development Futures: Current Path
Download to pdfThis page provides an overview of the key characteristics of the Central African Republic along its likely (or Current Path) development trajectory. The Current Path forecast from the International Futures forecasting (IFs) platform is a dynamic scenario that imitates the continuation of current policies and environmental conditions. The Current Path is therefore in congruence with historical patterns and produces a series of dynamic forecasts endogenised in relationships across crucial global systems. We use 2019 as a standard reference year and the forecasts generally extend to 2043 to coincide with the end of the third ten-year implementation plan of the African Union’s Agenda 2063 long-term development vision.
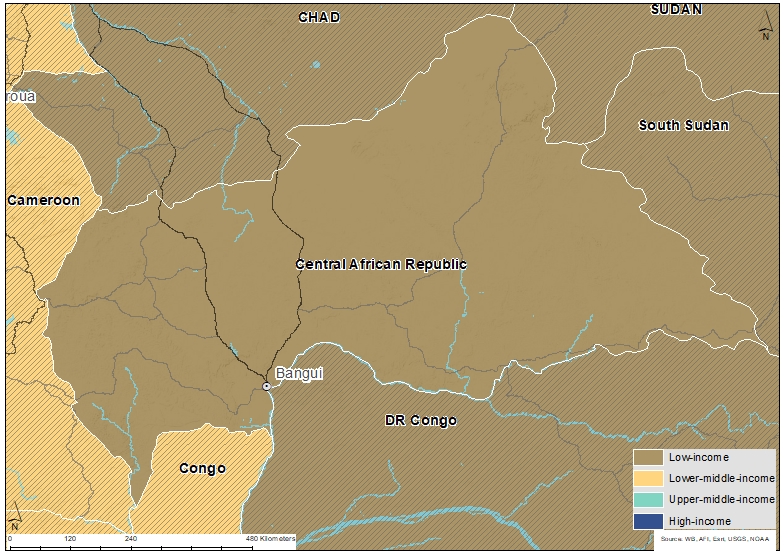
The Central African Republic is a landlocked country in Central Africa. It borders Chad to the north, Sudan to the north-east, South Sudan to the south-east, the Democratic Republic of the Congo to the south, the Republic of the Congo to the south-west, and Cameroon to the west.
The Central African Republic covers a land area of approximately 620 000 km2. As of 2018, the country had an estimated population of around 4.8 million people. Most of the Central African Republic consists of Sudano-Guinean savannas, but the country also has a Sahelo-Sudanian zone in the north and an equatorial forest zone in the south. Two-thirds of the country lies within the Ubangi River basin that flows into the Congo. The other third is located in the basin of the Chari which flows into Lake Chad.
The country's current borders were drawn by France during colonial times. The Central African Republic was a French colony from the late 19th century and only gained independence in 1960. Since then, the country has been ruled by a series of autocratic leaders. The first multiparty democratic elections took place in 1993. Ange-Félix Patassé became president, but was later removed by General François Bozizé in the 2003 coup. The Central African Republic Bush War began in 2004 and, despite several attempts to implement peace treaties (in 2007 and in 2011), civil war resumed in 2012.
The Central African Republic is a resource-rich country with significant mineral deposits and other resources, such as uranium reserves, crude oil, gold, diamonds, cobalt, lumber, and hydropower. It also has significant quantities of arable land. Regardless, as of 2019, the country ranks last in the United Nations Human Development Index (HDI).
The Central African Republic is a member of the United Nations, the African Union, the Economic Community of Central African States, the Organisation Internationale de la Francophonie and the Non-Aligned Movement.
The country is divided into 16 administrative prefectures which are divided into 71 sub-prefectures. It is ethnically very diverse with multiple languages being spoken. The largest ethnic groups are the Baggara Arabs, Baka, Banda, Bayaka, Fula, Gbaya, Kara, Kresh, Mbaka, Mandja, Ngbandi, Sara, Vidiri, Wodaabe, Yakoma, Yulu and Zande.
The Central African Republic has a young and fast-growing population. Coming from a baseline of about 2.8 million people in 1990, by 2019 its population had increased to 4.7 million people — an increase of more than 70%. Over the coming two decades, the country’s population is expected to increase by another 75%, reaching 8.4 million people in 2043. In 2019, the average yearly population growth rate stood at 2.1%, which is rather low compared to its low-income peer economies on the continent. In fact, the Central African Republic had the third lowest population growth rate in that group in 2019.
The Central African Republic’s population is young with a youth bulge of 52.7% in 2019. The country’s median age is 17.6 which is in line with the average median age of 17.9 years for the group of Africa’s low-income economies. In 2019, 43.4% of it was younger than 15 years old. The youthful population can be a powerful source for economic growth in the Central African Republic if it is educated, trained and adequate employment opportunities are created. However, it can also worsen the already existing instability in the country, especially when the youth are unemployed, idle or unskilled.
On the Current Path, the Central African Republic’s demographic structure is expected to change only slowly. Total fertility stood at 4.7 births per woman in 2019, slightly below the average of 4.96 for its low-income peer group. By 2043, the country’s fertility rate is expected to drop to 3.2 births per woman. As a consequence, the median age is projected to increase to 21.2 years, the seventh highest out of 23 African low-income economies. Also, the share of the working-age population will increase from 54% in 2019 to 58% in 2043 on the Current Path, although its aged population remains static at 3% over the forecast period.
By 2043, the country’s working-age population is expected to account for about 60.6% of the population compared to 54% in 2019. Indeed, the ratio of people of working age relative to the dependent population is improving but not fast enough. On the Current Path, the Central African Republic is expected to reach the peak of its demographic ‘sweet spot’ only from 2063 (from 1.17 in 2019 to 2.1 in 2063), more or less in line with the average of its low-income peer group and at the global bottom.
The Central African Republic is predominantly rural although less so than many of its low-income peer economies. In 2019, 60% of its population lived in rural areas as opposed to the 63.2% in 1990, signifying slower urbanisation. The country is above the average for Africa’s low-income countries with a rural–urban split of 69% versus 31% in 2019. On the Current Path, the Central African Republic’s rate of urbanisation will increase to 37.6% by 2043 slightly below the average of 40.7% for low-income countries in Africa. The slow urbanisation in the country can be attributed to the recurring cycle of violence and instability in the country that has so far displaced about 630 834 people with over 600 000 people fleeing to neighbouring countries as refugees.
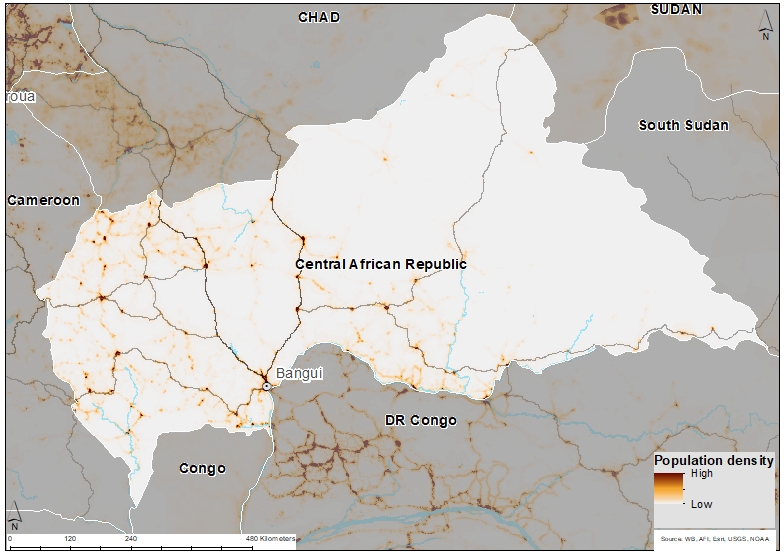
Population density of 0.77 people per hectare in the Central African Republic was only higher than Mauritania, Botswana, Libya and Namibia in Africa in 2019. The majority of the population of 4.8 million people lives in the country’s rural areas, with the most important agricultural areas being Bossangoa and Bambari. Bangui, Berbérati, Bangassou and Bossangoa are the most densely populated urban centres. The capital city, Bangui, is situated on the southern border. Bimo and Berbérati are the second and third largest towns, respectively.
The Central African Republic is one of the smallest economies in Africa. Economic growth has fluctuated in the past due to the recurring conflict. The country’s economy is primarily based on subsistence farming.
In 2019, the Central African Republic’s GDP stood at US$2.2 billion, and the country ranks 21st out of 23 African low-income economies, only bigger than Sudan and Ethiopia. On the Current Path, the Central African Republic’s GDP is forecast to be US$6.4 billion in 2043, almost three times as large as in 2019. In other words, the economy is expected to expand, but this expansion will be insufficient to allow for significant progress in human development.
Although many of the charts in the sectoral scenarios also include GDP per capita, this overview is an essential point of departure for interpreting the general economic outlook of the Central African Republic.
In 2019, at a value of US$843, the Central African Republic’s GDP per capita ranked second to last out of 23 African low-income economies. Only Burundi in East Africa had a lower GDP per capita. On the Current Path, the Central African Republic’s per capita income is expected to increase to US$1 561 by 2043, remaining in 22nd place within its peer group. The average GDP per capita of its peer group is expected to reach USD$3 790 in 2043, 2.5 times as high.
In 2019, the Central African Republic’s informal sector accounted for approximately 40% of GDP compared to an average share of 30.1% in Africa’s low-income economies. By 2043, the country’s informal sector is forecast to account for about 34% of GDP, likely reflecting improvements in overall state capacity. Informal labour accounted for 90% of total labour force in the country and was projected to decline to 72.5% by 2043. Therefore, it is not surprising that the level of informality reflected in the size of the economy declines within the same period.
The IFs platform uses data from the Global Trade and Analysis Project (GTAP) to classify economic activity into six sectors: agriculture, energy, materials (including mining), manufacturing, services and information and communication technologies (ICT). Most other sources use a threefold distinction between only agriculture, industry and services with the result that data may differ.
In 2019, the Central African Republic’s service sector accounted for 40.9% of GDP (US$900 million), followed by agriculture and manufacturing which represented about 31.7% (US$700 million) and 20.5% (US$400 million), respectively. In the future, the service sector will remain the most important contributor to the country’s GDP. Its share is set to grow to 47.7%, equivalent to US$3.1 billion, by 2043 on the Current Path. At the same time, the contribution of the agriculture sector is forecast to drop to 15.6%, valued at US$1 billion. The share of the manufacturing sector, on the other hand, is forecast to increase by more than 9 percentage points to 30.2%, comparable to US$1.9 billion, in 2043.
The Central African Republic’s expected trajectory roughly mirrors that of its low-income peer group with services representing both the current and future lion’s share of contribution to GDP, followed by agriculture and manufacturing, which are expected to lose and gain ground, respectively. The contributions of the energy, ICT and materials sectors to GDP are negligible.
The data on agricultural production and demand in the IFs forecasting platform initialises from data provided on food balances by the Food and Agriculture Organization (FAO). IFs contains data on numerous types of agriculture but aggregates its forecast into crops, meat and fish, presented in million metric tons. Chart 9 shows agricultural production and demand as a total of all three categories.
Just like most African countries, the Central African Republic has excess demand for agricultural products. At 2.9 million metric tons per hectare in 2019, the country’s crop production is slightly higher than the average of Africa’s low-income economies, which stood at 2.7 million metric tons per hectare. Rwanda, the frontrunner in this category, has a crop yield of 8.3 million metric tons per hectare, followed by Malawi with a yield of 7.2 million metric tons per hectare. By 2043, the Central African Republic’s crop yield will increase to 4.1 million metric tons per hectare.
The lion’s share of the country's agricultural output is crops. In 2019, crop production amounted to about 2.4 million metric tons compared to the average output of 13.8 million metric tons in its low-income peer group. This gap is projected to widen by 2043 with the Central African Republic expected to increase its output to 3.3 million metric tons versus the group’s average output reaching 20.05 million metric tons.
The Central African Republic’s agricultural production does not meet demand. In 2019, the gap between production and demand amounted to almost 0.2 million metric tons. By 2043, this gap is expected to be more than 15 times as large standing at 2.6 million metric tons. Population growth is increasing agricultural demand. In combination with low productivity, competition over scarce resources resulting in insecurity, as well as environmental degradation and high exposure to climate change-related risks, food insecurity is a significant risk.
There are numerous methodologies for and approaches to defining poverty. We measure income poverty and use GDP per capita as a proxy. In 2015, the World Bank adopted the measure of US$1.90 per person per day (in 2011 international prices), also used to measure progress towards the achievement of Sustainable Development Goal (SDG) 1 of eradicating extreme poverty. To account for extreme poverty in richer countries occurring at slightly higher levels of income than in poor countries, the World Bank introduced three additional poverty lines in 2017:
- US$3.20 for lower middle-income countries
- US$5.50 for upper middle-income countries
- US$22.70 for high-income countries.
As a low-income country, the Central African Republic uses the US$1.90 benchmark to define extreme poverty. The country is the third poorest country in Africa, after South Sudan and Burundi, with a high poverty burden. In 2019, 73.9% of the population (3.56 million people) was living below the poverty line. This means that the Central African Republic’s poverty rate lies more than 26.1% percentage points above the average of its low-income peer group on the continent (47.8%).
In the Current Path forecast, the number of people living in extreme poverty in the Central African Republic will increase to 5.8 million people by 2043. The country’s poverty rate, however, is projected to decline to 68.3%. In 2019, the Central African Republic had the third highest poverty rate among Africa’s low-income economies. By 2043, it will have the second highest rate.
The IFs platform forecasts six types of energy, namely oil, gas, coal, hydro, nuclear and other renewables. To allow comparisons between different types of energy, the data is converted into billion barrels of oil equivalent (BBOE). The energy contained in a barrel of oil is approximately 5.8 million British thermal units (MBTUs) or 1 700 kilowatt-hours (kWh) of energy.
There is no historical data for energy production in IFs for the Central African Republic. The IFs projections initialise from 2015 and as such the forecast presented here is provisional. In 2019, the Central African Republic’s total energy production was about 0.013 million barrels of oil. By 2043, it is estimated to increase to 0.02 million barrels. The country’s current energy mix is heavily reliant on gas which accounted for over 80% of total production in 2019. Gas was followed by hydro at 13%.
The Current Path forecast projects a gradual transition towards less gas and more renewables in the Central African Republic’s energy mix in the future. By 2043, other renewables are expected to account for 74% of total energy production, hydro and oil are set to account for 4% each and nuclear is expected to account for 7%. Gas is set to drop to represent 11% of total production. The anticipated share of other renewables in the Central African Republic’s energy production profile by far exceeds the average of 39% that is expected for Africa’s low-income economies. This can be explained by the Central African Republic’s significant renewable energy resources (mostly solar and wind) that can be exploited to power the growing economy.
Carbon is released in many ways, but the three most important contributors to greenhouse gases are carbon dioxide (CO2), carbon monoxide (CO) and methane (CH4). Since each has a different molecular weight, IFs uses carbon. Many other sites and calculations use CO2 equivalent.
The Central African Republic’s carbon emissions stood at 0.1 million tons of carbon in 2019. They are forecast to increase ninefold to 0.9 million tons of carbon emissions by 2043.
Sectoral Scenarios for Central African Republic Development Futures
Download to pdfThe Stability scenario represents reasonable but ambitious reductions in the risk of regime instability and lower levels of internal conflict. Stability is generally a prerequisite for other aspects of development and this would encourage inflows of foreign direct investment (FDI) and improve business confidence. Better governance through the accountability that follows substantive democracy is modelled separately.
The intervention is explained here in the thematic part of the website.
In 2019, the Central African Republic scored 0.58 on the governance security index — below the average score of 0.641 for its low-income peer group. With a score of 0.76, Rwanda is the group’s best performer.
The country has been experiencing high levels of violent conflict since a violent takeover of power in 2013. And even though armed groups have concluded multiple peace agreements since, fighting is ongoing. The latest agreement, sponsored by the African Union, was signed in February 2019 by the government and 14 armed groups and raised hopes of peace. However, the violence has continued.
In the Stability scenario, the Central African Republic is projected to score 0.79 on governance security in 2043, essentially where Rwanda is at currently. On the Current Path, the Central African Republic will score 0.66. By then, its income peer group on the continent is projected to score on average 0.711 on the Current Path.
In 2019, the Central African Republic’s GDP per capita was US$843. Given the high levels of insecurity in the country, it is not surprising that the Stability scenario can make a significant difference by increasing GDP per capita to US$1 669 by 2043 — close to a 10% increase compared to the estimate of US$1 561 in the Current Path forecast in 2043. Still, the Central African Republic’s GDP per capita is projected to lag behind the average of its low-income peer group at US$3 975 in 2043 in the same scenario. Regime stability promotes growth by attracting foreign investment and creating an enabling environment for businesses to thrive. As such, rival factions in the Central African Republic should set aside their differences and work towards achieving a stable political environment in order to promote economic growth.
As a low-income economy, the Central African Republic uses the US$1.90 benchmark to define extreme poverty.
In the Stability scenario, the Central African Republic’s poverty rate could drop from 73.9% in 2019 to 65.9%, equivalent to 5.54 million people, in 2043. Compared to 68.3% in the Current Path forecast, it means that the Stability scenario could result in 220 000 fewer poor people. In other words, with the interventions included in the Stability scenario, the Central African Republic could speed up its poverty reduction efforts. The extreme poverty rate in the Stability scenario will also be 40 percentage points higher than the average for low-income African countries.
This section presents the impact of a Demographic scenario that aims to hasten and increase the demographic dividend through reasonable but ambitious reductions in the communicable-disease burden for children under five, the maternal mortality ratio and increased access to modern contraception.
The intervention is explained here in the thematic part of the website.
Demographers typically differentiate between a first, second and even a third demographic dividend. We focus here on the contribution of the size of the labour force (between 15 and 64 years of age) relative to dependants (children and the elderly) as part of the first dividend. A window of opportunity opens when the ratio of the working-age population to dependants is equal to or surpasses 1.7.
Increasing access to modern contraception will bring down the total fertility rate more quickly than forecast on the Current Path: from 4.73 births per woman in 2019 to 2.7 in 2043 versus 3.2 births on the Current Path. On the Current Path, it would take the country more than another decade to get there. A lower total fertility rate would slow down the Central African Republic’s population growth and bring about a somewhat faster change in the population age structure. The latter will result in a more favourable ratio between people of working age and dependants, especially children. In the interventions in the Demographic scenario, the Central African Republic has the potential to accelerate its demographic transition by increasing the ratio of workers to dependants from 1.16 in 2019 to 1.7 in 2043, coinciding with the minimum ratio for achieving demographic dividend compared to 1.5 on the Current Path. In comparison, Africa’s low-income economies would have an average ratio of 1.53 by 2043, below the projected ratio of 1.7 for the Central African Republic in the same year.
The infant mortality rate is the number of infant deaths per 1 000 live births and is an important marker of the overall quality of the health system in a country.
At 81 infant deaths per 1 000 live births, infant mortality in the Central African Republic is high, although it has improved greatly since 1990 when it stood at a rate of 117 deaths. Yet, the Central African Republic does far worse than the average African low-income economy at 48.5 infant deaths per 1 000 live births. The Demographic scenario could reduce the infant mortality rate to 27.3 deaths per 1 000 live births by 2043, 8 fewer deaths compared to 35 deaths in the Current Path forecast. However, the projected infant mortality rate in this scenario will be 6.1 deaths more than the average low-income country in Africa by 2043.
In 2019, the Central African Republic’s GDP per capita was US$843. By 2043, the Demographic scenario could push it to US$1 607 versus US$1 516 on the Current Path. Regardless, the gap between the country’s GDP per capita and the expected average GDP per capita of its low-income peer group is set to remain large, with the latter expected to have an average GDP per capita of US$3 790 in 2043 in the Current Path forecast.
Compared to the Current Path forecast, the Demographic scenario could reduce the number of people living in extreme poverty by 300 000 in 2043. A total of 5.46 million people, or 67.2% of the population, would be living below the poverty line by 2043, compared to 5.76 million people, equivalent to 68.3% of the population, on the Current Path. The Central African Republic will continue to perform much worse than the average of African low-income countries as the extreme poverty rate in this scenario will be 42 percentage points above its peers.
This section presents reasonable but ambitious improvements in the Health/WaSH scenario, which include reductions in the mortality rate associated with both communicable diseases (e.g. AIDS, diarrhoea, malaria and respiratory infections) and non-communicable diseases (NCDs) (e.g. diabetes), as well as improvements in access to safe water and better sanitation. The acronym WaSH stands for water, sanitation and hygiene.
The intervention is explained here in the thematic part of the website.
In 2019, the country’s average life expectancy was 51.2 years — the lowest in the world. The gap between the life expectancy of women and men is significant. On average, men reached 48.8 years of age and women 53.7 years. The country’s exceptionally low life expectancy stems from a high disease burden, driven to a large extent by low levels of access to safe water and improved sanitation as well as high levels of conflict and violence. With a death rate of 7.8 deaths per 1 000 people, the Central African Republic’s communicable-disease burden is almost twice as high than the average rate of its income peer group which stands at 4.1.
The Health/WaSH scenario has the potential to increase life expectancy in the Central African Republic to 61.4 years in 2043, versus 60.4 years on the Current Path — a gain of one year. In this scenario, women are expected to live up to 64.5 years compared to 58.4 years for men by 2043.
The Central African Republic performs much worse on life expectancy than the average African low-income economy that is projected to increase life expectancy to 70.85 years on the Current Path.
The Health/WaSH scenario would have a positive impact on the Central African Republic’s infant mortality rate. The infant mortality rate could drop from 81 deaths per 1 000 live births in 2019 to 30.7 deaths in 2043, compared to an expected rate of 35 deaths on the Current Path. The country performs worse than the average low-income economy in Africa, which is expected to record an infant mortality rate of 21.3 deaths per 1 000 live births in 2043 on the Current Path.
The Agriculture scenario represents reasonable but ambitious increases in yields per hectare (reflecting better management and seed and fertiliser technology), increased land under irrigation and reduced loss and waste. Where appropriate, it includes an increase in calorie consumption, reflecting the prioritisation of food self-sufficiency above food exports as a desirable policy objective.
The intervention is explained here in the thematic part of the website.
The data on yield per hectare (in metric tons) is for crops but does not distinguish between different categories of crops.
In 2019, crop yields in the Central African Republic stood at 1.5 metric tons per hectare, which is far below the average of 2.7 metric tons per hectare for its low-income peer group on the continent. According to the Current Path forecast, by 2043 yields in the Central African Republic will increase modestly to 1.9 metric tons per hectare — an increase by about 27%. In the Agriculture scenario, however, yields could increase by 133% over the same time period and amount to 3.5 metric tons per hectare, almost equivalent to the projected average for low-income peers.
The Central African Republic has enormous potential to increase agriculture production. However, the recurring conflict coupled with subsistence farming has impeded an agricultural revolution. In 2019, net agricultural imports accounted for 7.2% of the country’s demand — slightly below the average of 7.5% for low-income countries in Africa. On the Current Path, agricultural demand is increasingly outpacing production which will lead to greater import dependence. By 2043, net agricultural imports are expected to account for 39.3% of agricultural demand. This situation is mitigated in the Agriculture scenario as it has the potential to increase production to meet the rapid increase in demand fuelled by population growth. By 2043, net agricultural imports would account for 10.5% of demand — 21.8 percentage points below the Current Path average for low-income countries in Africa.
The Agriculture scenario is expected to push the Central African Republic’s GDP per capita to US$1 782 by 2043, compared to the Current Path forecast of US$1 516. Despite the boost, with an average GDP per capita of US$3 790 on the Current Path, per capita income in the average economy of African low-income countries is about 2.1 times greater than in the Central African Republic. It means that an agricultural revolution in the form of mechanised farming and improved technology can lead to economic growth in the Central African Republic.
The impact of the interventions in the Agriculture scenario imply that 60% of the population, equivalent to 5.03 million people, would live in extreme poverty, compared to 68.3% in the Current Path forecast. The Agriculture scenario has the potential to lift 730 000 people out of extreme poverty by 2043. The extreme poverty rate in this scenario will also be far higher than the projected average of 25.2% for low-income countries in Africa. The huge impact of the Agriculture scenario on poverty reduction in the Central African Republic underscores the importance of an agricultural revolution and mechanised farming in order to improve incomes of the large population whose livelihoods depend on the sector.
The Education scenario represents reasonable but ambitious improved intake, transition and graduation rates from primary to tertiary levels and better quality of education. It also models substantive progress towards gender parity at all levels, additional vocational training at secondary school level and increases in the share of science and engineering graduates.
The intervention is explained here in the thematic part of the website.
With a mean of 4.2 years of education among the adult population in 2019, the Central African Republic’s educational outcomes are very poor and 0.2 years below the average for low-income in Africa. At 3.1 years of education, they are even worse for females. Males have a score of 5.26. The Education scenario has the potential to increase the Central African Republic’s mean years of education to 6.2 years by 2043, compared to 5.9 years on the Current Path. Female education outcomes would still lag behind those for males (5.58 versus 6.94 mean years of education, respectively). Globally, the Central African Republic ranks tenth last in terms of educational performance measured in mean years of education. Only Niger, Mali, Chad, Mozambique, Burkina Faso, South Sudan, Senegal, Sudan and Ethiopia have even worse educational outcomes. By 2043, this will increase to 6.1 years on the Current Path.
The average test score for learners is an important indicator for measuring the quality of education. The Central African Republic’s primary test score in 2019 was 25.4% below the average of 27.7% for low-income countries in the same year. According to the Current Path forecast, it will improve to 29.8% in 2043. The Education scenario is expected to accelerate improvements, pushing average test scores for primary learners to 35.2% by 2043 — an increase of at least 5 percentage points compared to the Current Path forecast and average for low-income countries by 2043.
In the Education scenario, the average test score at the secondary level could increase by more than 10 percentage points from 36.4% in 2019 to 47.5% in 2043, versus 39.3% in the Current Path. The Central African Republic scores relatively better on test scores for secondary learners than its income peers in Africa.
The Central African Republic’s GDP per capita will increase to US$1 516 on the Current Path, compared to US$1 613 in the Education scenario. The country’s GDP per capita is forecast to continue to lag behind the Current Path average of US$3 790 for Africa’s lower middle-income economies. Although education is essential for improving the human capital formation which ultimately leads to growth, its effects take a long to manifest. For instance, it will take about a decade for primary and secondary school leavers to contribute to the economy.
In the Education scenario, it is expected that 66.8% of the population will live in extreme poverty by 2043, down from 73.9% in 2019 and compared to 68.3% on the Current Path. This translates to a projected total of 5.62 million poor people in 2043 compared to 5.76 million on the Current Path. The extreme poverty rate in this scenario will be 41.7 percentage points above the average of the Central African Republic’s income peers on the continent.
The Manufacturing/Transfers scenario represents reasonable but ambitious manufacturing growth through greater investment in the economy, investments in research and development, and promotion of the export of manufactured goods. It is accompanied by an increase in welfare transfers (social grants) to moderate the initial increases in inequality that are typically associated with a manufacturing transition. To this end, the scenario improves tax administration and increases government revenues.
The intervention is explained here in the thematic part of the website.
Chart 30 should be read with Chart 8 that presents a stacked area graph on the contribution to GDP and size, in billion US$, of the Current Path economy for each of the sectors.
In the Manufacturing/Transfers scenario, the manufacturing sector will experience the largest long-term gain in terms of its relative contribution to GDP. It is expected to increase by 0.56 percentage points above the Current Path in 2043. The manufacturing sector is followed by the ICT and service sectors which are projected to see their relative contributions to GDP increase by 0.34 and 0.36 percentage points, respectively, above the Current Path in 2043. It needs to be noted that the service sector initially increases and peaks in 2040 when it is expected to add 1.03 percentage points in terms of its relative contribution to GDP compared to the Current Path and decline afterwards.
The value of the service sector is forecast to increase by additional US$300 million in the Manufacturing/Transfers scenario compared to the Current Path forecast. The Manufacturing/Transfers scenario has the potential for the Manufactures sector to contribute an extra US$200 million more to the economy by 2043 compared to the Current Path. The ICT sector is expected to contribute an additional US$0.5 million in this scenario, followed by materials at US$0.4.
In the Manufacturing/Transfers scenario, government to household welfare transfers are forecast to increase from US$10 million in 2019 to US$200 million in 2043 — a twenty times increase over the forecast period. On the Current Path, government to household transfers will grow at a much slower rate, reaching US$100 million in 2043.
The Central African Republic’s GDP per capita is expected to increase from US$843 in 2019 to US$1 652 in the Manufacturing/Transfers scenario — 9% above the Current Path forecast of US$1 516. The GDP per capita in this scenario will also be significantly below the average of US$3 790 for average low-income countries in Africa.
The Manufacturing/Transfers scenario has the potential to reduce the share of the population living in extreme poverty from 73.9% in 2019 to 65.6% in 2043, compared to 68.3% in the Current Path forecast. This is a 3.3 percentage point improvement that would translate to about 230 000 fewer poor people in 2043 via the interventions in the Manufacturing/Transfers scenario. However, the Central African Republic’s poverty rate would be almost 2.7 times as high as the average poverty rate of its low-income peer group which is expected to be 25.2%.
The Leapfrogging scenario represents a reasonable but ambitious adoption of and investment in renewable energy technologies, resulting in better access to electricity in urban and rural areas. The scenario includes accelerated access to mobile and fixed broadband and the adoption of modern technology that improves government efficiency and allows for the more rapid formalisation of the informal sector.
The intervention is explained here in the thematic part of the website.
Fixed broadband includes cable modem Internet connections, DSL Internet connections of at least 256 KB/s, fibre and other fixed broadband technology connections (such as satellite broadband Internet, ethernet local area networks, fixed-wireless access, wireless local area networks, WiMAX, etc.).
The Central African Republic, like most African low-income economies, had a low fixed broadband rate of 2.94 subscriptions per 100 people in 2019. In the Leapfrogging scenario, by 2043, fixed broadband is set to increase to 50 subscriptions per 100 people versus 49.2 on the Current Path. The benefit of the Leapfrogging scenario manifests in the medium term. Already by 2037 subscriptions are forecast to be up to 50 per 100 people versus 41 per 100 people on the Current Path. On fixed broadband subscriptions, the Central African Republic performs above average compared to its income peer group on the continent, which recorded an average of 2.3 subscriptions in 2019 — a rate that by 2043 could increase to 30 on the Current Path.
Mobile broadband refers to wireless Internet access delivered through cellular towers to computers and other digital devices.
Broadband subscriptions in the Central African Republic are expected to increase rapidly either way but more quickly in the Leapfrogging scenario. In 2019, the Central African Republic had 10.8 mobile broadband subscriptions per 100 people, a rate that is basically half as high as the group average of 22.9 subscriptions per 100 people for Africa’s low-income economies.
The Leapfrogging scenario has the potential to push mobile broadband subscriptions to 118.6 subscriptions per 100 people by 2043, 7 more subscriptions above the Current Path forecast in the same year. It will, however, trail behind the average of 133.9 subscriptions per 100 for low-income African countries.
Access to electricity remains a key challenge for the Central African Republic. In 2019, only 26.2% of the population (1.3 million people) had access to electricity. In fact, the country ranks 12th out of Africa’s 23 low-income economies on access to electricity. At 32.17%, the 23 low-income economies in Africa have an average access rate that is almost 6 percentage points higher. In the Current Path forecast, 58.2% (4.9 million people) of the Central African Republic’s population will have access to electricity in 2043. In the Leapfrogging scenario, access to electricity is projected to expand faster, reaching 62.8% of the population (5.3 million people) by 2043. The Central African Republic will still not be able to catch up with its peers. On average, its low-income peer group will have an access level of 60.5% in 2043 on the Current Path. The electricity access rate is higher for urban residents and is projected to increase from 45.4% in 2019 to 78.3% (compared to the 73.9% on the Current Path) in 2043 in the Leapfrogging scenario. The rural electricity access rate stood at paltry 13.6% in 2019 and is projected to reach 53.4% in the Leapfrogging scenario and 48.7% on the Current Path in 2043.
In the Leapfrogging scenario, the Central African Republic’s GDP per capita is expected to experience a larger increase than on the Current Path: from US$843 in 2019 to US$1 706, compared to US$1 516. In the Leapfrogging scenario, the country’s projected future GDP per capita will still be much lower than the projected average GDP per capita for Africa’s low-income economies at US$3 790 in 2043.
The interventions in the Leapfrogging scenario are projected to benefit poverty reduction efforts in the Central African Republic. The share of the population living below the poverty line could drop from 73.9% to 65.2% by 2043, compared to 68.3% on the Current Path trajectory — a gain of close to 3 percentage points. The Leapfrogging scenario would reduce the number of people living in poverty to 5.49 million, meaning 270 000 fewer poor people, compared to the projected 5.76 million on the Current Path forecast. However, the extreme poverty rate in this scenario will be 2.6 times higher than the average for low-income countries in Africa by 2043.
The Free Trade scenario represents the impact of the full implementation of the African Continental Free Trade Area (AfCFTA) by 2034 through increases in exports, improved productivity and increased trade and economic freedom.
The intervention is explained here in the thematic part of the website.
The trade balance is the difference between the value of a country's exports and its imports. A country that imports more goods and services than it exports in terms of value has a trade deficit, while a country that exports more goods and services than it imports has a trade surplus.
In 2019, the Central African Republic had a trade deficit that accounted for 29% of GDP —more than twice the average of 12.9% for its income peers. The implementation of the AfCFTA in the Free Trade scenario would improve the country’s short- and medium-term trade deficit compared to the Current Path forecast and reverse later on. In the Free Trade scenario, the country’s trade balance is set to improve with the deficit accounting for 22.5% of GDP by 2043 versus 22.1% on the Current Path. Essentially, in any case, the Central African Republic is expected to have a negative trade balance by 2043, and in the Free Trade scenario the deficit would be even a bit higher than on the Current Path. This may be as a result of the intense competition that firms in the country are likely to face due to trade liberalisation under the AfCFTA. However, this is not enough to conclude that the Central African Republic will be worse off upon the full implementation of the AfCFTA.
In the Free Trade scenario, the Central African Republic’s GDP per capita is expected to experience a larger increase than on the Current Path: from US$843 in 2019 to US$1 720, 13.5% higher compared to US$1 516.
Trade openness will reduce poverty in the long term after initially increasing it due to the redistributive effects of trade. Most African countries export primary commodities and low-tech manufacturing products, and therefore a continental free trade agreement (AfCFTA) that reduces tariffs and non-tariff barriers across Africa will increase competition among countries in primary commodities and low-tech manufacturing exports. Countries with inefficient, high-cost manufacturing sectors might be displaced as the AfCFTA is implemented, thereby pushing up poverty rates. In the long term, as the economy adjusts and produces and exports its comparatively advantaged (lower relative cost) goods and services, poverty rates will decline.
In the Free Trade scenario, extreme poverty in the Central African Republic is expected to decrease more rapidly than on the Current Path. By 2043, 65.1% of the population is forecast to live in extreme poverty in the Free Trade scenario compared to 68.3% in the Current Path forecast. The 3.2 percentage point difference translates into 280 000 people that would be moved out of extreme poverty in the Free Trade scenario. In this scenario, the extreme poverty rate in the Central African Republic will be about 2.6 times higher than the average of Africa's low-income economies in 2043.
The Financial Flows scenario represents a reasonable but ambitious increase in worker remittances and aid flows to poor countries, and an increase in the stock of foreign direct investment (FDI) and additional portfolio investment inflows to middle-income countries. We also reduced outward financial flows to emulate a reduction in illicit financial outflows.
The intervention is explained here in the thematic part of the website.
The Central African Republic relies heavily on aid, mainly because of its high levels of poverty compounded by recurring conflict. In 2015, the country required a total US$415 million in aid. The UN, for instance, gave US$13.2 million to local donor agencies to support concerns of education, healthcare, nutrition, among others. According to the 2022 humanitarian response plan, at least 3.1 million people will require humanitarian assistance in 2022. At 30.7% of GDP in 2019, the Central African Republic is highly dependent on foreign aid, far above the average of 8.6% for the average low-income economy on the continent. In both the Current Path forecast and in the Financial Flows scenario, the contribution of foreign aid to the economy is projected to become less significant by 2043, dropping to 19.1% of GDP in the Financial Flows scenario and to 18.4% on the Current Path. In Africa’s low-income economies, aid will account for on average 3.8% of GDP on the Current Path.
FDI flows to the Central African Republic accounted for about 3.1% of GDP in 2019 versus 4.3% for the average African low-income economy. The impact of the COVID-19 pandemic on FDI flows manifested in the sharp drop to 1.4% in 2020. In the Financial Flows scenario, FDI as a share of GDP is projected to recover and slightly surpass pre-pandemic levels. By 2043, FDI flows are set to account for 3.7% of the country’s GDP compared to 3.2% on the Current Path. In Africa’s low-income economies, FDI is expected to account for 4.7% on the Current Path. The high level of instability in the Central African Republic is a disincentive to attracting FDI into the country.
The Central African Republic is a net sender of remittances. In 2019, remittances sent represented 2% of GDP. On the Current Path, by 2043, the money sent abroad will account for about 3.1% of GDP. In the Financial Flows scenario, remittances out of the Central African Republic would account for 3.2% of GDP.
In the Financial Flows scenario, the Central African Republic’s GDP per capita is expected to experience a slightly larger increase than on the Current Path — the difference being US$22. In the Financial Flows scenario, by 2043 the Central African Republic’s future GDP per capita of US$1 583 is projected to be significantly lower than the expected average for Africa’s low-income economies at US$3 790.
The interventions in the Financial Flows scenario have the potential to reduce the share of the population living in extreme poverty to 67.7% by 2043 compared to 68.3% in the Current Path forecast. This means that 500 000 fewer people (5.71 million people) could live below the poverty line in 2043. The extreme poverty rate in this scenario will be 42.5 percentage points above the average of the Central African Republic’s income peers on the continent.
The Infrastructure scenario represents a reasonable but ambitious increase in infrastructure spending across Africa, focusing on basic infrastructure (roads, water, sanitation, electricity access and ICT) in low-income countries and increasing emphasis on advanced infrastructure (such as ports, airports, railway and electricity generation) in higher-income countries.
Note that health and sanitation infrastructure is included as part of the Health/WaSH scenario and that ICT infrastructure and more rapid uptake of renewables are part of the Leapfrogging scenario. The interventions there push directly on outcomes, whereas those modelled in this scenario increase infrastructure spending, indirectly boosting other forms of infrastructure, including those supporting health, sanitation and ICT.
The intervention is explained here in the thematic part of the website.
In 2019, only 26.2% of the population of the Central African Republic (about 1.3 million people) had access to electricity. In urban areas, access rates were significantly higher, reaching 45.4%, versus 13.4% in rural areas. The interventions in the Infrastructure scenario have the potential to increase the Central African Republic’s overall electricity access rate to about 70% by 2043, compared to 58.1% on the Current Path. This means that close to one million more people could benefit from access to electricity by 2043 (5.87 million versus 4.91 million).
Rural areas would benefit more from the interventions in the Infrastructure scenario than urban areas because they are coming from such a low baseline. Access rates in rural areas would increase from 13.4% to 62.7% by 2043, compared to 48.7% on the Current Path. In urban areas, the Infrastructure scenario accounts for an additional improvement of about 7 percentage points pushing the expected access rate to 80.9%.
Indicator 9.1.1 in the Sustainable Development Goals refers to the proportion of the rural population who live within 2 km of an all-season road and is captured in the Rural Access Index.
Investments in rural road infrastructure are associated with positive socio-economic impacts, such as increased rural incomes and poverty reduction, improved maternal health as well as paediatric health and heightened agricultural productivity. In 2019, 40.5% of the Central African Republic’s rural population had access to an all-weather road. This is slightly below the average access rate of its low-income peer group which stands at 43%. The Infrastructure scenario has the potential to improve road access in rural Central African Republic. By 2043, it is projected that 46.6% of the population living in rural areas will have access to an all-weather road within a distance of 2 km, compared to 43.5% in the Current Path forecast. Despite the improvement in the Infrastructure scenario, it will still be lower than the 51% average for low-income African countries.
Improvements in the Infrastructure scenario are expected to push GDP per capita from US$843 in 2019 to US$1 588 in 2043, US$27 above the Current Path forecast. Despite the expected increases in both scenarios, the Central African Republic’s GDP per capita is forecast to remain below the average of US$3 790 for its low-income peer group on the continent.
In the Infrastructure scenario, the share of people in the Central Africa Republic living in extreme poverty is expected to drop from 73.9% in 2019 to 67.8% in 2043. This is a modest improvement compared to the Current Path forecast of 68.3%, and it means that 40 000 people could escape poverty by 2043 via the interventions in the Infrastructure scenario. The extreme poverty rate in this scenario will be 2.7 times higher than the average of its income peers on the continent.
The Governance scenario represents a reasonable but ambitious improvement in accountability and reduces corruption, and hence improves the quality of service delivery by government.
The intervention is explained here in the thematic part of the website.
As defined by the World Bank, government effectiveness ‘captures perceptions of the quality of public services, the quality of the civil service and the degree of its independence from political pressures, the quality of policy formulation and implementation, and the credibility of the government’s commitment to such policies’.
Chart 51 presents the impact of the interventions in the Governance scenario on government effectiveness.
In 2019, the Central African Republic’s government effectiveness score ranked third last within its low-income peer group at 0.8, placing it well below the average group score of 1.37. In the Current Path forecast and in the Governance scenario, the Central African Republic’s government effectiveness quality score is projected to improve to 1.38 and 1.48, respectively, by 2043. Africa’s low-income economies could reach an average score of 1.9 on the Current Path.
In the Current Path forecast, GDP per capita is expected to increase to US$1 516 while the interventions in the Governance scenario have the potential to increase GDP per capita from US$843 in 2019 to US$1 616 in 2043. The Central African Republic is expected to lag behind the average GDP per capita for Africa’s low-income economies which is projected to be US$3 790 on the Current Path.
The Governance scenario has a modest impact on poverty reduction. The Central African Republic could reduce the share of its population living below the poverty line to 67% by 2043, compared to 68.3% on the Current Path. The interventions in the Governance scenario could move about 110 000 people out of extreme poverty in 2043. The extreme poverty rate in this scenario will be 41.8 percentage points above the average of its income peers on the continent.
This section presents projections for carbon emissions in the Current Path for the Central African Republic and the 11 scenarios. Note that IFs uses carbon equivalents rather than CO2 equivalents.
Carbon emissions in the Central Africa Republic are relatively low and projected to reach 900 000 tons by 2043 on the Current Path. The Central African Republic’s carbon emissions are projected to increase in all the scenarios. The intervention that leads to the greatest release of carbon is the Agriculture scenario, followed by the Free Trade and Stability scenarios. The least carbon-intensive scenario is the Demographic scenario.
The Combined Agenda 2063 scenario consists of the combination of all 11 sectoral scenarios presented above, namely the Stability, Demographic, Health/WaSH, Agriculture, Education, Manufacturing/Transfers, Leapfrogging, Free Trade, Financial Flows, Infrastructure and Governance scenarios. The cumulative impact of better education, health, infrastructure, etc. means that countries get an additional benefit in the integrated IFs forecasting platform that we refer to as the synergistic effect. Chart 55 presents the contribution of each of these 12 components to GDP per capita in the Combined Agenda 2063 scenario as a stacked area graph.
The synergistic effect of the various scenarios could increase the Central African Republic’s GDP per capita by an additional US$204.9. Among the sectoral interventions, the Agriculture scenario is projected to have the greatest impact on GDP per capita, leading to an increase of US$211.5 by 2043. The second and third largest impacts on GDP per capita could be achieved in the Financial Flows and the Leapfrogging scenarios with additions to GDP per capita of US$159.1 and US$145, respectively. It means that in the long term, an agriculture revolution is essential to ensuring economic growth and improving human development in the Central African Republic.
Whereas Chart 55 presents a stacked area graph on the contribution of each scenario to GDP per capita as well as the additional benefit or synergistic effect, Chart 56 presents only the GDP per capita in the Current Path forecast and the Combined Agenda 2063 scenario.
In the Current Path forecast, the Central African Republic’s GDP per capita increases to US$1 516. In the Combined Agenda 2063 scenario, the country’s GDP per capita could reach US$2 702 — about 78% higher than the Current Path forecast. The huge impact of the Combined Agenda 2063 on GDP per capita suggests that an intersectoral policy push is necessary to achieve economic growth and improve human development in the Central African Republic.
In the Combined Agenda 2063 scenario, the Central African Republic can make more significant progress in eliminating extreme poverty. By 2043, 43.2% of the population is expected to live below the poverty line, which translates to 3.44 million people. In comparison, in the Current Path forecast, 68.3% of the population (5.76 million people) are projected to live in poverty. It means that the Combined Agenda 2063 scenario could move 2.32 million people out of extreme poverty by 2043. An intersectoral approach will be effective in tackling poverty in the Central African Republic since this scenario represents a policy push across sectors.
See Chart 8 to view the Current Path forecast of the sectoral composition of the economy.
The evolution of the various sectors in terms of their relative contributions to GDP does not follow a linear trajectory. In the Combined Agenda 2063 scenario, the service sector is set to experience the greatest increase in terms of its relative contribution to the Central African Republic’s GDP compared to the Current Path by an additional 3.4 percentage points in 2043. This translates to an increase in GDP of USD$3.9 billion. The manufacturing sector is projected to contribute an additional US$1.8 billion to the economy, although it will be equivalent to 2.6 percentage points below the Current Path in 2043. The contribution of the agriculture scenario to GDP, compared to the Current Path, increases rapidly from 2019 and peaks in 2029, 3.5 percentage points above the Current Path. By 2043, its contribution to GDP will be 2.9 percentage points below the Current Path. In absolute terms, agriculture would contribute US$700 million more in the Combined Agenda 2063 scenario than in the Current Path forecast.
The boost for the ICT sector via the interventions in the Combined Agenda 2063 scenario, on the other hand, is most pronounced in 2040 when the difference in percentage points compared to the Current Path is 2.9, the equivalent of an additional US$.4 billion compared to the Current Path. The contribution of the materials and energy sectors will be marginal, estimated to reach US$200 million and US$100 million, respectively, by 2043.
On the Current Path, the Central African Republic’s GDP is forecast to expand more than sixfold from US$2.2 billion to US$13.6 billion by 2043. In other words, in the Combined Agenda 2063 scenario, the country’s GDP would be more than twice as large as on the Current Path, indicating growth in the size of the economy by about 113% in 2043.
In 2019, the Central African Republic’s carbon emissions stood at 100 000 tons. In the Combined Agenda 2063 scenario, by 2043 the country is projected to emit 1.2 million tons — 12 times the volume of emissions in 2019 (0.1 million tons) and 300 000 tons more than the Current Path forecast (0.9 million tons) by 2043. The greater increase in the Combined Agenda 2063 scenario is the result of higher economic growth expected to occur in the Combined Agenda 2063 scenario which will be carbon intensive as the cost of growth.
Page information
Contact at AFI team is Enoch Randy Aikins
This entry was last updated on 28 May 2026 using IFs v7.63.
Donors and sponsors


Reuse our work
- All visualizations, data, and text produced by African Futures are completely open access under the Creative Commons BY license. You have the permission to use, distribute, and reproduce these in any medium, provided the source and authors are credited.
- The data produced by third parties and made available by African Futures is subject to the license terms from the original third-party authors. We will always indicate the original source of the data in our documentation, so you should always check the license of any such third-party data before use and redistribution.
- All of our charts can be embedded in any site.
Cite this research
Enoch Randy Aikins (2026) Central African Republic Development Futures. Published online at futures.issafrica.org. Retrieved from https://futures.issafrica.org/geographic/countries/central-african-republic/ [Online Resource] Updated 28 May 2026.