 Cape Verde
Feedback welcome
Our aim is to use the best data to inform our analysis. See our Technical page for information on the IFs forecasting platform. We appreciate your help and references for improvements via our feedback form.
Please note: This country report was developed using African Futures’ previous analytical framework, which organised the assessment across 11 sectoral scenarios. We have since updated and streamlined the analytical architecture to 8 sectoral scenarios. While the two frameworks remain broadly aligned, the current structure improves consistency, comparability and integration across themes and geographic studies. This page will therefore be updated to the current framework in due course. Read more about our analytical framework on the Technical Page.
In this entry, we first describe the Current Path forecast for Cape Verde as it is expected to unfold to 2043, the end of the third ten-year implementation plan of the African Union’s Agenda 2063 long-term vision for Africa. The Current Path in the International Futures (IFs) forecasting model initialises from country-level data that is drawn from a range of data providers. We prioritise data from national sources.
The Current Path forecast is divided into summaries on demographics, economics, poverty, health/WaSH and climate change/energy. A second section then presents a single positive scenario for potential improvements in stability, demographics, health/WaSH, agriculture, education, manufacturing and transfers, leapfrogging, free trade, financial flows, infrastructure, governance and the impact of various scenarios on carbon emissions. With the individual impact of these sectors and dimensions having been considered, a final section presents the impact of the Combined Agenda 2063 scenario.
We generally review the impact of each scenario and the Combined Agenda 2063 scenario on gross domestic product per person and extreme poverty, except for Health/WaSH that uses life expectancy and infant mortality.
The information is presented graphically and supported by brief interpretive text.
All US$ numbers are in 2017 values.
*The country's income status has changed since the analysis was initally completed. The new income status will be reflected when we the report is updated in the future.
Executive Summary
- The Current Path forecast shows that Cape Verde will:
- witness significant growth in urbanisation, such that by 2043, 73.5% of the population will reside in urban areas Jump to Demographics: Current Path
- experience an increase in GDP per capita to US$10 839 in 2043 Jump to Economics: Current Path
- significantly reduce the number of people living below the poverty line of US$3.20 to 80 000 people (11.5% of the population) in 2043 Jump to Poverty: Current Path
- see an increase in the share of coal produced in the country (35%) while other renewable energies will constitute 50% of total energy production in 2043 Jump to Carbon emissions/Energy: Current Path
- Sectoral scenarios
- The Stability scenario will improve Cape Verde’s score on the government security index to 0.96 in 2043, and simultaneously increase GDP per capita to US$11 074, reducing the proportion of the population living below the poverty line to 11% Jump to Stability scenario
- The ratio of the working-age population to dependants will be 2.09 by 2043. The country will miss the under-5 mortality target of 25 deaths per thousand births by 2030, but by 2043 its infant mortality rate will be 14.4 deaths per thousand live births in the Demographic scenario Jump to Demographic scenario
- The Health/WaSH scenario will increase life expectancy to 77.7 years by 2043, and reduce infant mortality per 1 000 live births to 10.8 Jump to Health/WaSH scenario
- In the Agriculture scenario, Cape Verde’s crop yield per hectare will only marginally improve over the average for its income peer group at 5.5 metric tons, and the nation will remain a net importer of agricultural products with a deficit of 36.4% of total agricultural demand by 2043 Jump to Agriculture scenario
- The Education scenario will result in a GDP per capita of US$11 140 by 2043, although the number of poor people in Cape Verde will decline only marginally as a result of implementing this scenario Jump to Education scenario
- In the Manufacturing/Transfers scenario, government welfare transfers to households will increase to US$0.38 billion in 2043 Jump to Manufacturing/Transfers scenario
- The Leapfrogging scenario will increase mobile broadband subscriptions per 100 people from 88.5 in 2019 to 153.2 in 2043, and also enable access to electricity by 97% of the population Jump to Leapfrogging scenario
- In the Free Trade scenario, there will be an increase in GDP per capita to US$12 034 by 2043 and a reduction in the proportion of poor people in Cape Verde to 8.5% of the population Jump to Free Trade scenario
- The Financial Flows scenario will decrease foreign aid as a percentage of GDP, while slowly decreasing foreign direct investment inflows as percentage of GDP to 7.5% by 2043 Jump to Financial Flows scenario
- The Infrastructure scenario will increase the percentage of the rural population living within 2 km of all-weather roads to 85.9% by 2043 Jump to Infrastructure scenario
- The Governance scenario will increase GDP per capita to US$10 965 by 2043 Jump to Governance scenario
- While Cape Verde’s carbon emissions are projected to increase under all the scenarios, the Free Trade scenario will have the greatest impact, resulting in additional emissions of 0.41 million tons of carbon in 2043 Jump to Impact of scenarios on carbon emissions
- The Combined Agenda 2063 scenario will result in: Jump to Combined Agenda 2063 scenario
- An increase in GDP per capita by US$4 824 in 2043, with the Free Trade and Manufacturing/Transfers scenarios having the greatest potential to increase GDP per capita
- A significant growth in the size of the economy to US$8.7 billion in 2043, compared to the Current Path forecast of US$5.2 billion
- A significant reduction in the number of people living below the poverty line, to 23 000 people (3.6% of the population)
All charts for Cabo Verde Development Futures
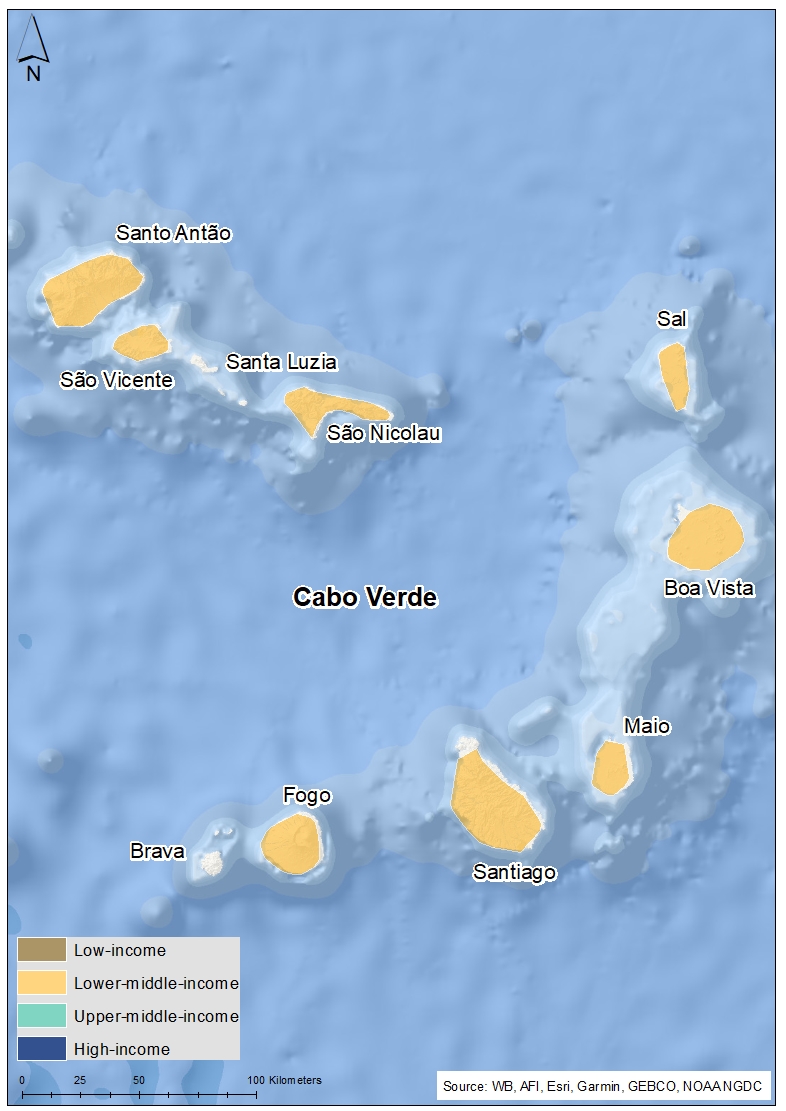
- Chart 1: Political map of Cape Verde Source: ArcGIS online (Esri, CGIAR, USGS, HERE, Garmin, FAO, NOAA)
- Chart 2: Population structure in CP, 1990–2043
- Chart 3: Urban and rural population in CP, 1990–2043
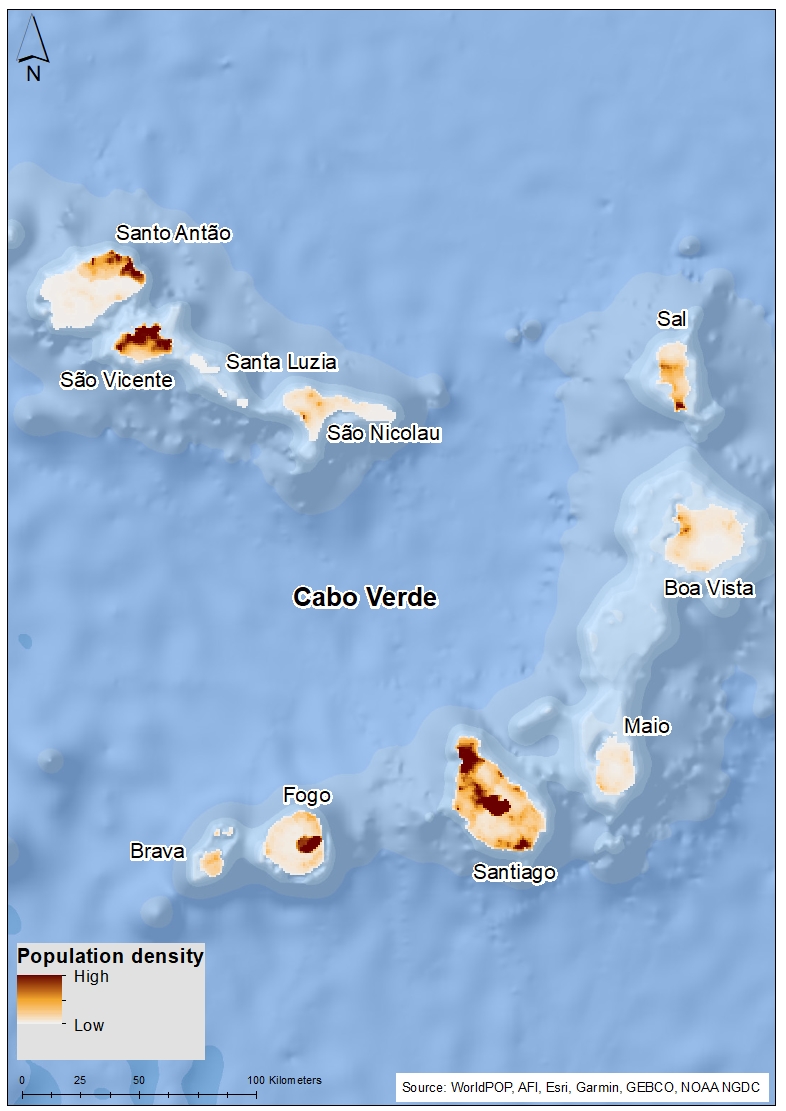
- Chart 4: Population density map for 2019
- Chart 5: GDP in CP, 1990–2043
- Chart 6: GDP per capita in CP, 1990–2043
- Chart 7: Informal sector value in CP, 2015–2043
- Chart 8: Value added by sector in CP, 2015–2043
- Chart 9: Agriculture production/demand in CP, 1990–2043
- Chart 10: Poverty in CP, 2015–2043
- Chart 11: Energy production by type in CP, 1990–2043
- Chart 12: Carbon emissions in CP, 1990–2043
- Chart 13: Governance security in CP and Stability scenario, 2019–2043
- Chart 14: GDP per capita in CP and Stability scenario, 2019–2043
- Chart 15: Poverty in CP and Stability scenario, 2019–2043
- Chart 16: Demographic dividend in CP and Demog scenario, 2019–2043
- Chart 17: Infant mortality in CP and Demog scenario, 2019–2043
- Chart 18: GDP per capita in CP and Demog scenario, 2019–2043
- Chart 19: Poverty in CP and Demog scenario, 2019–2043
- Chart 20: Life expectancy in CP and Health/WaSH scenario, 2019–2043
- Chart 21: Infant mortality in CP and Health/WaSH scenario, 2019–2043
- Chart 22: Yield/hectare in CP and Agric scenario, 2019–2043
- Chart 23: Agriculture imports in CP and Agric scenario, 2019–2043
- Chart 24: GDP per capita in the CP and Agric scenario, 2019–2043
- Chart 25: Poverty in CP and Agric scenario, 2019–2043
- Chart 26: Mean years of education in CP and Educ scenario, 2019–2043
- Chart 27: Education quality in CP and Educ scenario, 2019–2043
- Chart 28: GDP per capita in CP and Educ scenario, 2019–2043
- Chart 29: Poverty in CP and Educ scenario, 2019–2043
- Chart 30: Value added by sector in CP and Manufac/Transfers scenario, 2019–2043
- Chart 31: Gov welfare transfers in CP and Manufac/Transfers scenario, 2019–2043
- Chart 32: GDP per capita in CP and Manufac/Transfers scenario, 2019–2043
- Chart 33: Poverty in CP and Manufac/Transfers scenario, 2019–2043
- Chart 34: Fixed broadband access in CP and Leapfrogging scenario, 2019–2043
- Chart 35: Mobile broadband access in CP and Leapfrogging scenario, 2019–2043
- Chart 36: Electricity access in CP and Leapfrogging scenario, 2019–2043
- Chart 37: GDP per capita in CP and Leapfrogging scenario, 2019–2043
- Chart 38: Poverty in CP and Leapfrogging scenario, 2019–2043
- Chart 39: Trade balance in CP and Free Trade scenario, 2019–2043
- Chart 40: GDP per capita in CP and Free Trade scenario, 2019–2043
- Chart 41: Poverty in CP and Free Trade scenario, 2019–2043
- Chart 42: Foreign aid in CP and Financial Flows scenario, 2019–2043
- Chart 43: Inflow of FDI in CP and Financial Flows scenario, 2019–2043
- Chart 44: Remittances in CP and Financial Flows scenario, 2019–2043
- Chart 45: GDP per capita in CP and Financial Flows scenario, 2019–2043
- Chart 46: Poverty in CP and Financial Flows scenario, 2019–2043
- Chart 47: Electricity access in CP and Infrastructure scenario, 2019–2043
- Chart 48: Rural road access in CP and Infrastructure scenario, 2019–2043
- Chart 49: GDP per capita in CP and Infrastructure scenario, 2019–2043
- Chart 50: Poverty in CP and Infrastructure scenario, 2019–2043
- Chart 51: Gov effectiveness in CP and Governance scenario, 2019–2043
- Chart 52: GDP per capita in CP and Governance scenario, 2019–2043
- Chart 53: Poverty in CP and Governance scenario, 2019–2043
- Chart 54: Carbon emissions in CP and scenarios, 2019–2043
- Chart 55: GDP per capita in CP and scenarios, 2019–2043
- Chart 56: GDP per capita in CP and Combined scenario, 2019–2043
- Chart 57: Poverty in CP and Combined scenario, 2019–2043
- Chart 58: Value added by sector in CP and Combined scenario, 2019–2043
- Chart 59: GDP in CP and Combined scenario, 2019–2043
- Chart 60: Carbon emissions in CP and Combined scenario, 2019–2043


Cabo Verde Development Futures: Current Path
Download to pdfThis page provides an overview of the key characteristics of Cape Verde along its likely (or Current Path) development trajectory. The Current Path forecast from the International Futures forecasting (IFs) platform is a dynamic scenario that imitates the continuation of current policies and environmental conditions. The Current Path is therefore in congruence with historical patterns and produces a series of dynamic forecasts endogenised in relationships across crucial global systems. We use 2019 as a standard reference year and the forecasts generally extend to 2043 to coincide with the end of the third ten-year implementation plan of the African Union’s Agenda 2063 long-term development vision.
Chart 1 shows the political map of Cape Verde, one of the 23 lower middle-income countries in Africa. An archipelago in the central Atlantic Ocean, Cape Verde consists of ten islands with a combined land area of about 4 033 km². The country lies off the western coast of Africa with its nearest African neighbours being Senegal, The Gambia and Mauritania. It is also a member of ECOWAS, and the official language is Portuguese with Creole as national language. Geographically, three of the Cape Verde islands (Sal, Boa Vista and Maio) are fairly flat, sandy and dry; the others are generally rockier with more vegetation. Its climate is milder than that of the African mainland, with a cooler air temperature than in Senegal, but a warmer sea. In 2011, Cape Verde was ranked the eighth most endangered nation due to flooding from climate change. The largest island, both in size and population, is Santiago, which hosts the nation's capital, Praia. Estimates of the Cape Verdean population from 2019 are 0.55 million. Significantly lacking in natural resources, only five of the ten main islands (Santiago, Santo Antão, São Nicolau, Fogo and Brava) normally support significant agricultural production; 90% of all food consumed in the country is imported. However, its mineral resources include salt, pozzolana (a volcanic rock used in cement production) and limestone. The fragmentation of the territory creates significant connectivity issues, as well as challenges for service delivery, including energy, water, education and health. Despite these challenges, in 2019, Cape Verde was ranked 1st in West Africa and 13th in Africa in the human development index (HDI).
Chart 2 shows population by cohort based on the Current Path forecast. Cape Verde is the 10th most populous country in West Africa, and the 52nd most populous in Africa, with an estimated population of 0.55 million in 2019 from 0.33 million in 1990. This represents an increment of about 67% in the country’s population over the past 29 years. In the Current Path forecast, the population of Cape Verde is set to increase to 0.67 million by 2043, representing an approximate increase of 21.8% over the next 24 years. The relatively slower increase in the population growth rate can be attributed to the adoption of improved birth control methods, such as the use of contraceptives. Cape Verde has a relatively smaller youthful population compared to other African countries, with a youth bulge of 37.4% and a median age of 26.6 years in 2019. However, the country faces a youth unemployment problem; the level of youth unemployment was estimated to be about 50.8% in 2014 for young people between the ages of 14–24.
In addition, 28.5% of the population is below the age of 15 years and 27.8% under the age of 30 years. With an expected decline in the fertility rate from 2.3 births per woman in 2019 to 1.9 births in 2043, it is projected that the proportion of people below the age of 15 years will fall to 20.3% over the next 24 years. This signals the likelihood of a larger adult population. The share of people under the age of 64 years increases from 38.7% in 2019 to 45.5% in 2043, meaning that the size of the working-age population will slightly increase from 66.5% in 2019 to 67.6% in 2043. The average life expectancy in Cape Verde was 74.2 years in 2019 but is estimated to increase to 77.4 years in 2043. The relatively high life expectancy in the country is mainly due to a reduction in death from communicable disease and injuries. Deaths from communicable diseases have declined from 1 000 in 1990 to 600 in 2019.
Chart 3 shows the portion of the population living in urban and rural centres from 1990 to 2043. In 1990, the majority of Cape Verdeans resided in rural areas, constituting about 56% of the population. However, by 1997, the country had achieved parity in rural–urban settlement. Over the past 29 years, the proportion of people who reside in rural areas has steadily declined by 21.1 percentage points, from 56% in 1990 to 33.8% in 2019, suggesting rapid urbanisation in the country. By 2043, it is projected that about 73.5% of the Cape Verdean population will live in urban areas. The crisis of frequent drought in the rural areas, coupled with the growth and expansion of the tourism sector, mainly in the cities, are some of the factors that push people to move from the rural areas to urban centres. This rapid urbanisation, if not well managed, will lead to problems such as unemployment, poverty, inadequate health, poor sanitation, urban slums, and environmental degradation.
Chart 5 depicts the projected GDP in the Current Path forecast from 1990 to 2043. The main structural drivers of the economy are the tourism sector, followed by the building construction, trade and transport sectors. Cape Verde has witnessed significant economic progress since 1990, driven in large part by the rapid development of tourism. As a result, between 1990 to 2019, the GDP of Cape Verde has increased by over US$2 billion – from US$0.4 billion in 1990 to US$2.5 billion in 2019, representing an increase of 525% over the 29-year period. Between 1993 to 2008, the country had an average GDP growth of about 7.3%. Unfortunately, this economic growth was truncated and the economy hit a downward trend from 2009. This was mainly due to the global financial and economic crises that occurred between 2008 and 2009, leading to a decline in foreign direct investment, remittances and official development assistance to the country. The economy began to recover from 2016, thanks to the revitalisation of the tourism sector, increased access to credit for the private sector and diversified agricultural production. However, the Zika virus, which had infected a suspected 7 557 people by May 2016, affected the tourism sector in the country. Moreover, the Ebola epidemic, which generally affected Africa as a tourist destination, also affected Cape Verde’s tourism sector in particular and its economy as a whole. This derailed the expected economic growth in the country. Also, driven by the shutdown in the tourism sector due to COVID-19, GDP contracted by 14.8 % in 2020, one of the largest reductions in Africa. By 2043, Cape Verde’s GDP is estimated to more than double to US$5.2 billion from its level in 2019.
Although many of the charts in the sectoral scenarios also include GDP per capita, this overview is an essential point of departure for interpreting the general economic outlook of Cape Verde.
Chart 6 represents GDP per capita (PPP) projections in the Current Path forecast. From 1990 to 2019, the country significantly increased its GDP per capita by 312.3% from US$1 827 in 1990 to US$7 533 in 2019. The increase in GDP per capita reflects the relatively high GDP growth as compared to population over the period. However, GDP per capita declined to US$6 567 in 2020 – mainly due to the COVID-19 pandemic, which negatively impacted the Cape Verdean economy given the country’s overreliance on tourism. With an expected increase in GDP and decline in fertility rates, it is projected that GDP per capita will rise even further over the next 22 years, such that, by 2043, it will have increased to US$10 839. Although Cape Verde’s GDP per capita in 1990 was lower than the average for lower middle-income countries in Africa, the trend reversed by 2006 so that, in 2019, Cape Verde’s GDP per capita was US$544 higher than the average for lower middle-income countries in Africa. This gap is expected to widen to US$1 697 by 2043. This suggests that Cape Verde now either has a lower population growth rate or a higher economic growth compared to the average lower middle-income country in Africa.
Chart 7 shows the projections for the informal sector in the Current Path forecast for Cape Verde and the average for lower middle-income economies in Africa. The majority of the people in the informal sector in Cape Verde are men, accounting for 52%. The size of the informal sector in Cape Verde was equivalent to 21.5% of GDP in 2019. This is expected to decline to 18.1% by 2043, constituting a 3.4 percentage point decrease over the 24-year period. In 2019, the total number of people employed by the informal economy constituted 35.7% of the total labour force, though this is expected to decline to 30.7% in 2043. It is therefore not surprising that the level of informality will also decline within the same period. Throughout the period under consideration, the size of the informal sector in Cape Verde is lower than the average for lower middle-income African countries. Addressing informality is essential and urgent to support inclusive economic development and reduce poverty. Authorities in Cape Verde need to take measures to reduce the size of the informal economy with the least friction possible by reducing the hurdles to registering a business, tackling corruption and improving access to finance.
The IFs platform uses data from the Global Trade and Analysis Project (GTAP) to classify economic activity into six sectors: agriculture, energy, materials (including mining), manufactures, services and information and communications technologies (ICT). Most other sources use a threefold distinction between only agriculture, industry and services with the result that data may differ.
Chart 8 illustrates the value added by sector in both absolute and proportionate terms in the Current Path forecast. The three largest contributors to GDP in Cape Verde are services, agriculture and manufacturing. In 2019, the service sector contribution to GDP was about US$1.7 billion, representing 68.4% of GDP. This is expected to increase to US$3.7 billion by 2043, representing 71.2% of GDP. The agricultural sector is currently the second-largest contributor to GDP with a share of 11.5%, constituting about US$0.3 billion in 2019. Manufacturing is the third-most significant contributor to GDP with a share of 10.7%. However, it is expected that, by 2025, the manufacturing sector will overtake the agricultural sector as the second-largest contributor to GDP, so that by 2043, the manufacturing sector will contribute 5.6 percentage points more to GDP than agriculture. The ICT sector will also steadily increase its value added from 6.5% in 2019 to 7.6% in 2043, thus overtaking agriculture to become the third-largest contributor to GDP by 2041. The forecasted low contribution by the agriculture sector raises concerns about food security in the country. It also indicates the structural transformation of the economy, which is a key determinant of productivity growth.
The data on agricultural production and demand in the IFs forecasting platform initializes from data provided on food balances by the Food and Agricultural Organization (FAO). IFs contains data on numerous types of agriculture but aggregates its forecast into crops, meat and fish, presented in million metric tonnes. Chart 9 shows agricultural production and demand as a total of all three categories.
Chart 9 displays estimations for agriculture production and demand in the Current Path forecast. In 1990, Cape Verde’s demand for agricultural products outstripped domestic production by 0.11 million metric tons; this increased to 0.22 million metric tons in 2019. Agricultural production accounts for less than 10% of food requirements in the country. Although the yield per hectare for crops is expected to increase from 2.8 metric tons in 2019 to 3.7 metric tons in 2043, the gap between demand and production will widen. By 2043, demand will outstrip domestic production by about 0.31 million metric tons, representing a 40% increment over the period. This raises concerns about food security in the country within the next 24 years.
There are numerous methodologies and approaches to defining poverty. We measure income poverty and use GDP per capita as a proxy. In 2015, the World Bank adopted the measure of US$1.90 per person a day (in 2011 international prices), also used to measure progress towards the achievement of Sustainable Development Goal (SDG) 1 of eradicating extreme poverty. To account for extreme poverty in richer countries occurring at slightly higher levels of income than in poor countries, the World Bank introduced three additional poverty lines in 2017:
- US$3.20 for lower middle-income countries
- US$5.50 for upper middle-income countries
- US$22.70 for high-income countries.
Chart 10 displays the number and the portion of people living below the poverty line in the Current Path forecast. Cape Verde as a lower middle-income country uses the US$3.20 poverty line. In 2019, about 0.11 million people, constituting 19.7% of the Cape Verdean population, lived in extreme poverty. The decline in poverty levels was mainly due to political stability, strong institutions, investment in human capital and the growth of the tourism sector. The poverty rate is expected to peak at 0.115 million, constituting 18.4% in 2032. Afterwards, it continues a downward trend so that, by 2043, only 0.08 million people, representing 11.5% of the population, will live on less than US$3.20 per day. This means that the proportion of the extremely poor population will reduce by 8.1 percentage points, and the absolute number of poor people in the country will also be 0.03 million people fewer than in 2019. Throughout the period under consideration, the proportion of poor people in Cape Verde is lower than the average for lower middle-income countries in Africa such that, by 2043, the extreme poverty rate in Cape Verde will be 26.8 percentage points below the projected average for lower middle-income countries in Africa. However, there is still a disparity in poverty levels among rural and urban dwellers, with poverty rates high in rural areas – especially in female-headed households. Most of the poor population in Cape Verde are mainly employed in the agricultural sector.
The IFs platform forecasts six types of energy, namely oil, gas, coal, hydro, nuclear and other renewables. To allow comparisons between different types of energy, the data is converted into billion barrels of oil equivalent (BBOE). The energy contained in a barrel of oil is approximately 5.8 million British thermal units (MBtus) or 1 700 kilowatt-hours (kWh) of energy.
Chart 11 represents energy production by type in barrels of oil equivalent (BBOE) and percentage of total in the Current Path forecast from 1990 to 2043. The dominant energy produced by Cape Verde is coal-powered, followed by gas and oil. In 2019, the total amount of coal produced was 0.9 million BOE, constituting 60% of total energy produced in the country. Gas and oil production accounted for 20% each of the total production. The share of coal in total energy production is projected to increase to about 80% in 2040 before declining to 35%, representing 0.7 million BOE, in 2043. On the other hand, oil and gas production in the country will decline consistently such that, by 2043, the share of oil and gas in total energy production will be 5% each. With over 3 500 hours of sunshine per year, the country has huge potential for solar energy. Aside from this, there are efforts to also develop the country’s wind, hydro, geothermal and ocean power. It is expected that renewable energies will constitute half of total energy production in 2043.
Carbon is released in many ways, but the three most important contributors to greenhouse gasses are carbon dioxide (CO2), carbon monoxide (CO) and methane (CH4). Since each has a different molecular weight. IFs uses carbon. Many other sites and calculations use CO2 equivalent.
Chart 12 shows projections for tons of carbon emissions in the Current Path forecast. Cape Verde is one of the countries in Africa with very significantly low levels of carbon emissions. Regardless, carbon emissions have increased steadily on the Current Path from 1990 to 2043, albeit at very negligible levels, with a projection of 0.4 million in 2043. The government’s projection of 50% renewable energy penetration by 2030, based on an estimated 150 MWp of new solar projects and 60 MW of new wind farms, can contribute to lower carbon emissions. In fact, the country hosts the ECOWAS Center for Renewable Energy and Energy Efficiency (ECREEE), which was established in 2009 with the support of the governments of Austria and Spain and the United Nations Industrial Development Organization (UNIDO).
Sectoral Scenarios for Cabo Verde Development Futures
Download to pdfThe Stability scenario represents reasonable but ambitious reductions in risk of regime instability and lower levels of internal conflict. Stability is generally a prerequisite for other aspects of development and this would encourage inflows of foreign direct investment (FDI) and improve business confidence. Better governance through the accountability that follows substantive democracy is modelled separately.
The intervention is explained in here in the thematic part of the website.
Chart 13 shows the governance security index based on the Current Path forecast and Stability scenario from 2019 to 2043. The scenario generally signifies increased political stability, reduced internal conflict, high FDI inflows, improved accountable governance and low levels of corruption in the country. Cape Verde is one of the few countries on the continent that have enjoyed a stable democracy over the years. The country is a parliamentary democracy with a president and prime minister, modelled on the Portuguese system. Since its first multiparty elections and the promulgation of the 1992 constitution, the country has had peaceful elections and periodic change of government between rival parties: the African Party, the Independence of Cape Verde (PAICV), and the Movement for Democracy (MpD). Elections in the country are generally free and fair, with freedom of the press and rule of law respected by the state. In 2019, Cape Verde’s score on the governance security index was 0.81, which was higher than the average of 0.72 for lower middle-income African countries. Using the Stability scenario, its score on the government security index is projected to rise to 0.91 in 2043, 0.07 points above the Current Path forecast in the same year. Compared to the average for lower middle-income countries in Africa, Cape Verde has a higher level on the governance security index so that, by 2043, Cape Verde’s score will be 0.15 points higher than the Current Path forecast for the average for lower middle-income countries in Africa.
Chart 14 presents GDP per capita at purchasing power parity (PPP) in the Current Path forecast and based on the Stability scenario for Cape Verde. The GDP per capita for Cape Verde in 2019 was US$7 533, which was US$544 less than the average for lower middle-income countries in Africa. In the Stability scenario, GDP per capita is projected to increase to US$11 074 by 2043. This will be US$235 more than the Current Path forecast and US$1 932 above the Current Path forecast for the average for lower middle-income countries in Africa at US$9 142. With the Cape Verdean economy heavily dependent on the tourism sector, it is critical that political stability and a peaceful environment is maintained in order to grow the tourism sector and in turn cause economic growth. For instance, the tourism sector alone directly accounted for 35% of GDP in 2015 and averaged around 31.1% of GDP between 2010 and2015.
Chart 15 presents the number and portion of people living below the extreme poverty line. With Cape Verde being a lower middle-income country, it uses the global poverty line of US$3.20. In 2019, the number of people living on less than US$3.20 a day was around 0.11 million, equivalent to 19.6% of the population. The Stability scenario will reduce the portion of people living below the poverty line to 11% by 2043, which is 0.5 percentage point below the Current Path forecast and 27.3 percentage points below the average for lower middle-income countries in Africa. Also, the number of poor people will decline marginally from 0.11 million people in 2019 to 74 000 people in 2043 in the Stability scenario. This means that the materialisation of the Stability scenario could lead to 4 000 fewer poor people than in the Current Path in 2043.
This section presents the impact of a Demographic scenario that aims to hasten and increase the demographic dividend through reasonable but ambitious reductions in the communicable-disease burden for children under five, the maternal mortality ratio and increased access to modern contraception.
The intervention is explained here in the thematic part of the website.
Demographers typically differentiate between a first, second and even a third demographic dividend. We focus here on the contribution of the size of the labour force (between 15 and 64 years of age) relative to dependants (children and the elderly) as part of the first dividend. A window of opportunity opens when the ratio of the working-age population to dependants is equal to or surpasses 1.7.
Chart 16 displays the demographic dividend based on the Current Path and Demographic scenario. In 2019, the ratio of the working-age population to dependants in Cabo Verde was 1.99, meaning that there were nearly two working-age people for each dependant in the country. This is far greater than the average of 1.32 for lower middle-income countries in Africa. Generally, the demographic dividend materialises when the country reaches a minimum ratio of 1.7 working-age people for each dependant. This means that Cape Verde has already achieved this ratio, making it one of the few countries on the continent to attain this height. While the Demographic scenario leads to a higher increment in the ratio of the working-age population to dependants than the Current Path forecast, eventually they converge such that, by 2043, both scenarios lead to a demographic dividend of 2.09. This is also far greater than the average of 1.75 for lower middle-income countries in Africa.
The infant mortality rate is the number of infant deaths per 1 000 live births and is an important marker of the overall quality of the health system in a country.
Chart 17 depicts infant mortality in both the Current Path forecast and Demographic scenario. The infant mortality rate in Cape Verde in 2019 was 16.6 deaths per 1 000 live births, meaning that for every 1 000 infants that are born, about 17 died. Infections and parasites are among the main sources of death among children under the age of one in the country. This figure is far lower than the average of 46.4 for lower middle-income countries in Africa. By 2043, the Demographic scenario will lead to a decline in infant mortality to 9.3 deaths per thousand live births, which is 1.7 lower than the Current Path forecast and 20.4 lower than the average for lower middle-income countries in Africa.
Chart 18 shows the GDP per capita (PPP) in both the Current Path and Demographic scenario. In 2019, the GDP per capita for Cape Verde was US$7 533, which is US$544 higher than the average for lower middle-income African countries. By 2043, it is estimated that, based on the Demographic scenario, the GDP per capita will increase to US$10 866, which is US$27 more than the projected US$10 839 on the Current Path in the same year. Also, this will be significantly above the US$9 142 average for lower middle-income countries in Africa. The additional increase in GDP per capita as a result of the Demographic scenario can partly be explained by the expected slower population growth, declining fertility rates and economic growth arising from the materialisation of the demographic dividend.
Chart 19 presents the number and portion of people living below the poverty line of US$3.20 in both the Current Path forecast and the Demographic scenario. Based on the Demographic scenario, the number of people surviving under US$3.20 per day will steadily decline from 0.11 million in 2019 to 77 000 in 2043, which will be 1 000 fewer than in the Current Path forecast. Similarly, the proportion of the poor population can be reduced to 11.46% in the Demographic scenario, which is about 0.05 percentage points lower than the Current Path forecast and 26.8 percentage points lower than the average for lower middle-income countries in Africa in 2043. The decline in both the number and portion of the poor based on the Demographic scenario reflects the decline in population as a result of modern contraceptive use that reduces fertility rates among women.
This section presents reasonable but ambitious improvements in the Health/WaSH scenario, which include reductions in the mortality rate associated with both communicable diseases (e.g. AIDS, diarrhoea, malaria and respiratory infections) and non-communicable diseases (NCDs) (e.g. diabetes), as well as improvements in access to safe water and better sanitation. The acronym WaSH stands for water, sanitation and hygiene.
The intervention is explained here in the thematic part of the website.
Chart 20 displays the life expectancy in Cape Verde based on the Current Path forecast and the Health/WaSH scenario. The quality of a nation's health system can be gauged by indicators such as life expectancy, maternal mortality and infant mortality. The life expectancy in Cape Verde was the seventh highest in Africa at 74.2 years in 2019, 6.7 years above the average of 67.5 for lower middle-income countries in Africa. On average, females have a higher life expectancy at birth of 79.2 compared to 69.3 for males. Based on the Health/WaSH scenario, life expectancy is estimated to increase to about 77.7 by 2043, which is slightly above the Current Path forecast of 77.4 and above the average of 73.3 for lower middle-income African countries. This increased life expectancy in the country can be attributed to the expected improvement in access to safe water (by nearly 100% of the population) and sanitation, as well as a reduction in mortality from communicable diseases. However, death from non-communicable diseases continues to be a problem. Females will continue to have a higher life expectancy than males, with a difference of over 10 years by 2043
Chart 21 illustrates the decline in infant mortality according to the Current Path forecast and the Health/WaSH scenario from 2019 to 2043. The infant mortality rate per 1 000 live births in 2019 was 16.2, which is significantly lower than the average of 46.4 for lower middle-income countries in Africa. The Health/WaSH scenario reduces infant mortality more quickly than the Current Path forecast, so that, by 2043, infant mortality per 1 000 live births in the country will be 10.8 compared to 11 in the Current Path forecast.
The Agriculture scenario represents reasonable but ambitious increases in yields per hectare (reflecting better management and seed and fertiliser technology), increased land under irrigation, and reduced loss and waste. Where appropriate, it includes an increase in calorie consumption, reflecting the prioritisation of food self-sufficiency above food exports as a desirable policy objective.
The intervention is explained in here in the thematic part of the website.
The data on yields per hectare (in metric tons) is for crops, but does not distinguish between different categories of crops.
Chart 22 presents the average yield per hectare for crops in the Current Path forecast and the Agriculture scenario from 2019 to 2043. In 2019, the average yield per hectare for crops was 2.8 metric tons, which was below the average of 5.1 metric tons per hectare for lower middle-income countries in Africa. The low crop yield in the country can mainly be attributed to unfavourable climatic conditions in the country. The country is affected by its natural vulnerabilities such as water shortages, poor agricultural land fertility, and others. Based on the Current Path forecast, this is projected to increase to 3.7 metric tons per hectare by 2043. In the Agriculture scenario, the average yield will be 5.5 metric tons per hectare. This means that the adoption of modern methods of farming including the application of fertiliser and usage of improved seeds could significantly improve crop yields in Cape Verde.
Chart 23 represents net agriculture imports as a per cent of agricultural demand in the Current Path forecast and the Agriculture scenario. Cape Verde has a very high agricultural import dependency. The country has a low proportion of arable land: barely 10% of its total land. Agricultural production is worsened by climate change and variability, and scant and unreliable rainfall. In 2019, the net agricultural import was 51.7% of agricultural demand in the country, which was far above the average of 13.3 for lower middle-income countries in Africa. Some imported food items include cereals, fruits and vegetables, beverages, and other foodstuffs. The Current Path forecast is that import dependence will slightly grow to 52.9% of total demand by 2043. The situation is mitigated in the Agriculture scenario such that, by 2043, the country will reduce its imports of agricultural products to 36.4% of total agricultural demand. This is higher than the average for lower middle-income countries by about 23.6 percentage points in the Current Path.
Chart 24 depicts GDP per capita (PPP) in the Current Path forecast and the Agriculture scenario. By 2043, GDP per capita as a result of the Agriculture scenario will increase from US$7 533 in 2019 to US$11 347, constituting an increment of about 50.6% over the period. These estimates will be greater than the projections in the Current Path forecast so that, by 2043, the additional gains from GDP per capita as a result of the Agriculture scenario will be US$508. In the Agriculture scenario, Cape Verde’s GDP per capita will remain above the average for lower middle-income countries in Africa. Indeed, the gap in GDP per capita between Cape Verde and the average for its peer group is projected to widen to US$2 205 in 2043 from US$ 544 in 2019 in the Agriculture scenario.
Chart 25 illustrates the number and portion of people living below the poverty line of US$3.20 a day, in the Current Path forecast and Agriculture scenario. Implementing good agricultural policies that will result in increased yield per hectare and reduction in waste appears to have a significant impact on poverty reduction in the country. Based on the Current Path forecast, 78 000 people, representing 11.5% of the population, are projected to be extremely poor by 2043. However, based on the Agriculture scenario, the number of people below the poverty line of US$3.20 will be reduced to 70 000, constituting 10.4% of the population. This is 8 000 fewer poor people than in the Current Path forecast in 2043. Throughout the period, in the Agriculture scenario, the proportion of people living in extreme poverty in Cape Verde will be lower than the average for lower middle-income countries in Africa, although the gap closes up. By 2043, the poverty rate in Cape Verde will be 27.9 percentage points below the average for lower middle-income countries in Africa.
The Education scenario represents reasonable but ambitious improved intake, transition and graduation rates from primary to tertiary levels and better quality of education. It also models substantive progress towards gender parity at all levels, additional vocational training at secondary school level and increases in the share of science and engineering graduates.
The intervention is explained here in the thematic part of the website.
Chart 26 shows the mean years of education in the Current Path forecast and the Education scenario. In 2019, Cape Verde’s mean years of education was 7.9, which is above the average of 7.2 for lower middle-income countries on the continent. The country has adopted the universal free compulsory primary education policy, which has contributed to improving educational outcomes. By 2014, net primary enrolment was about 93% while net secondary enrolment was 70.1%. Also, only 8.3% of the population had never been to school as of 2014. Moreover, the literacy rate among young people (aged 14–24) was a whopping 97.3%, with a slight gender disparity in favour of women. However, the quality of teaching in various schools has remained a concern at national level. Also, the drop in secondary and higher levels of education continues to be a challenge. In terms of gender, the mean years of education for males is 8.3, compared to the females’ average of 7.6. This means that, on average, men are more likely to attain higher education than women. This gap in favour of men for mean years of education in Cape Verde is lower than the average of 1.3 years for lower middle-income countries in Africa. By 2043, in the Education scenario, it is projected that the mean years of education will rise to 9.4, which will be 0.2 years more than the Current Path estimates and 0.9 years more than the average for lower middle-income countries in Africa. Also, based on the Education scenario forecast, the gender gap regarding mean years of education will reverse in favour of women by 0.1 years. The gender gap in favour of men for the average lower middle-income countries in Africa will also close by 0.5 years within the same period.
Chart 27 displays the average test scores for primary and secondary learners in the Current Path forecast and Education scenario. The average test score for primary learners in Cape Verde for 2019 was 35.5%, which is higher than the 27.7% average for lower middle-income countries in Africa, signifying a relatively higher performance in this regard. The Education scenario will increase the average test scores for primary learners to 46% compared to the Current Path scenario, estimated at 39.6%. Also, the Education scenario for 2043 will result in 10.3 percentage points more than the continental average for lower middle-income countries.
In 2019, the average secondary learner test score for Cape Verde was 40.4%, which is above the average of 35.8% for lower middle-income African countries. This suggests that Cape Verde performs relatively better at secondary level than at primary level. By 2043, the average test scores for secondary learners are projected to rise to 56.7%, which is above the Current Path estimates of 47.2% and the average of 41.8% for lower middle-income countries in Africa.
Chart 28 shows GDP per capita in the Current Path forecast and Education scenario from 2019 to 2043. By 2043, the increment in GDP per capita as a result of the Education scenario is estimated to be US$301 more than the projected US$10 839 in the Current Path forecast. This GDP per capita will also be higher than the average of US$9 142 for lower middle-income countries in Africa. Investment in education significantly impacts economic growth, but it takes time to materialise. It will take more than a decade for a child enrolled in primary school to contribute meaningfully to the economy.
Chart 29 represents the number and portion of poor people living below the poverty line of US$3.20 a day. By 2043, in the Education scenario, it is projected that the number of poor people will be 71 000, representing 10.6% of the population. This means that the Education scenario will contribute to reducing the number of poor people by 7 000 people in 2043 compared to the Current Path forecast. This suggests that improvement in human capital in the country is a sure means of poverty reduction. Also, the proportion of poor people based on the Education scenario in Cape Verde will be 28 percentage points lower than in the Current Path forecast for the average for lower middle-income countries in Africa.
The Manufacturing/Transfers scenario represents reasonable but ambitious manufacturing growth through greater investment in the economy, investments in research and development, and promotion of the export of manufactured goods. It is accompanied by an increase in welfare transfers (social grants) to moderate the initial increases in inequality that are typically associated with a manufacturing transition. To this end, the scenario improves tax administration and increases government revenues.
The intervention is explained here in the thematic part of the website.
Chart 30 should be read with Chart 8 that presents a stacked area graph on the contribution to GDP and size, in billion US$, of the Current Path economy for each of the sectors.
Chart 30 illustrates the percentage points and absolute value of difference in contribution to GDP between the Current Path and the Manufacturing/Transfers scenario. Based on the Manufacturing/Transfers scenario, the service sector will be the largest contributor to GDP, with an absolute contribution that is US$0.41 billion larger than the Current Path forecast in 2043. In the scenario, the share of the service sector in GDP will be 0.55 percentage points larger than the Current Path in 2033, before dropping to 0.44 percentage points in 2043. The manufacturing sector, which is the second-largest contributor, is also projected to contribute an additional US$0.07 billion to GDP by 2043, with its share of GDP 0.06 percentage points larger than in the Current Path forecast. Although the third contributor to GDP in Cape Verde will be ICT, with a contribution of US$0.05 billion, it will overtake manufacturing by 2041, such that, by 2043, its share of GDP will be 0.14 percentage points above that of the manufacturing sector. An important observation to make is that agriculture will be the lowest contributor to GDP, with a declining share projected to be 0.61 percentage points lower than the Current Path forecast by 2043. The declining share of agriculture in Cape Verde’s GDP is an indication of economic transformation, but could also increase food insecurity in the country unless efforts are made to increase productivity. This will require a significant investment in productivity-enhancing and climate-smart technologies.
Chart 31 presents the absolute value and portion of government-to-household welfare transfers under both the Current Path and the Manufacturing/Transfers scenarios. In 2019, total welfare transfers to households were US$0.16 billion. This is projected to increase to US$0.38 billion by 2043 in the Manufacturing/Transfers scenario, constituting an increment of 137% over the period. This is US$0.12 billion more than the US$0.26 billion estimated for 2043 based on the Current Path. This suggests that the Manufacturing/Transfers scenario could lead to an improvement in government welfare transfers of an additional US$0.12 billion compared to the Current Path in 2043.
Chart 32 displays the GDP per capita (PPP) in both the Current Path and Manufacturing/Transfers scenarios. By 2043, it is estimated that GDP per capita in the Manufacturing/Transfers scenario will rise to US$11 576, which is US$737 more than projections of the Current Path in the same year. In the Current Path’s assumptions for other countries, the GDP per capita for Cape Verde by 2043 in the Manufacturing/Transfers scenario will be higher than the average of US$9 142 for lower middle-income countries in Africa.
Chart 33 displays the number and portion of people living below the poverty line of US$3.20 in both the Current Path forecast and the Manufacturing/Transfers scenario. By 2043, the estimated number of people living below the poverty line of US$3.20 as a result of the Manufacturing/Transfers scenario is 62 000, constituting about 9.1% of the population. This translates to 16 000 fewer poor people than in the Current Path forecast in 2043. These findings reveal that efforts to boost investment in the economy, research and development, as well as export promotion will significantly contribute to poverty reduction in Cape Verde. The proportion of poor people in Cape Verde based on the Manufacturing/Transfers scenario in 2043 will be 29.2 percentage points below the Current Path forecast for the average for lower middle-income countries in Africa.
The Leapfrogging scenario represents a reasonable but ambitious adoption of and investment in renewable energy technologies, resulting in better access to electricity in urban and rural areas. The scenario includes accelerated access to mobile and fixed broadband and the adoption of modern technology that improves government efficiency and allows for the more rapid formalisation of the informal sector.
The intervention is explained here in the thematic part of the website.
Fixed broadband includes cable modem Internet connections, DSL Internet connections of at least 256 KB/s, fibre and other fixed broadband technology connections (such as satellite broadband Internet, ethernet local area networks, fixed-wireless access, wireless local area networks, WiMAX, etc.).
Chart 34 displays fixed broadband subscriptions per 100 people in the Current Path forecast and the Leapfrogging scenario. In 2019, the total number of fixed broadband subscriptions was 10 per 100 people, which was far above the average of 3.7 for lower middle-income countries in Africa. In the Current Path forecast, fixed broadband subscription is expected to rise to 38.1 per 100 people. The Leapfrogging scenario will lead to a much greater increase in fixed broadband subscriptions than the Current Path forecast, with a difference of almost 12 subscriptions per 100 people by 2043. In the Leapfrogging scenario, the fixed broadband subscriptions in Cape Verde are higher than the projected average of 26.5 for lower middle-income African countries in 2043.
Mobile broadband refers to wireless internet access delivered through cellular towers to computers and other digital devices.
Chart 35 illustrates mobile broadband subscriptions per 100 people based on the Current Path forecast and the Leapfrogging scenario. Cape Verde had a mobile broadband subscription of 88.5 per 100 people in 2019, which was far greater than the average of 49.1 for lower middle-income countries on the continent. Although between 2024 and 2026 mobile broadband subscriptions in the Leapfrogging scenario rise above the Current Path, in the long run the Leapfrogging and Current Path scenarios converge. By 2043, mobile broadband subscriptions in both the Current Path forecast and the Leapfrogging scenario increase to 153.2 per 100 people, above the average of 147.6 for Africa’s lower middle-income countries.
Chart 36 shows the number and proportion of people with access to electricity. The number of Cape Verdeans who had access to electricity in 2019 was 0.48 million, representing 87.9% of the total population. This is far above the average of 66.3 for lower middle-income countries in Africa. Cape Verde is one of the few African countries that have almost achieved parity in terms of access to electricity between urban and rural areas. A total of 89.1% of people in rural areas had access to electricity, compared to 87.3% in urban centres, in 2019.
This high rate of access to electricity in rural areas can be attributed to the aggressive rural electrification projects that have been embarked on by the country in the past. Since the early 1990s, the country, supported by the Luxembourg cooperation, has implemented a rural electrification programme particularly in areas such as Santo Antão and São Nicolau. This led to a significant increase in electricity access, to above 80% in these two islands. Similarly, between 2007 and 2010, there was a rural electrification programme of about 6 000 connections to the national grid, mainly in areas like Santiago Island – which used to have the lowest rate of access to electricity. Also, the high electricity access rate in rural areas can be explained by the fact that, because there are fewer people residing in the rural areas than in the urban centres, the proportion of access increases even if the absolute connections are few. The number of people with access to electricity in rural areas is estimated to reach 180 000 in 2043, compared to 480 000 in urban centres.
Based on the Leapfrogging scenario, it is projected that, by 2043, about 97% of Cape Verdeans, constituting 0.65 million people, will have access to electricity. This is above the projected average of 81.7% for lower middle-income countries. It is also higher than the 94.2%, reflecting 0.63 million people, in the Current Path forecast. This is equivalent to 20 000 more people than in the Current Path forecast by 2027; almost all rural dwellers will have access to electricity in the Leapfrogging scenario and will later converge with the projections of 99% in the Current Path in 2043. However, in the case of urban dwellers, 96.1% and 92.4% will have access to electricity by 2043 based on the Leapfrogging scenario and the Current Path forecast respectively.
Chart 37 illustrates GDP per capita (PPP) in the Current Path forecast and the Leapfrogging scenario. Widespread access to high-speed Internet can improve a country’s socioeconomic outcomes. Broadband can increase productivity, reduce transaction costs and optimise supply chains, positively affecting economic growth.
Cape Verde’s GDP per capita in the Leapfrogging scenario increases from US$7 533 in 2019 to US$11 238 in 2043. This is US$399 more than in the Current Path forecast in 2043. It is also above the average of US$9 142 for lower middle-income countries in Africa.
Chart 38 depicts the number and proportion of people living below the poverty line of US$3.20 in the Current Path forecast and Leapfrogging scenario. In the Leapfrogging scenario, the number of poor people in 2043 is projected to be 72 000, representing 10.6% of the population. This projection is 6 000 fewer poor people than in the Current Path forecast (78 000 poor people) in 2043. The number of poor people projected in the Leapfrogging scenario is 27.7 percentage points lower than the average for lower middle-income African countries.
The Free Trade scenario represents the impact of the full implementation of the African Continental Free Trade Area (AfCFTA) by 2034 through increases in exports, improved productivity and increased trade and economic freedom.
The intervention is explained in here in the thematic part of the website.
The trade balance is the difference between the value of a country’s exports and its imports. A country that imports more goods and services than it exports in terms of value has a trade deficit, while a country that exports more goods and services than it imports has a trade surplus.
Chart 39 shows the trade balance as a per cent of GDP under both the Current Path forecast and the Free Trade scenario. Cape Verde, like many other African economies, is a net importer of goods and services. In 2019, Cape Verde’s trade deficit represented 21% of GDP, which was far higher than the average of 6.6% for lower middle-income African countries. Although the country exports commodities such as fish, clothing, salt, pouzzolane, rum, animal hides, bananas and coffee, the quantity and value of these goods are limited. The large trade deficit can partly be explained by the fact that the country has no natural resources and an unfavourable climate for agriculture, as well as the inability to develop its industrial sector. As a result, the country relies heavily on imports for survival. The country’s main imports include food, fuel and machinery, mainly from Portugal, the Netherlands, Spain and China. Cape Verde will begin to see an improvement in its trade balance from 2026 in both the Current Path forecast and the Free Trade scenario, although the improvement is much quicker in the former. This upward trend will continue so that by 2043, the projected trade deficit will be 14.4% of GDP in the Free Trade scenario in 2043 – which is much higher than the projected 8.2% of GDP in the Current Path forecast. This suggests that the full implementation of AfCFTA may end up worsening the trade balance of Cape Verde compared to the Current Path. By 2043, Cape Verde’s trade deficit will be 11.2 percentage points higher than the average for lower middle-income African countries.
Chart 40 presents GDP per capita in the Current Path forecast and Free Trade scenario from 2019 to 2043. Trade openness increases technology diffusion and competition, positively affecting productivity growth. The GDP per capita for Cape Verde in the Free Trade scenario is forecast to be US$12 034 by 2043, US$1 195 more than in the Current Path forecast in that year. The GDP per capita for Cape Verde in the Free Trade scenario is US$2 892 larger than the average of US$9 142 for lower middle-income African countries. The findings show that the full implementation of AfCFTA has the potential to significantly enhance economic growth in Cape Verde.
Chart 41 illustrates the number and portion of poor people in the Current Path forecast and Free Trade scenario. In the Free Trade scenario, the number of people living below the poverty line of US$3.20 is 57 000, representing 8.5% of the population. This is three percentage points lower than the Current Path forecast, meaning that the Free Trade scenario has 21 000 fewer poor people than the Current Path forecast in 2043. The proportion of poor people projected in the Free Trade scenario will also be lower than the average for lower middle-income countries in Africa.
The Financial Flows scenario represents a reasonable but ambitious increase in worker remittances and aid flows to poor countries, and an increase in the stock of foreign direct investment (FDI) and additional portfolio investment inflows to middle-income countries. We also reduced outward financial flows to emulate a reduction in illicit financial outflows.
The intervention is explained in here in the thematic part of the website.
Chart 42 depicts the trends in foreign aid as a percentage of GDP in the Current Path forecast and Financial Flows scenario. The total foreign aid received by Cape Verde in 2019 was 7.9% of GDP, above the average of 1.7% for lower middle-income countries in Africa. Cape Verde has been a large beneficiary of foreign aid. In 2010 alone, the country received a total of about US$327 million in aid. The country was the first in Africa to complete the Millennium Challenge Corporation (MCC) Compact of US$110 million in 2010. It also successfully completed the second MCC compact by 2018. The large influx of aid into the country can partly be explained by its democratic stability and relatively good governance. Most of the foreign aid received by Cape Verde is from bilateral sources, mainly from Portugal, other European countries and the EU. For instance, in 2016, over 70% of the US$144 million of ODA received came from bilateral sources. Although foreign aid to Cape Verde in absolute terms is projected to rise, foreign aid as a percentage of GDP is expected to decline such that, by 2043, the total foreign aid received by the country is projected to be 3.8% of GDP under the Financial Flows scenario and 3.7% of GDP in the Current Path forecast. These projections are above the projected average of 0.5% of GDP for lower middle-income African countries.
Chart 43 shows foreign direct investment (FDI) as a percentage of GDP in the Current Path forecast and Financial Flows scenario. The Cape Verdean economy depends heavily on FDI. In 2019, Cape Verde’s total FDI amounted to 8.5% of GDP, which was far above the average of 2.6% for lower middle-income African countries. Political stability, democratic institutions, good governance and economic freedom, as well as effective macroeconomic management, have contributed to the favourable investment climate in the country. For instance, the country is highly rated on the corruption perception index, and there is equal treatment for both local and foreign companies, with only a few regulatory challenges for foreign businesses in Cape Verde. However, FDI in the country is highly focused on a few sectors, mainly the tourism sector. The government has attempted to attract more FDI to other sectors through its investment promotion agency, Cabo Verde TradeInvest, by offering tax incentives and breaks to potential investors in sectors such as ICT. By 2043, it is projected that total FDI to the country will be about 6.6% of GDP in the Current Path forecast. In the Financial Flows scenario, FDI is projected to be about 7.5% of GDP in 2043, which is above both the Current Path forecast and the average for lower middle-income countries on the continent.
Chart 44 represents the absolute value of remittances and remittances as a proportion of GDP in both the Current Path forecast and the Financial Flows scenario. In 2019, the total value of remittances that Cape Verde received amounted to US$0.20 billion, which constituted about 7.8% of GDP. This is significantly above the average of 2.6% of GDP for lower middle-income African countries. The absolute value of remittances and remittances as a percentage of GDP are projected to fall across the forecast horizon. In the Financial Flows scenario, remittances are projected to fall to US$0.17 billion, representing 3.2% of GDP, which will be above the projected average of 2.0% of GDP for lower middle-income African countries. Remittances will decline more quickly in the Current Path forecast so that, by 2043, the total value of remittances in the Current Path forecast will be about US$0.14 billion, representing 2.8% of GDP.
Chart 45 illustrates the trend in GDP per capita in the Current Path forecast and Financial Flows scenario. Cape Verde’s GDP per capita is estimated to increase to US$11 042 by 2043 in the Financial Flows scenario. This represents an increase of US$203 over the Current Path forecast in the same year. It is also higher than the projected average of US$9 142 for lower middle-income countries in Africa by 2043.
Trade openness will reduce poverty in the long term after initially increasing it due to the redistributive effects of trade. Most African countries export primary commodities and low-tech manufacturing products, and therefore a continental free trade agreement (AfCFTA) that reduces tariffs and non-tariff barriers across Africa will increase competition among countries in primary commodities and low-tech manufacturing exports. Countries with inefficient, high-cost manufacturing sectors might be displaced as the AfCFTA is implemented, thereby pushing up poverty rates. In the long term, as the economy adjusts and produces and exports its comparatively advantaged (lower relative cost) goods and services, poverty rates will decline.
Chart 46 depicts the number and portion of poor people respectively who are living below the poverty line of US$3.20 in the Current Path forecast and Financial Flows scenario. In the Financial Flows scenario, the number of people living in extreme poverty is projected to decline to 74 000 in 2043, representing 10.9% of the total population. This translates to 4 000 fewer poor people than in the Current Path forecast in the same year. It is also lower than the projected average poverty rate of 38.3% for lower middle-income countries in Africa.
The Infrastructure scenario represents a reasonable but ambitious increase in infrastructure spending across Africa, focusing on basic infrastructure (roads, water, sanitation, electricity access and ICT) in low-income countries and increasing emphasis on advanced infrastructure (such as ports, airports, railway and electricity generation) in higher-income countries.
Note that health and sanitation infrastructure is included as part of the Health/WaSH scenario and that ICT infrastructure and more rapid uptake of renewables is part of Leapfrogging. The interventions there push directly on outcomes, whereas those modelled in this scenario increase infrastructure spending, indirectly boosting other forms of infrastructure, including those supporting health, sanitation and ICT.
The intervention is explained in here in the thematic part of the website.
Chart 47 shows the number and proportion of people with access to electricity in the Current Path forecast and the Infrastructure scenario. The total number of people with access to electricity in 2019 was 0.48 million, representing 87.9% of the population. This is expected to increase to 0.66 million in 2043, constituting 97.4% of the population, in the Infrastructure scenario. This increment exceeds the projected value of 0.63 million, representing 94.2% of the population, in the Current Path forecast. In terms of rural–urban dichotomy, by 2043 it is projected that all rural dwellers will have access to electricity in the Infrastructure scenario compared to the 99% estimated in the Current Path forecast. However, 96.5% and 92.4% of urban dwellers in the Infrastructure scenario and the Current Path forecast respectively will have access to electricity in 2043, indicating a disparity in access to electricity between urban and rural dwellers in both the Current Path forecast and the Infrastructure scenario.
Indicator 9.1.1. in the Sustainable Development Goals refers to the proportion of the rural population who live within 2 km of an all-season road and is captured in the Rural Access Index.
Chart 48 represents the per cent of the rural population within 2 km of all-weather roads in the Current Path forecast and the Infrastructure scenario. Accessibility to rural areas is important in spurring the socioeconomic development of a country and improving the living standards of the rural population. Better rural roads facilitate trade between rural and urban areas. In 2019, 74.5% of all rural dwellers in Cape Verde resided within 2 km of all-weather roads, which was higher than the average of 61.4% for lower middle-income African countries. In the Infrastructure scenario, this is expected to rise to 85.9% by 2043, higher than the 83.7% projected in the Current Path forecast and the average of 67.8% for lower middle-income countries in Africa.
Chart 49 illustrates GDP per capita in the Current Path forecast and Infrastructure scenario. Increased investment in infrastructure improves connectivity and reduces transaction costs, positively affecting productivity and growth. Cape Verde’s GDP per capita is estimated to rise to US$11 227 by 2043 in the Infrastructure scenario. This is US$388 more than in the Current Path forecast in the same year, and also above the average of US$9 142 for lower middle-income countries in Africa.
Chart 50 shows the number and proportion of poor people living below the poverty line of US$3.20 in the Current Path forecast and Infrastructure scenario. In the Infrastructure scenario, the extreme poverty rate is forecast to be 10.6% in 2043. This corresponds to 72 000 poor people in 2043. The Infrastructure scenario has 6 000 fewer poor people than the Current Path forecast in 2043. Moreover, the poverty rate in the scenario is 27.7 percentage points lower than the projected average of 38.3% for lower middle-income countries in Africa.
The Governance scenario represents a reasonable but ambitious improvement in accountability and reduces corruption, and hence improves the quality of service delivery by government.
The intervention is explained in here in the thematic part of the website.
As defined by the World Bank, government effectiveness ‘captures perceptions of the quality of public services, the quality of the civil service and the degree of its independence from political pressures, the quality of policy formulation and implementation, and the credibility of the government’s commitment to such policies’.
Chart 51 presents the impact of the interventions in the Governance scenario on government effectiveness. It depicts the World Bank government effectiveness quality score in the Current Path forecast and Governance scenario. In 2019, Cape Verde’s score on government effectiveness was 2.7 (out of a maximum of 5), above the average of 1.9 for lower middle-income countries in Africa. In the Current Path forecast and the Governance scenario, government effectiveness is estimated to increase across the forecast horizon. However, the increase in the Governance scenario is slightly higher than the increment in the Current Path forecast. The projected score for government effectiveness in the Governance scenario by 2043 is 3.01, which is 0.01 more than in the Current Path forecast. Also, Cape Verde’s score on government effectiveness for 2043 will be above the average of lower middle-income countries in Africa.
Chart 52 displays GDP per capita in the Current Path forecast and Governance scenario. In the Governance scenario, Cape Verde’s GDP per capita is projected to increase to US$10 965 in 2043, which is US$126 more than in the Current Path forecast and higher than the average of US$9 142 for lower middle-income countries on the continent in the same year. This suggests that good governance in the form of reducing corruption, improvement in quality of service delivery and accountability can enhance economic growth in Cape Verde.
Chart 53 illustrates the number and portion of the poor people in the Current Path and Governance scenario. The proportion of people living below the poverty line of US$3.20 is expected to decline to 11.2% in 2043 in the Governance scenario, which is lower than the 38.3% average for lower middle-income African countries in the same year. It also corresponds to about 2 000 fewer poor people than the 78 000 poor people in the Current Path forecast for 2043.
This section presents projections for carbon emissions in the Current Path for Cape Verde and the 11 scenarios. Note that IFs uses carbon equivalents rather than CO2 equivalents.
Chart 54 shows the estimated tons of carbon emission for Cape Verde in the various scenarios. The total quantity of carbon emitted by Cape Verde in 2019 was 0.18 million tons, and is projected to increase to about 0.47 million tons by 2043. Cape Verde’s carbon emissions are projected to increase in all the scenarios. The intervention with the greatest impact on carbon emissions is the Free Trade scenario, which will lead to Cape Verde emitting 0.41 million tons of carbon in 2043. This is followed by the Manufacturing/Transfers and Agriculture scenarios, with carbon emissions of 0.40 and 0.39 million tons by 2043 respectively.
The Combined Agenda 2063 scenario consists of the combination of all 11 sectoral scenarios presented above, namely the Stability, Demographic, Health/WaSH, Agriculture, Education, Manufacturing/Transfers, Leapfrogging, Free Trade, Financial Flows, Infrastructure and Governance scenarios. The cumulative impact of better education, health, infrastructure, etc. means that countries get an additional benefit in the integrated IFs forecasting platform that we refer to as the synergistic effect. Chart 55 presents the contribution of each of these 12 components to GDP per capita in the Combined Agenda 2063 scenario as a stacked area graph.
Chart 55 displays the synergistic impact of the various scenarios on GDP per capita. The synergistic effect of all the scenarios on GDP per capita is estimated to be about US$676 in 2043. The scenario with the greatest impact on GDP per capita by 2043 is the Free Trade scenario, followed by Manufacturing/Transfers scenario. On the other hand, the scenarios with the least impact on GDP per capita are Health/WaSH and Governance. This suggests that, in the long run, the Free Trade and Manufacturing/Transfers scenarios have the greatest potential to improve economic growth and development in Cape Verde.
Whereas Chart 55 presents a stacked area graph on the contribution of each scenario to GDP per capita as well as the additional benefit or synergistic effect, Chart 56 presents only the GDP per capita in the Current Path forecast and the Combined Agenda 2063 scenario.
Cape Verde’s GDP per capita is estimated to increase to US$15 663 in 2043 in the Combined Agenda 2063 scenario. This is US$4 824 more than the projection based on the Current Path scenario, meaning that the Combined Agenda 2063 scenario will lead to an increase of US$4 824 in GDP per capita in 2043 compared to the Current Path forecast. Likewise, Cape Verde’s GDP per capita under the Combined Agenda 2063 scenario will be above the average for lower middle-income countries in Africa in 2043.The Combined Agenda 2063 scenario shows that a policy push across all the development sectors is necessary to achieve sustained growth and development in Cape Verde.
Chart 57 displays the number and portion of people living below the poverty line of US$3.20 in both the Current Path forecast and the Combined Agenda 2063 scenario. In the Combined Agenda 2063 scenario, the number of poor people will significantly decline such that, by 2043, only 24 000 Cape Verdeans, representing 3.6% of the population, will be living below the poverty line. This means that, compared to the Current Path forecast, an additional 54 000 Cape Verdeans can be moved out of extreme poverty in the Combined Agenda 2063 scenario in 2043. Moreover, the extreme poverty rate in Cape Verde in the Combined Agenda 2063 scenario is 34.7 percentage points above the average of 38.3% for lower middle-income African countries.
See Chart 8 to view the Current Path forecast of the sectoral composition of the economy.
Chart 58 depicts the percentage point difference in contribution to GDP and the value difference between the Combined Agenda 2063 scenario and the Current Path forecast. In the Combined Agenda 2063 scenario, the biggest contributors to GDP in the long run are the service, manufacturing and ICT sectors. By 2043, the service sector will contribute an additional 4.2 percentage points to GDP, which corresponds to US$2.8 billion. Although manufacturing and ICT contribute US$0.21 billion and US$0.25 billion respectively, in terms of percentage points, their contribution corresponds to –2.48% and –0.18 respectively. Agriculture will contribute 1.09 fewer percentage points to GDP by 2043, which is equivalent to about US$0.14 billion.
Chart 59 illustrates the projected size of the economy in the Current Path forecast and the Combined Agenda 2063 scenario. The estimated GDP (MER) for 2043 in the Combined Agenda 2063 scenario in 2043 will be US$8.7 billion, which is higher than the Current Path estimates of US$5.2 billion. This suggests that the size of Cape Verde economy in the Combined Agenda 2063 scenario in 2043 is US$ 3.5 billion larger than it is in the Current Path forecast.
Chart 60 shows the trend in carbon emissions in the Current Path forecast and the Combined Agenda 2063 scenario. The total amount of carbon emitted in 2019 was 0.18 million tons. In the Combined Agenda 2063 scenario, this is projected to rise to 0.47 million tons by 2043. This is higher than the estimates of 0.38 million in the Current Path forecast for 2043, meaning that the Combined Agenda 2063 scenario leads to much higher levels of carbon emissions than the Current Path forecast. The materialisation of the Combined Agenda 2063 scenario would stimulate high economic growth in Cape Verde, but the cost in terms of environmental degradation could also be relatively high. To mitigate the environmental impact of the Combined Agenda 2063 scenario, its implementation should be accompanied by concrete steps to accelerate the energy transition.
Page information
Contact at AFI team is Enoch Randy Aikins
This entry was last updated on 28 May 2026 using IFs v7.63.
Donors and sponsors


Reuse our work
- All visualizations, data, and text produced by African Futures are completely open access under the Creative Commons BY license. You have the permission to use, distribute, and reproduce these in any medium, provided the source and authors are credited.
- The data produced by third parties and made available by African Futures is subject to the license terms from the original third-party authors. We will always indicate the original source of the data in our documentation, so you should always check the license of any such third-party data before use and redistribution.
- All of our charts can be embedded in any site.
Cite this research
Enoch Randy Aikins (2026) Cabo Verde Development Futures. Published online at futures.issafrica.org. Retrieved from https://futures.issafrica.org/geographic/countries/cape-verde/ [Online Resource] Updated 28 May 2026.