 Botswana
Feedback welcome
Our aim is to use the best data to inform our analysis. See our Technical page for information on the IFs forecasting platform. We appreciate your help and references for improvements via our feedback form.
In this entry, we first describe the Current Path forecast for Botswana as it is expected to unfold to 2043, the end of the third ten-year implementation plan of the African Union’s Agenda 2063 long-term vision for Africa. The Current Path in the International Futures (IFs) forecasting model initialises from country-level data that is drawn from a range of data providers. We prioritise data from national sources.
The Current Path forecast is divided into summaries on demographics, economics, poverty, health/WaSH and climate change/energy. A second section then presents a single positive scenario for potential improvements in stability, demographics, health/WaSH, agriculture, education, manufacturing/transfers, leapfrogging, free trade, financial flows, infrastructure, governance and the impact of various scenarios on carbon emissions. With the individual impact of these sectors and dimensions having been considered, a final section presents the impact of the Combined Agenda 2063 scenario.
We generally review the impact of each scenario and the Combined Agenda 2063 scenario on gross domestic product (GDP) per person and extreme poverty except for Health/WaSH that uses life expectancy and infant mortality.
The information is presented graphically and supported by brief interpretive text.
All US$ numbers are in 2017 values
Summary
- Current Path forecast
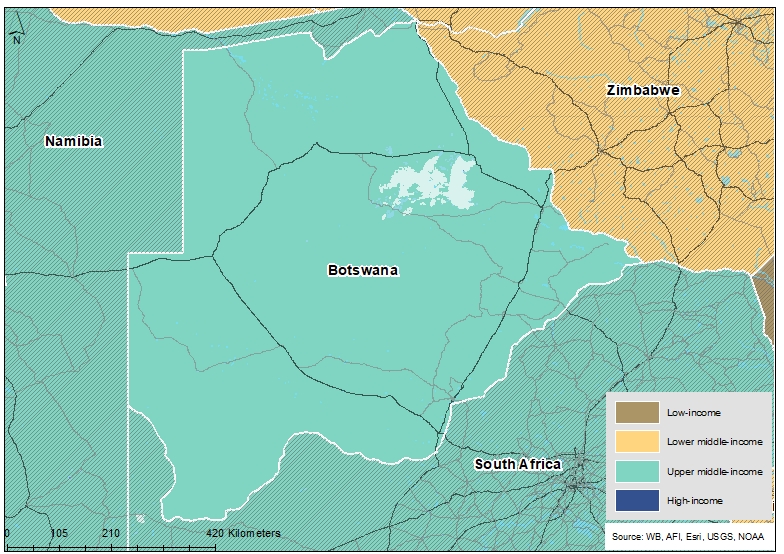
- The Republic of Botswana is a landlocked country located in Southern Africa. It is a member of the Southern African Customs Union (SACU) and the Southern African Development Community (SADC) and is one of seven upper middle-income countries in Africa. Jump to Current Path forecast
- In the Current Path forecast, the population is expected to reach 3.3 million people by 2043, a growth of 960 000 people in the next 24 years. Jump to Demographics: Current Path
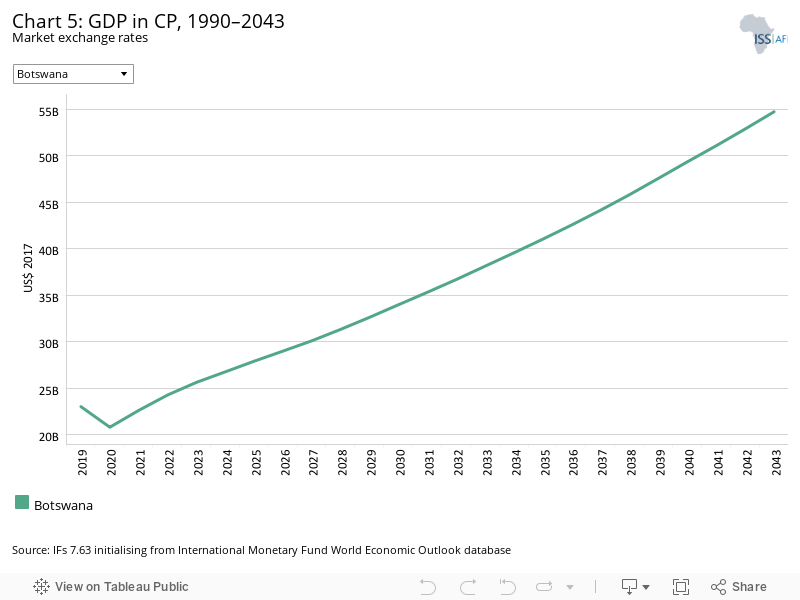
- Botswana has enjoyed sustained economic growth throughout much of its post-independence years. It currently has the fourth largest economy among upper middle-income African countries, with a value of US$23 billion in 2019. In the Current Path forecast, GDP is expected to grow to US$54.8 billion by 2043. Jump to Economics: Current Path
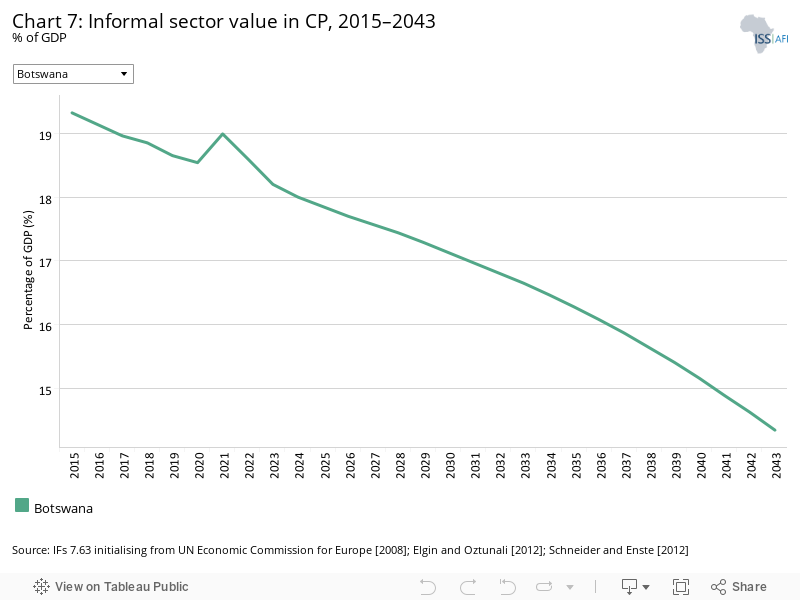
- The country has a small informal sector compared to the rest of Africa and SADC, but it is higher compared to the average for upper middle-income Africa. In the Current Path forecast, the informal sector is likely to decrease rapidly, dropping 0.2 percentage points below the average for upper middle-income Africa by 2043, while the informal labour force will drop by 4 percentage points below the income group’s average. Jump to Economics: Current Path
- Botswana has made great strides in reducing poverty. Using the US$5.50 measure for upper middle-income countries, Botswana still has 45.7% (1.1 million people) of its population living below the poverty line, on par with the average for upper middle-income Africa. Jump to Poverty: Current Path
- Botswana is reliant solely on fossil fuels for meeting domestic electricity demand. In 2019, Botswana’s energy production stood at 13 million barrels of oil equivalent, generated exclusively from coal. This is expected to increase to 72 million barrels of oil equivalent by 2043 in the Current Path forecast, with coal still the sole source of energy production. Jump to Carbon emissions/Energy: Current Path.
- Sectoral scenarios
- The Stability scenario has a positive but small impact on poverty rate reduction and will only benefit the country from 2030 onwards. Poverty rates in this scenario are likely to reach 28.8% by 2043, 0.9 percentage points lower than in the Current Path forecast. Jump to Stability scenario
- In the Current Path forecast, infant deaths will be reduced to 11 deaths per 1 000 live births, significantly below the projected average for upper middle-income Africa. The Demographic scenario positively influences this trajectory and will result in 1.6 fewer deaths per 1 000 live births by 2043. Jump to Demographic scenario
- In 2043, the Health/WaSH scenario will improve life expectancy in Botswana to 75 years, a year more compared to the Current Path forecast. Jump to Health/WaSH scenario
- The Agriculture scenario will benefit Botswana through increasing land access to irrigation and improving yields. In this scenario, Botswana can lower its import dependency to 44% by 2043, down from 57.9% in the Current Path forecast. This, however, still paints a picture of a food-insecure country with heavy dependency on the importation of crops. Jump to Agriculture scenario
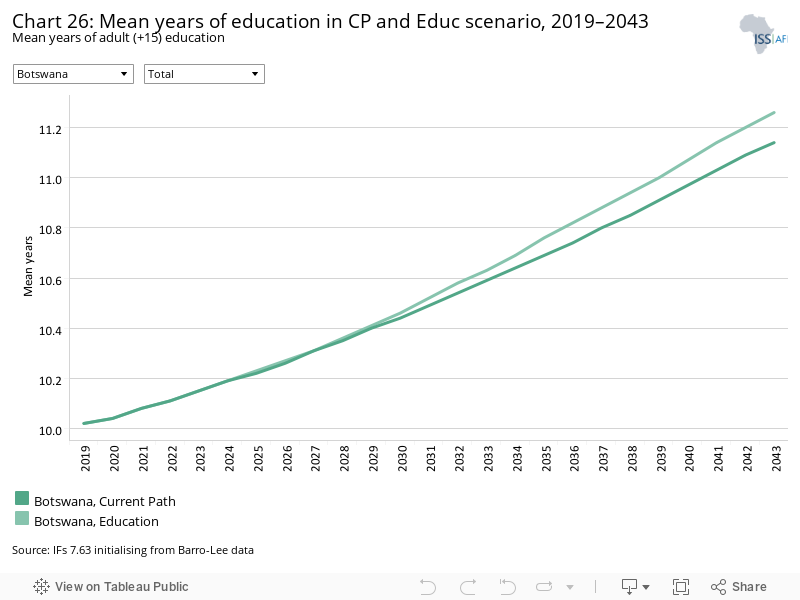
- Botswana’s investment in education, as a per cent of GDP, is the highest in the world, and by 2043 mean years of education will increase to 11.3 years in the Education scenario, 0.2 years above the Current Path forecast. Jump to Education scenario
- The Manufacturing/Transfers scenario will have a significant impact on poverty reduction in the country by 2043. In this scenario, poverty rates are reduced to 24.4%, a 5.3 percentage point reduction compared to the Current Path forecast by 2043. An additional 180 000 people will be lifted out of poverty in the Manufacturing/Transfers scenario compared to the Current Path forecast in 2043. Jump to Manufacturing/Transfers scenario
- At 84.7 subscriptions per 100 people, Botswana has slightly fewer mobile broadband subscriptions than the 86.4 subscriptions for upper middle-income Africa but significantly above the 40.5 subscriptions for Africa in 2019. In the Leapfrogging scenario, mobile broadband subscriptions will increase to 158.9 subscriptions per 100 people by as early as 2025. Jump to Leapfrogging scenario
- By 2043, poverty will drop from 29.7% in the Current Path forecast to 26.9% in the Free Trade scenario, lifting an additional 90 000 people out of poverty. Jump to Free Trade scenario
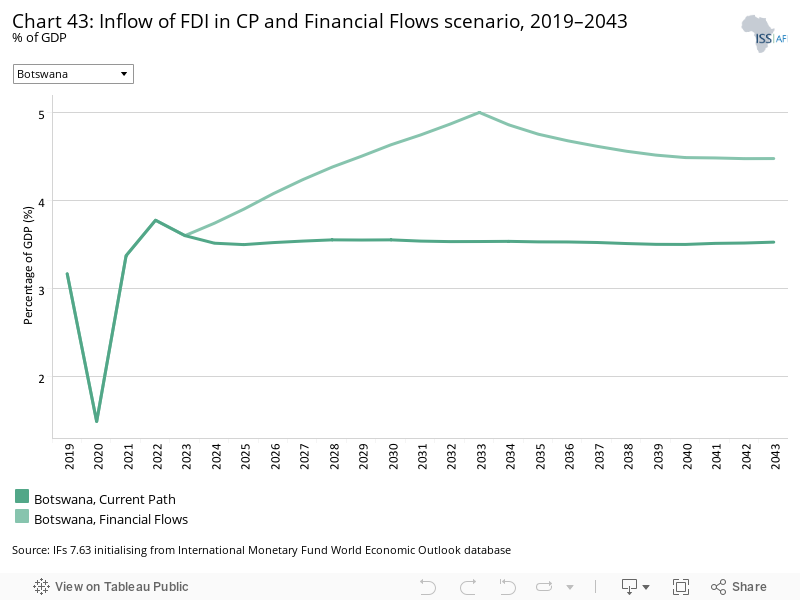
- In 2019, foreign direct investment in Botswana measured above the average for upper middle-income Africa by 0.9 percentage points. In the Financial Flows scenario, foreign direct investment inflows increase to 4.5% of GDP by 2043, 1 percentage point higher than the Current Path forecast. Jump to Financial Flows scenario
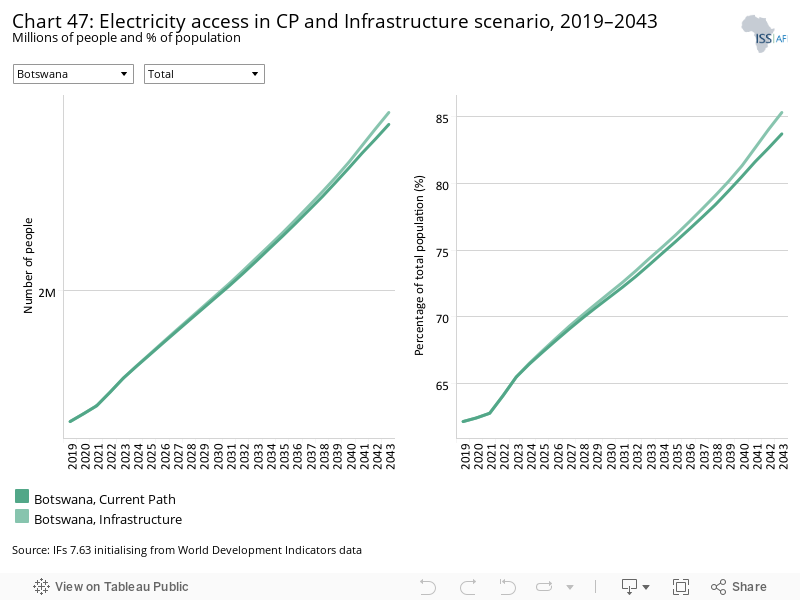
- The Infrastructure scenario increases Botswana’s electricity access to 85.3% in 2043, 1.6 percentage points above the Current Path forecast. It will also address urban-rural access inequality and raise rural access to 71.7% by 2043, 3.1 percentage points above the Current Path forecast. Jump to Infrastructure scenario
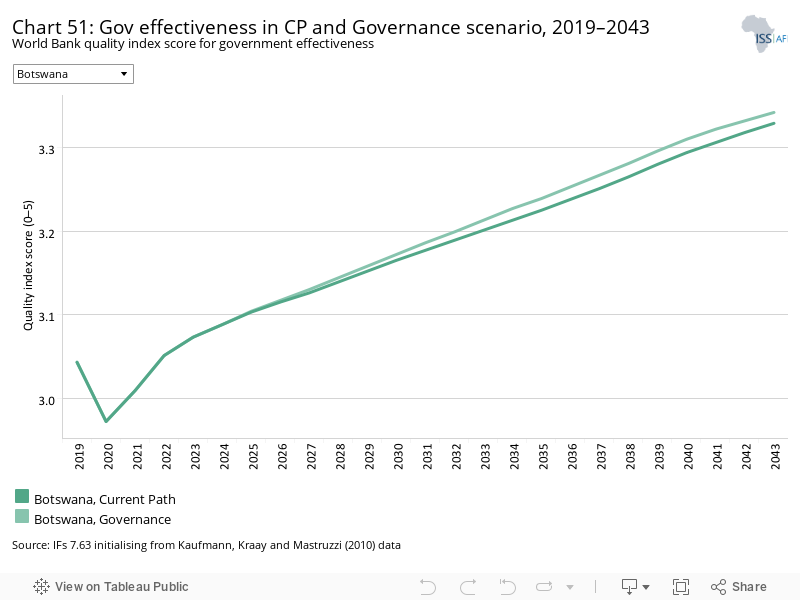
- Botswana boasts a capable state with strong and functioning institutions, and in 2019 it had the second highest government effectiveness score in Africa. The Governance scenario therefore only marginally improves the score from 3 out of 5 in 2019 to 3.3 by 2043. Jump to Governance scenario
- Botswana’s carbon emissions are projected to increase most in the Manufacturing/Transfers scenario, emitting an additional 3.4 million tons of carbon by 2043 compared to 2019, and 0.2 million tons of carbon more than the Current Path forecast for 2043. Jump to Impact of scenarios on carbon emissions
- Combined Agenda 2063 scenario Jump to Combined Agenda 2063 scenario
- Diversifying the economy and continuing to invest in the manufacturing sector (as captured in the Manufacturing/Transfers scenario) will benefit per capita income the most, raising average incomes by as much as US$1 275 in 2043 compared to the Current Path forecast. Jump to Combined Agenda 2063 scenario
- The Combined Agenda 2063 scenario has the potential to raise GDP per capita in Botswana to US$29 594 by 2043, US$5 538 above the Current Path forecast for the same year. Jump to Combined Agenda 2063 scenario
- If Botswana can effectively implement measures as outlined in the Combined Agenda 2063 scenario, poverty can be reduced from 46.7% in 2019 to 19.9% in 2043 using the US$5.50 per day benchmark for upper middle-income countries. Jump to Combined Agenda 2063 scenario
- Botswana’s GDP is forecast to grow to US$73.9 billion by 2043 in the Combined Agenda 2063 scenario, compared to US$54.8 billion in the Current Path forecast, an increase of 35% (or US$19.1 billion). Jump to Combined Agenda 2063 scenario
All charts for Botswana
- Chart 1: Political map of Botswana
- Chart 2: Population structure in CP, 1990–2043
- Chart 3: Urban and rural population in CP, 1990–2043
- Chart 4: Population density map for 2019
- Chart 5: GDP in CP, 1990–2043
- Chart 6: GDP per capita in CP, 1990–2043
- Chart 7: Informal sector value in CP, 2015–2043
- Chart 8: Value added by sector in CP, 2015–2043
- Chart 9: Agriculture production/demand in CP, 1990–2043
- Chart 10: Poverty in CP, 2015–2043
- Chart 11: Energy production by type in CP, 1990–2043
- Chart 12: Carbon emissions in CP, 1990–2043
- Chart 13: Governance security in CP and Stability scenario, 2019–2043
- Chart 14: GDP per capita in CP and Stability scenario, 2019–2043
- Chart 15: Poverty in CP and Stability scenario, 2019–2043
- Chart 16: Demographic dividend in CP and Demog scenario, 2019–2043
- Chart 17: Infant mortality in CP and Demog scenario, 2019–2043
- Chart 18: GDP per capita in CP and Demog scenario, 2019–2043
- Chart 19: Poverty in CP and Demog scenario, 2019–2043
- Chart 20: Life expectancy in CP and Health/WaSH scenario, 2019–2043
- Chart 21: Infant mortality in CP and Health/WaSH scenario, 2019–2043
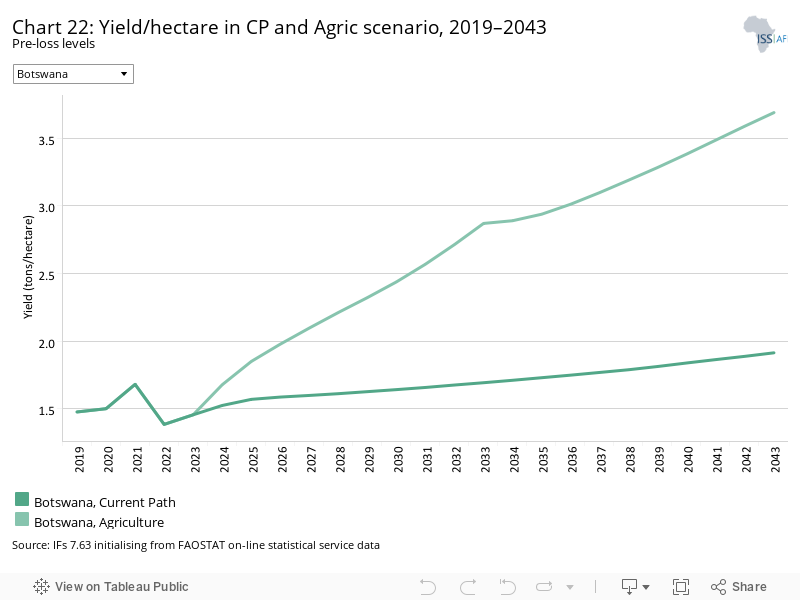
- Chart 22: Yield/hectare in CP and Agric scenario, 2019–2043
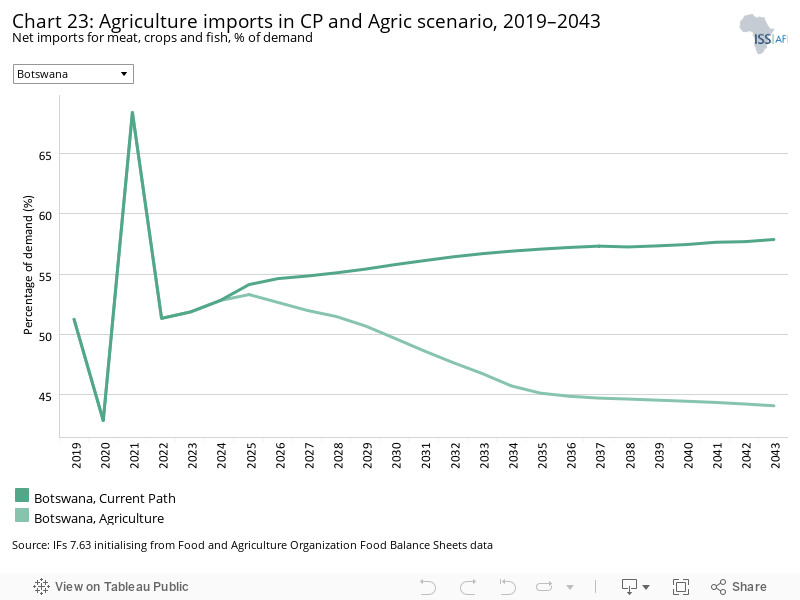
- Chart 23: Agriculture imports in CP and Agric scenario, 2019–2043
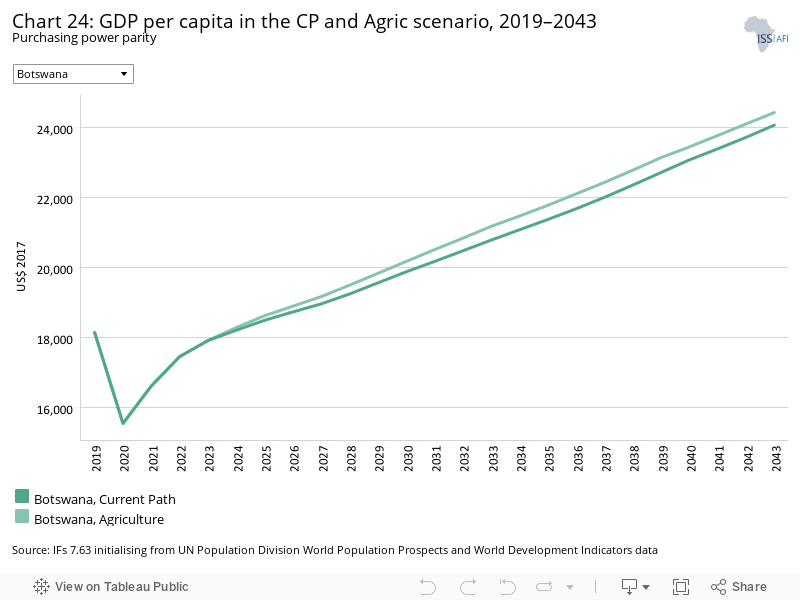
- Chart 24: GDP per capita in the CP and Agric scenario, 2019–2043
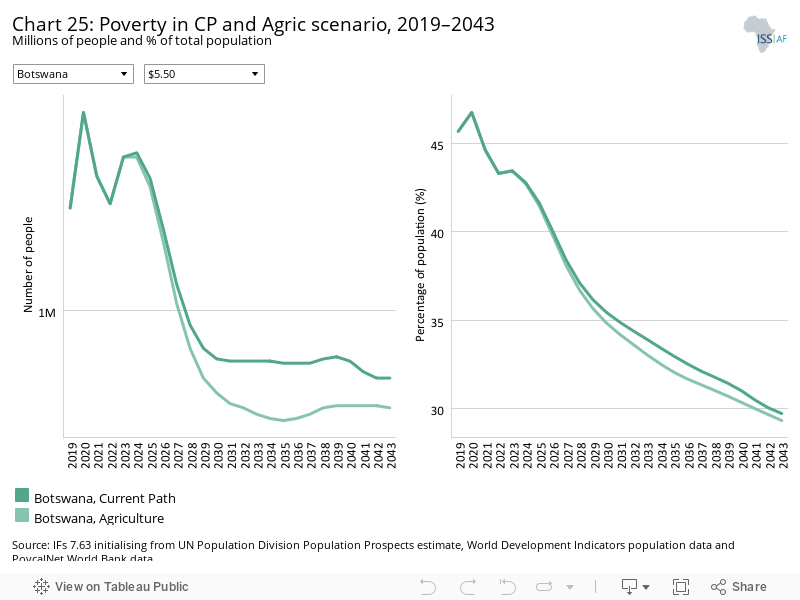
- Chart 25: Poverty in CP and Agric scenario, 2019–2043
- Chart 26: Mean years of education in CP and Educ scenario, 2019–2043
- Chart 27: Education quality in CP and Educ scenario, 2019–2043
- Chart 28: GDP per capita in CP and Educ scenario, 2019–2043
- Chart 29: Poverty in CP and Educ scenario, 2019–2043
- Chart 30: Value added by sector in Current Path and Manufacturing/Transfers scenarios, 2019 to 2043
- Chart 31: Government welfare transfers in Current Path and Manufacturing/Transfers scenarios, 2019 to 2043
- Chart 32: GDP per capita in Current Path and Manufacturing/Transfers scenarios, 2019 to 2043
- Chart 33: Poverty in Current Path and Manufacturing/Transfers scenarios, 2019 to 2043
- Chart 34: Fixed broadband access in CP and Leapfrogging scenario, 2019–2043
- Chart 35: Mobile broadband access in CP and Leapfrogging scenario, 2019–2043
- Chart 36: Electricity access in CP and Leapfrogging scenario, 2019–2043
- Chart 37: GDP per capita in CP and Leapfrogging scenario, 2019–2043
- Chart 38: Poverty in CP and Leapfrogging scenario, 2019–2043
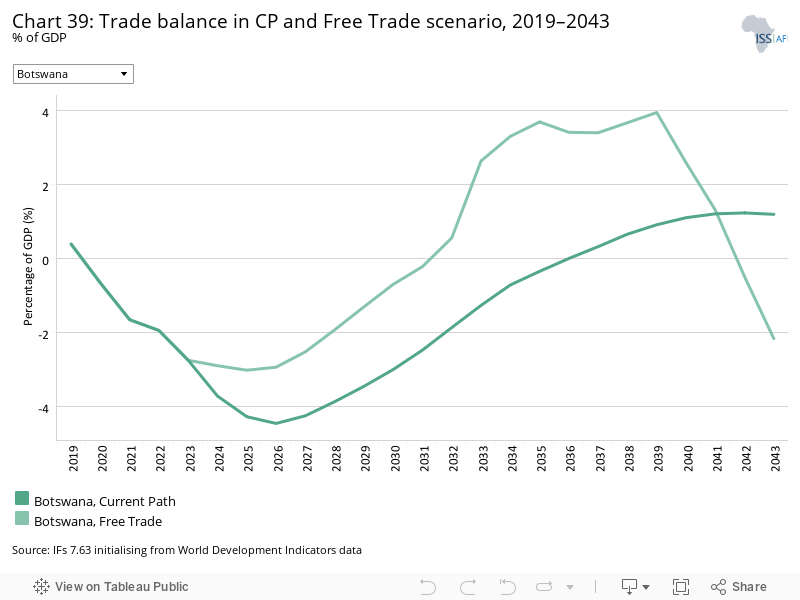
- Chart 39: Trade balance in CP and Free Trade scenario, 2019–2043
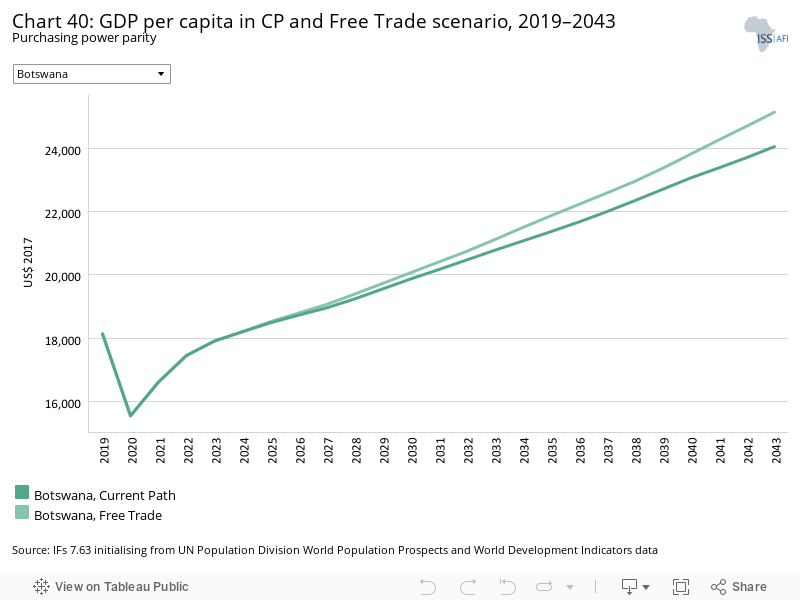
- Chart 40: GDP per capita in CP and Free Trade scenario, 2019–2043
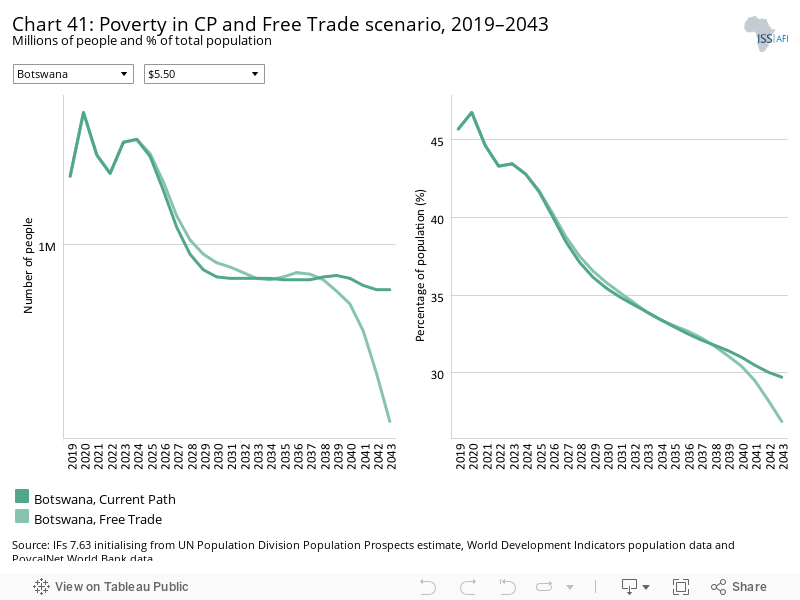
- Chart 41: Poverty in CP and Free Trade scenario, 2019–2043
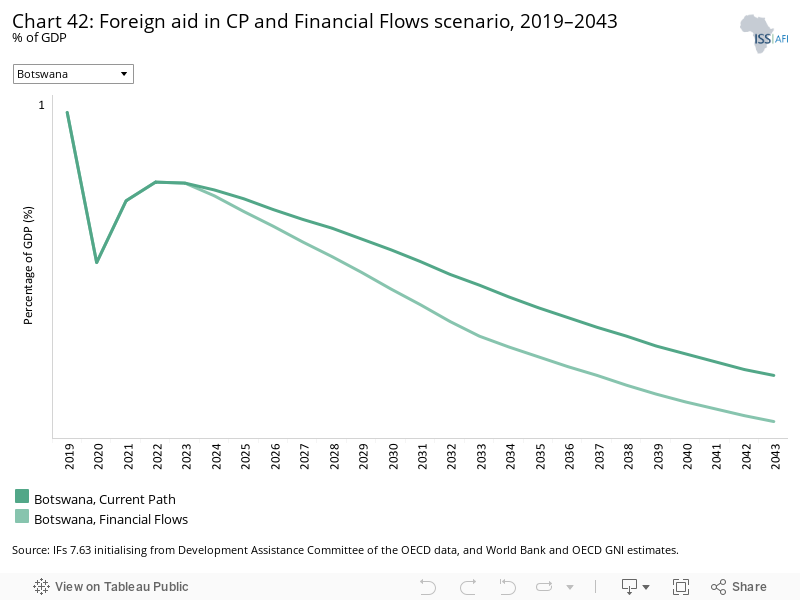
- Chart 42: Foreign aid in CP and Financial Flows scenario, 2019–2043
- Chart 43: Inflow of FDI in CP and Financial Flows scenario, 2019–2043
- Chart 44: Remittances in CP and Financial Flows scenario, 2019–2043
- Chart 45: GDP per capita in CP and Financial Flows scenario, 2019–2043
- Chart 46: Poverty in CP and Financial Flows scenario, 2019–2043
- Chart 47: Electricity access in CP and Infrastructure scenario, 2019–2043
- Chart 48: Rural road access in CP and Infrastructure scenario, 2019–2043
- Chart 49: GDP per capita in CP and Infrastructure scenario, 2019–2043
- Chart 50: Poverty in CP and Infrastructure scenario, 2019–2043
- Chart 51: Gov effectiveness in CP and Governance scenario, 2019–2043
- Chart 52: GDP per capita in CP and Governance scenario, 2019–2043
- Chart 53: Poverty in CP and Governance scenario, 2019–2043
- Chart 54: Carbon emissions in CP and scenarios, 2019–2043
- Chart 55: GDP per capita in CP and scenarios, 2019–2043
- Chart 56: GDP per capita in CP and Combined scenario, 2019–2043
- Chart 57: Poverty in CP and Combined scenario, 2019–2043
- Chart 58: Value added by sector in CP and Combined scenario, 2019–2043
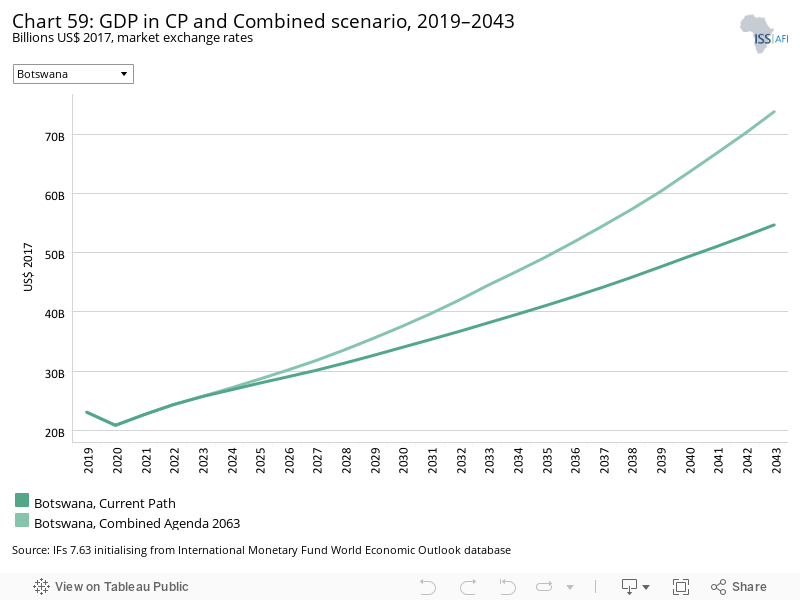
- Chart 59: GDP in CP and Combined scenario, 2019–2043
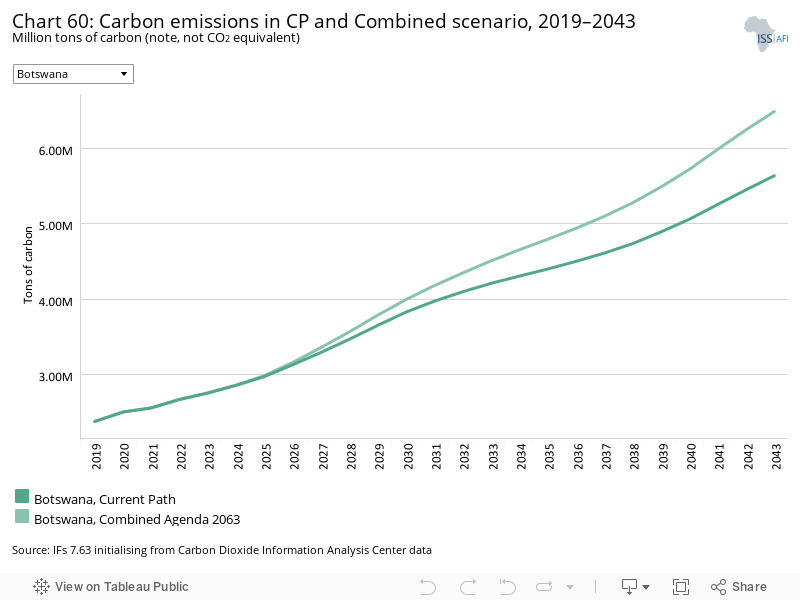
- Chart 60: Carbon emissions in CP and Combined scenario, 2019–2043


This page provides an overview of the key characteristics of Botswana along its likely (or Current Path) development trajectory. The Current Path forecast from the International Futures forecasting (IFs) platform is a dynamic scenario that imitates the continuation of current policies and environmental conditions. The Current Path is therefore in congruence with historical patterns and produces a series of dynamic forecasts endogenised in relationships across crucial global systems. We use 2019 as a standard reference year and the forecasts generally extend to 2043 to coincide with the end of the third ten-year implementation plan of the African Union’s Agenda 2063 long-term development vision.
The Republic of Botswana is a landlocked country located in Southern Africa that gained independence from the United Kingdom in 1966. It is a member of the Southern African Customs Union (SACU) and the Southern African Development Community (SADC) and is one of seven upper middle-income countries in Africa according to the World Bank’s income classification. Botswana shares borders with Zimbabwe to the north-east, South Africa to the south-east and south and Namibia to the west and north. While the narrow salient Caprivi strip in Namibia makes up most of the northern border, Botswana does have a single access point to Zambia over the Kazungula Bridge that crosses the Zambezi river in the far north-eastern corner of the country.
Botswana has a relatively flat topography and consists mostly of a sand-filled basin. The Kalahari Desert makes up most of the surface area of Botswana and covers the Central, Eastern and Southern areas. The northern region is characterised by the inland river delta of the Okavango and a series of salt pans cover the east. The semi-arid country receives erratic rainfall throughout the summer months with a high degree of variance between regions: the north-east region records 576 mm of mean annual rainfall, while in the south-west this drops to less than 280 mm per annum. Rainfall tends to be variable and the past decades have seen two devastating droughts that have had severe impacts on harvests, and ongoing desertification remains a high concern. The country’s scarce water resources also force dependence on groundwater reserves.
The richness of the ecology supports a wide range of animal and bird life. With many well-protected national parks, the country is a popular destination for tourists, and tourism contributed 13% to GDP in 2019. Botswana is a mineral-rich country and mining is a vital part of the economy, with diamond mining generating the vast majority of export earnings. Since independence, the country has achieved robust resource-led growth through sound governance and sound macroeconomic and development policies, funded by diamond mining revenues. However, both the mining and tourism sectors were severely impacted by the COVID-19 pandemic, which resulted in the economy contracting by 7.9% in 2020 and subsequent increases in unemployment and poverty rates. The government is committed to its Botswana Vision 2036 plan to elevate the country to high-income status through diversifying its export-led economy and addressing high poverty and unemployment rates through inclusive and sustainable growth.
Botswana’s development prospects are unpacked in more detail in the subsequent charts.
Botswana’s population of 2.3 million in 2019 ranked the country in 43rd position on the African continent for total population size. The country’s large geographic size resulted in it having the third lowest population density in Africa by 2019, with only Libya and Namibia having fever people per hectare. The total fertility rate has dropped significantly in the past four decades, decreasing from 6.7 births per woman in 1970 to 2.9 in 2019. Low fertility rates and a high prevalence of HIV/AIDS in the late 1990s and early 2000s resulted in a significant drop in population growth rates with negative population growth recorded in 2004 and 2005. In response to this troubling trend, Botswana implemented a comprehensive HIV/AIDS plan, becoming the first country in the region to provide free antiretroviral treatment (ART), significantly reducing AIDS-related deaths and curbing new infections.
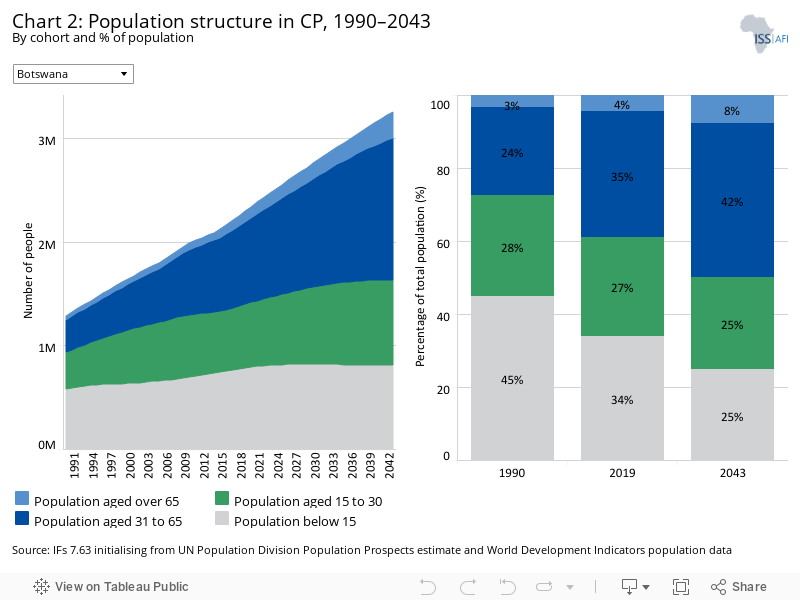
In the Current Path forecast, the population is expected to reach 3.3 million people by 2043, a growth of 960 000 people in the next 24 years. The significant drop in fertility rates and universally free access to ART will continue to alter the age structure of the country with the median age expected to increase from 23.6 years in 2019 to 29.9 years by 2043. This figure is above Africa’s median population age of 20 years in 2019 but significantly below the 27.2 years for upper middle-income Africa in 2019.
Botswana is at an advanced stage of the demographic transition and has a large working-age population (aged 15–64 years) that is expected to continue to grow from 1.4 million (61.6% of total population) in 2019 to 2.2 million (67.4% of total population) in 2043. The country has a small elderly, dependant population with fewer than 100 000 people aged 65 and over in 2019. This figure will more than double, reaching 253 000 by 2043, the result of the large cohort between 30 and 65 years ageing and life expectancy climbing by 7.2 years from 2019 to 2043. Despite the growing elderly dependency, the child dependant population group is expected to shrink from 34.1% of the population in 2019 to 24.8% by 2043.
This demographic transition, together with smaller household sizes, the second lowest in upper middle-income Africa, will propel the country into a demographic dividend starting as early as 2025 and continuing throughout the forecast horizon. The country stands to reap enormous economic benefits from the increasing size of its labour force but needs to implement several reforms to fully maximise the gains from this first dividend.
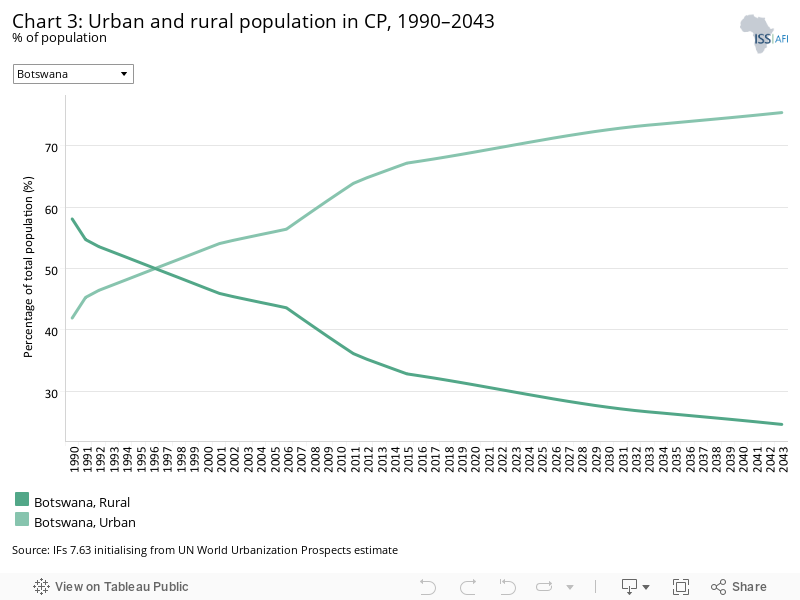
In 1970, Botswana’s urban population was less than 8%. This changed rapidly throughout the 1980s and early 1990s when the country experienced a period of rapid urbanisation. By 1997, the country had more urban than rural dwellers. Botswana now has a predominantly urban population, with nearly 69% of its population living in urban agglomerations in 2019, making the country the eighth most urbanised in Africa. Urban clusters throughout Botswana host 1.6 million urban dwellers and are small and scattered throughout the south-east and east of the country. Only five cities and towns host more than 50 000 people with Gaborone, the capital, hosting around 210 000 dwellers.
The urbanisation rate for Botswana was on par with that of upper middle-income Africa in 2019 but significantly above the 42.8% urbanisation rate for Africa. A sustained but much slower urbanisation rate compared to the 1990s will see Botswana’s urban population grow to over 75% by 2043 and remain above the average for Africa but drop 2.2 percentage points below the average for upper middle-income Africa.
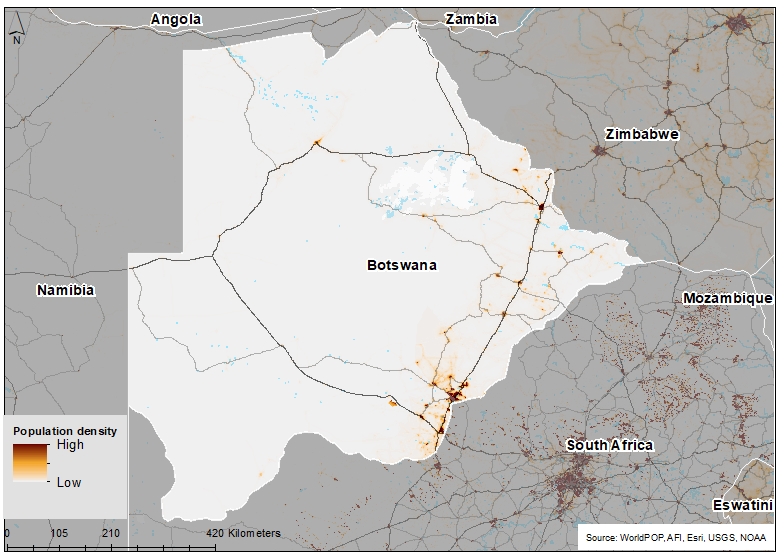
Botswana is just over 581 000 km2 with an average density of 0.04 people per hectare. This low density makes Botswana one of Africa’s most sparsely populated countries, significantly below the 0.4 people per hectare average for Africa. The densities however range from 19 people per hectare in built up areas in Gaborone to uninhabitable lands in the various protected national parks.
The vast majority of Botswana’s population is located in the south-east, in and around the capital of Gaborone. The eastern districts of the country are characterised by scattered and small urban clusters, while Maun is one of the few urban clusters in north-western Botswana. In the Current Path forecast, population density is likely to increase to 0.06 people per hectare by 2043.
Botswana has experienced sustained economic growth throughout much of its post-independence years. The country enjoyed prominent economic growth throughout much of the late 1960s, 1970s and early 1980s. These periods of growth were a direct result of sensible macroeconomic policies, good governance and effective institutions that saw the wealth generated from diamond mining ploughed back into the country. The overdependence of the country’s economy on diamond mining has however made the country especially vulnerable to global diamond demand fluctuations and global economic crises.
Botswana experienced three noticeable economic retractions as a direct result of its mining dependency on diamonds. The first was a demand fluctuation caused by the 1997 Asian financial crises that impacted the economy in 1998/99, the second the result of a global reduction in demand due to the global economic crisis of 2008/09, and the third was the result of a reduction of in-house diamond production that negatively affected the economy in 2015. The country’s economy has also been severely impacted by the COVID-19 pandemic as global tourism and demand for diamonds contracted in 2020.
Botswana currently has the fourth largest economy in upper middle-income Africa with a value of US$23 billion in 2019. The economy is slowly diversifying and the tourism sector and associated services have grown substantially in recent years. The opening up of global borders and the global economic recovery will allow Botswana to recover, and in the Current Path forecast GDP is expected to grow to US$54.8 billion by 2043.
Although many of the charts in the sectoral scenarios also include GDP per capita, this overview is an essential point of departure for interpreting the general economic outlook of Botswana.
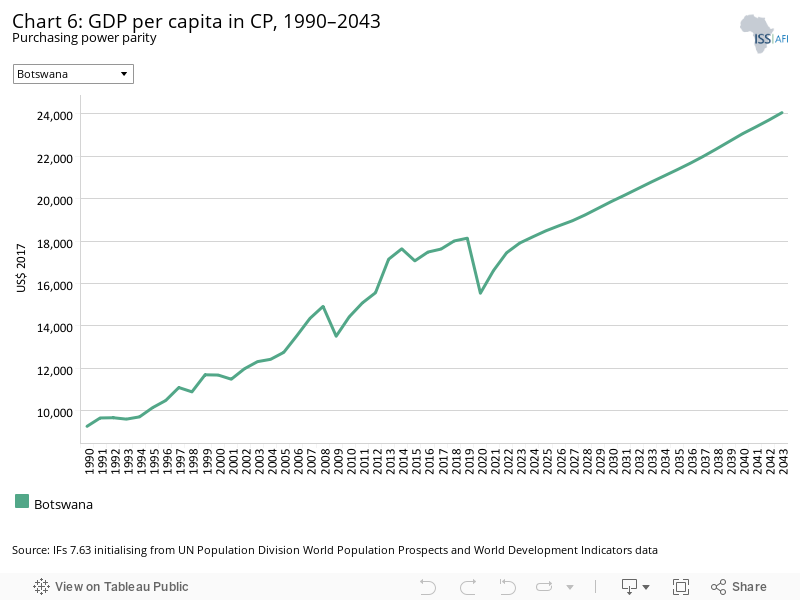
The country’s strong economy, good governance and small population give rise to some of the highest average income levels in Africa. In 2019, Botswana ranked fifth in Africa with regards to GDP per capita with income levels exceeding US$18 000. The country’s GDP per capita is US$3 903 higher than the average for upper middle-income Africa and more than four times higher compared to its regional neighbours in SADC. The gap between Botswana’s income and that of upper middle-income Africa is expected to widen as Botswana’s rate of population growth continues to slow down and the country transitions into a demographic dividend.
In the Current Path forecast, GDP per capita is expected to increase to US$24 056 in 2043, US$6 322 above the average for upper middle-income Africa and US$18 337 above the average income for Africa.
Botswana has a small informal sector compared to the rest of Africa and SADC but is larger than the average size for upper middle-income Africa. In 2019, the size of the informal economy was estimated at 18.7% of GDP, amounting to a value of US$3.9 billion. This is 4.7 percentage points higher than the average for upper middle-income Africa and 3.4 percentage points lower than SADC. In 2019, 28% of Botswana’s labour force worked in the informal economy.
In the Current Path forecast, the informal sector will rapidly decrease in size, dropping 0.2 percentage points below the average for upper middle-income Africa by 2043, while the size of the informal labour force will drop by 4 percentage points. It is expected that the value of the informal sector as a per cent of GDP will decline to 14.4% by 2043. This will amount to an informal economy valued at US$7.2 billion in 2043.
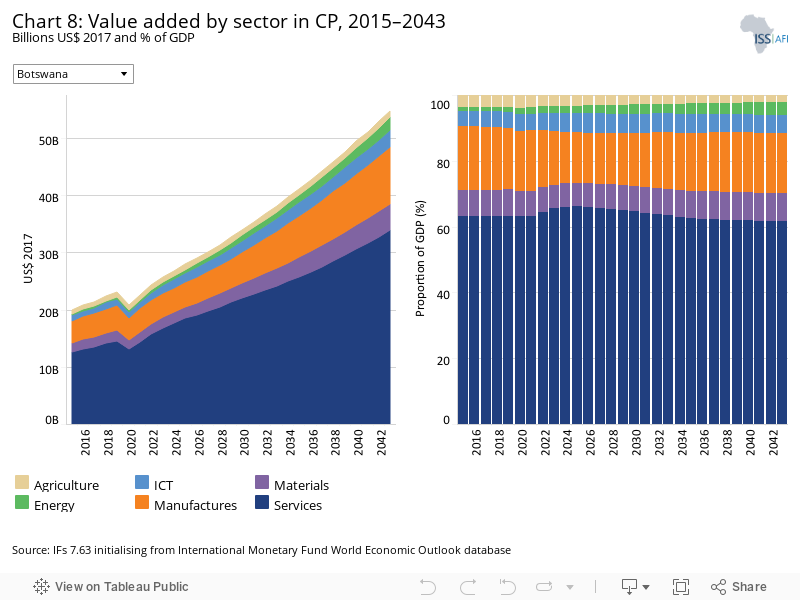
The IFs platform uses data from the Global Trade and Analysis Project (GTAP) to classify economic activity into six sectors: agriculture, energy, materials (including mining), manufactures, services and information and communication technologies (ICT). Most other sources use a threefold distinction between only agriculture, industry and services with the result that data may differ.
Botswana’s economy transformed in the 1970s when diamond mining started taking off. Prior to this discovery, the economy was heavily dependent on agriculture, which constituted as much as 44% of the country’s GDP in 1968. The agriculture sector value-added contribution has shrunk significantly as a per cent of GDP and by 2019 contributed only 3.6%. In the Current Path forecast, the sector will decline to 2.1% with an associated value of US$1.2 billion.
The manufacturing and mineral sectors have played an important role in the economy, their combined value equating to 26.8% of GDP (a value of US$6.1 billion) in 2019. In the Current Path forecast, the contribution of these two sectors remains unchanged at 26.6% in 2043, but the absolute value rises to US$14.5 billion. The service sector has grown significantly in recent years with the tourism industry and its associated services playing an increasingly important role in the economy. In 2019, the service sector constituted 63.4% of GDP (valued at US$14.6 billion), but its relative size is expected to decline slightly, constituting 61.8% of GDP (valued at US$33.8 billion) by 2043.
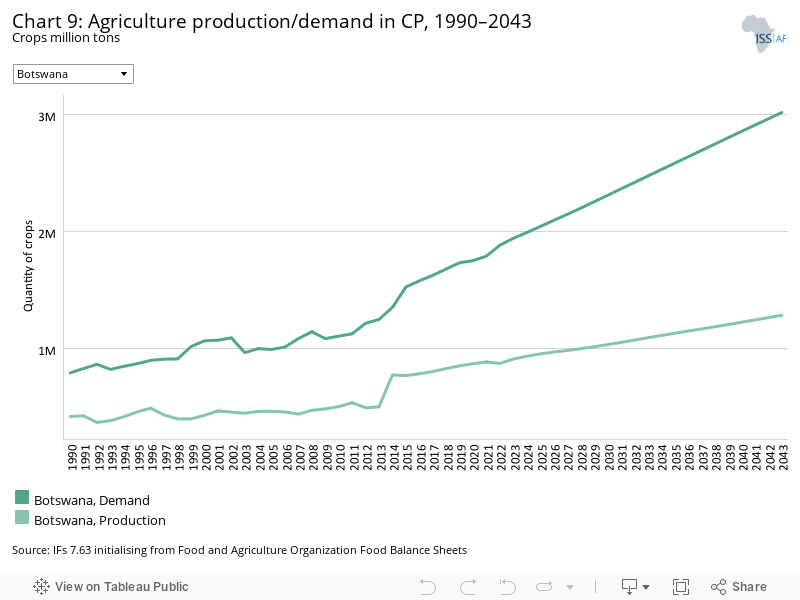
The data on agricultural production and demand in the IFs forecasting platform initialises from data provided on food balances by the Food and Agriculture Organization (FAO). IFs contains data on numerous types of agriculture but aggregates its forecast into crops, meat and fish, presented in million metric tons. Chart 9 shows agricultural production and demand as a total of all three categories.
Botswana has been a net food importer since independence but has become increasingly dependent on importing basic foodstuffs since the investment attention shifted to the extraction of minerals (diamonds) since the 1970s. Botswana’s livestock sector has performed much better than its crop sector, which is heavily dependent on rain-fed agriculture and subsistence farming practices. While Botswana has seen some diversification in its economy, with the tourism industry becoming a prominent player in recent decades, the agriculture sector has continued its decline.
In 1970, agriculture’s contribution to the economy equated to 43.7% of GDP, but its contribution fell to 5.3% in 1986. The significant decline is explained by a variety of challenges facing the sector including: 1) the sector’s reliance on rain-fed agriculture in a drought-prone climate that is extremely vulnerable to rainfall variability, 2) low production volumes and low efficiency levels, 3) a dominant livestock sector which encroaches on protected nature conservation areas, and 4) the over-reliance on diamond extraction. In 2019, agricultural production contributed 3.6% to GDP and in the Current Path forecast is likely to decline further to 2.1% in 2043.
In 2019, agricultural production stood at 850 000 metric tons, while demand stood at 1.74 million metric tons, exceeding production by 890 000 metric tons. This production and demand gap is expected to increase in the Current Path forecast. By 2043, agricultural production is forecast to be 1.3 million metric tons and demand exceeds 3 million metric tons, translating to a 1.7 million metric ton shortfall. This paints a picture of a growing food-dependent country with a heavy importation bill, reliant on and vulnerable to external markets in South Africa and Zimbabwe. The agriculture sector however remains vital in the country’s fight against poverty as a large percentage of rural dwellers are dependent on subsistence, rain-fed agriculture.
There are numerous methodologies for and approaches to defining poverty. We measure income poverty and use GDP per capita as a proxy. In 2015, the World Bank adopted the measure of US$1.90 per person per day (in 2011 international prices), also used to measure progress towards the achievement of Sustainable Development Goal (SDG) 1 of eradicating extreme poverty. To account for extreme poverty in richer countries occurring at slightly higher levels of income than in poor countries, the World Bank introduced three additional poverty lines in 2017:
- US$3.20 for lower middle-income countries
- US$5.50 for upper middle-income countries
- US$22.70 for high-income countries.
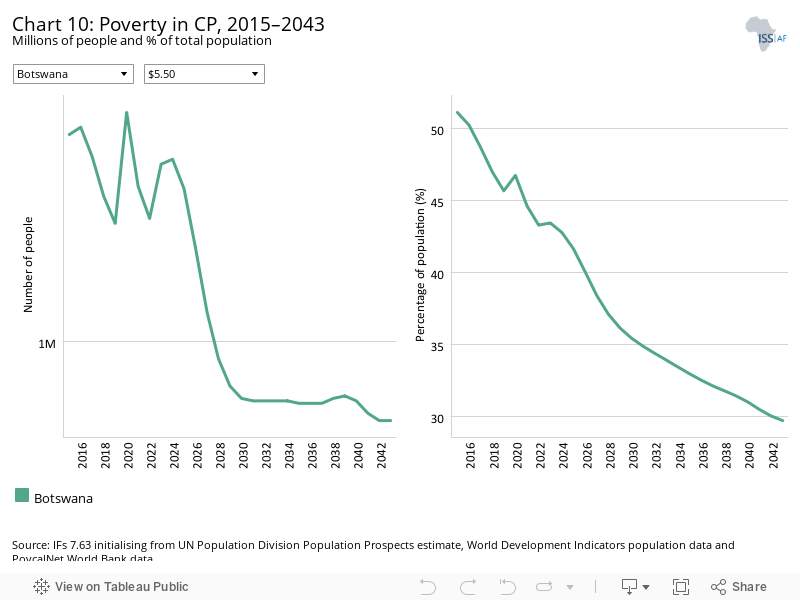
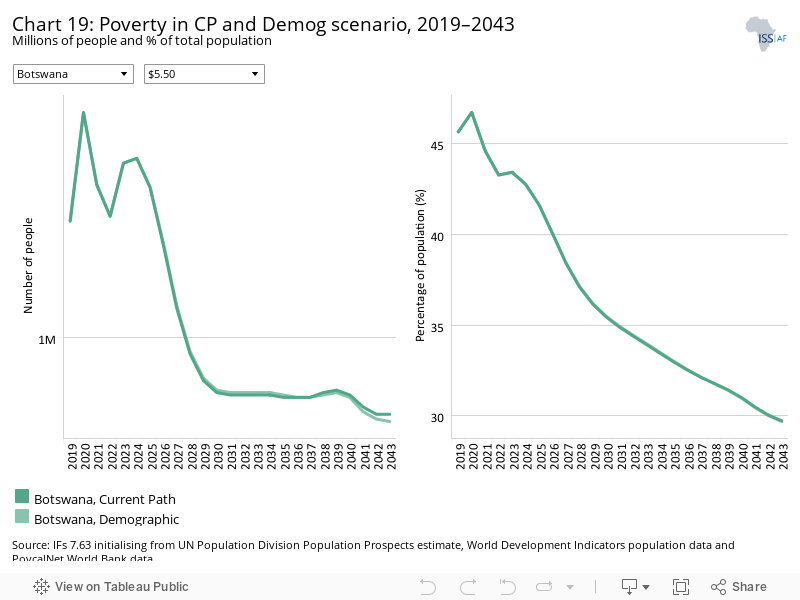
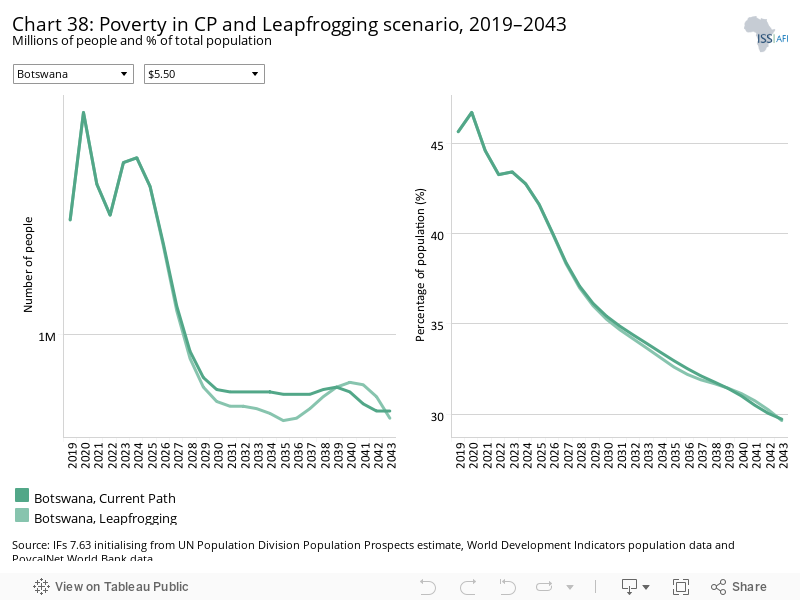
Botswana has made great strides in reducing poverty. In 1980, the country’s poverty rate (using the US$1.90 measure) was 52%. This has dramatically declined and in 2019 it was estimated that 11.8% of the population lived below the US$1.90 poverty level. Using the US$5.50 measure for upper middle-income countries, Botswana still has 45.7% (1.1 million people) of its population living below the poverty line, on par with the average for upper middle-income Africa. Amidst a thriving economy, poverty remains a problem in Botswana and income inequality continues to be a major problem. The country had a Gini index score of 0.53 in 2019, the tenth highest globally, and eighth highest in Africa.
The impact of the COVID-19 pandemic on specifically the country’s diamond exports and tourism sector has resulted in worsening unemployment and poverty levels in 2020. In the Current Path forecast, the poverty rate is forecast to decline as the country recovers and reach 29.7% in 2043 (using the US$5.50 benchmark), ten percentage points below the average for upper middle-income Africa.
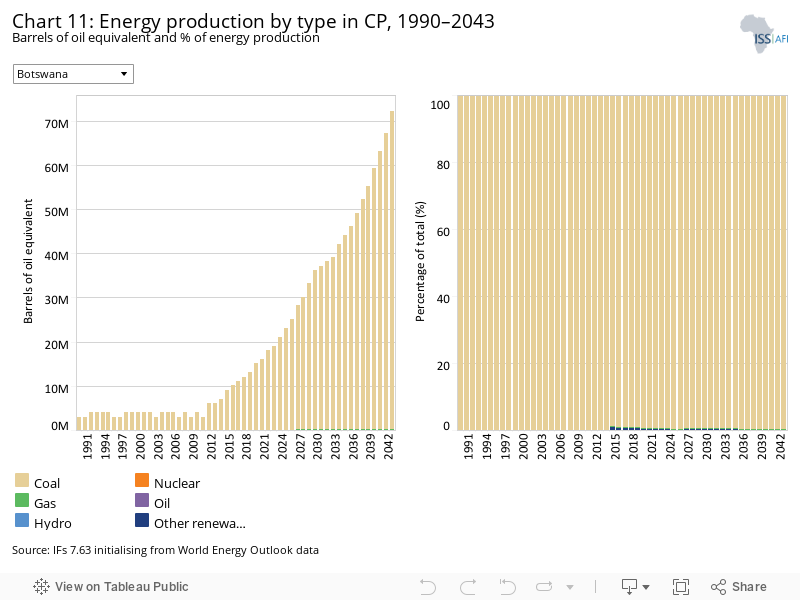
The IFs platform forecasts six types of energy, namely oil, gas, coal, hydro, nuclear and other renewables. To allow comparisons between different types of energy, the data is converted into billion barrels of oil equivalent (BBOE). The energy contained in a barrel of oil is approximately 5.8 million British thermal units (MBTUs) or 1 700 kilowatt-hours (kWh) of energy.
Botswana is reliant solely on fossil fuels for its energy production, using coal and diesel generators to meet domestic electricity demand. A significant portion of the country’s energy requirements are met through imports from South Africa, which is also largely produced through the use of fossil fuels. In 2019, Botswana’s energy production from coal stood at 13 million barrels of oil equivalent. This is expected to increase to 72 million barrels of oil equivalent by 2043. The government has historically shown no real urgency for a green energy transition and renewable energy sources such as solar, wind and bioenergy remain unexploited. Recent developments however, such as the country’s readiness assessment, the new Integrated Resource Plan for electricity and the National Energy Policy has paved the way for the introduction of renewables into the energy mix, as the government targets 15% of energy production being renewable by 2030.
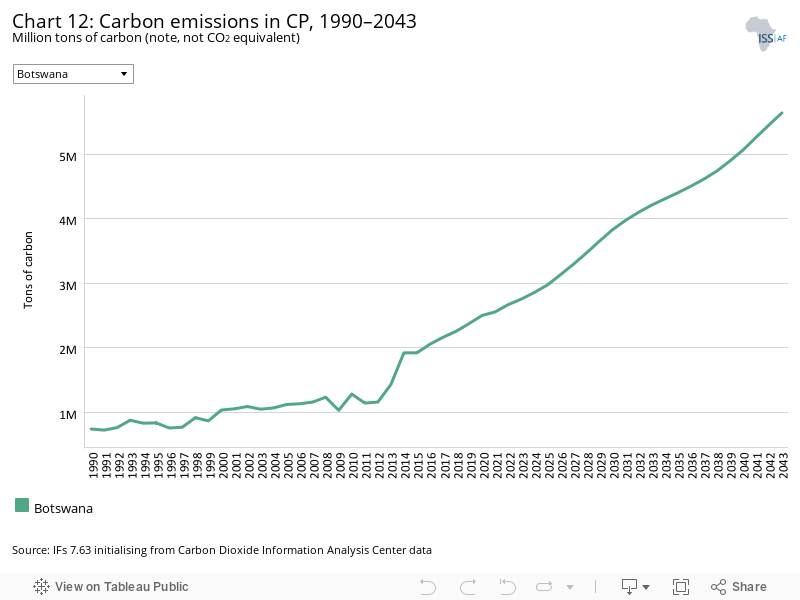
Carbon is released in many ways, but the three most important contributors to greenhouse gases are carbon dioxide (CO2), carbon monoxide (CO) and methane (CH4). Since each has a different molecular weight, IFs uses carbon. Many other sites and calculations use CO2 equivalent.
Despite its reliance on fossil fuels, Botswana remains a low carbon emitter with carbon emissions of 2.3 million tons in 2019. The country’s emissions are dwarfed by neighbouring South Africa, yet it relies on South African energy exports to meet domestic demand. In 2019, Botswana’s emissions placed it in 20th position in Africa and 111th in the world, and among upper middle-income countries in Africa it ranked third. In the Current Path forecast, carbon emissions are likely to increase to 5.6 million tons by 2043, the direct result of the country’s dependency on coal-fired power stations. The country has great renewable (specifically solar) potential and needs to urgently implement its energy plan to bring renewables into the energy mix, as discussed in Chart 11.
Sectoral Scenarios for Botswana
Download to pdfThe Stability scenario represents reasonable but ambitious reductions in risk of regime instability and lower levels of internal conflict. Stability is generally a prerequisite for other aspects of development and this would encourage inflows of foreign direct investment (FDI) and improve business confidence. Better governance through the accountability that follows substantive democracy is modelled separately.
The intervention is explained here in the thematic part of the website.
Botswana has enjoyed a stable political environment post-independence with little perceived historical internal friction. The country’s prudent macroeconomic policies and good governance have generated significant wealth from its mineral (diamonds) resources and it has been spared the “resource curse”. The Botswana Democratic Party (BDP) has been the governing party since independence but recent tension between former president Khama and his successor Masisi has raised concerns about the future of the BDP and what this could mean for Africa’s oldest continuous democracy.
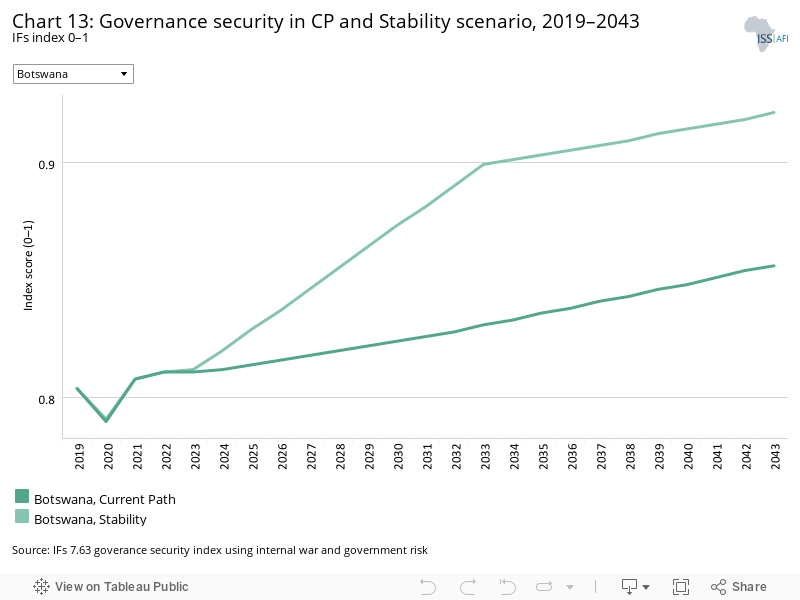
Botswana has and continues to enjoy a very high level of governance security compared to its regional neighbours and its upper middle-income peers. In 2019, it scored the second highest among its income peers with a score nearly 10 percentage points above the average for upper middle-income Africa. Botswana’s governance security index score of 0.8 is also significantly above the 0.66 average for SADC and the 0.69 average for Africa. Botswana performs above the average for its income peers in governance transparency, effectiveness, security and economic freedom, and it was considered the second least corrupt country in Africa, behind only the Seychelles in 2019.
Due to this high overall governance security, the country will gain less from the stability interventions than its upper middle-income peers and its regional neighbours in SADC. Still, the country gains 6% on the governance security index by 2043 compared to SADC, while upper middle-income Africa stands to benefit from a 10% increase.
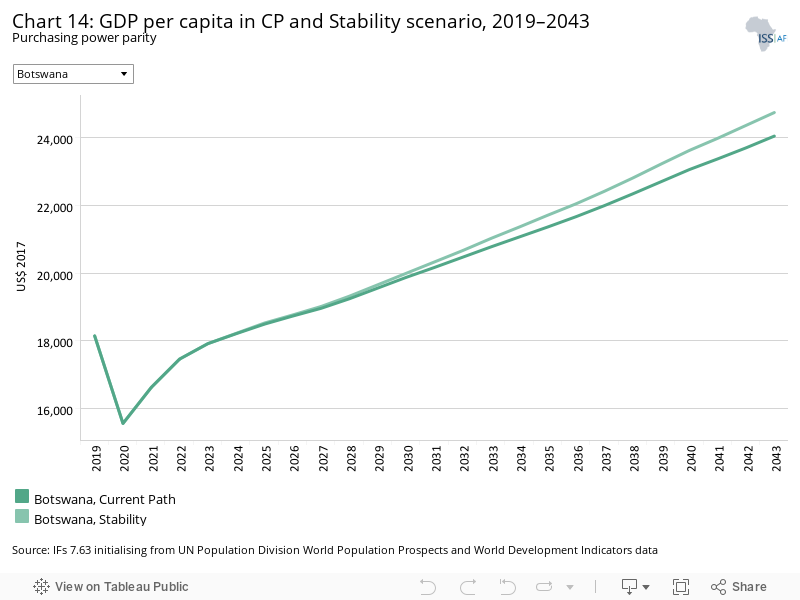
In the Stability scenario, GDP per capita will grow from US$18 138 in 2019 to US$24 754 in 2043, US$698 more than in the Current Path forecast for the same year. In both the Current Path forecast and the Stability scenario, the GDP per capita remains significantly above the average for upper middle-income African countries throughout the forecast horizon to 2043.
The Stability scenario has a positive but small impact on the poverty rate and will only benefit the country from 2030 onwards. Poverty rates in this scenario are likely to reach 28.8% by 2043, 0.9 percentage points lower than in the Current Path forecast. The Stability scenario would therefore lift an additional 30 000 people out of poverty. Poverty rates will remain significantly below the average for upper middle-income Africa.
This section presents the impact of a Demographic scenario that aims to hasten and increase the demographic dividend through reasonable but ambitious reductions in the communicable-disease burden for children under five, the maternal mortality ratio and increased access to modern contraception.
The intervention is explained here in the thematic part of the website.
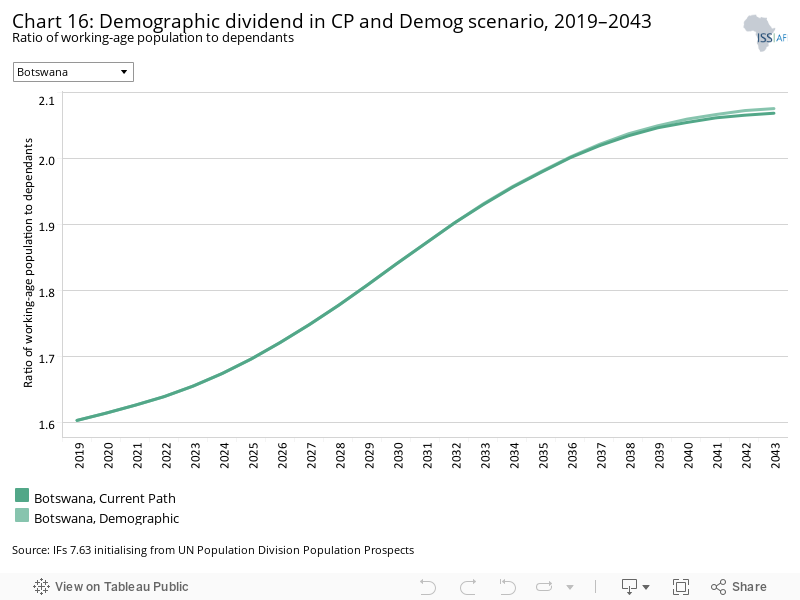
Demographers typically differentiate between a first, second and even a third demographic dividend. We focus here on the contribution of the size of the labour force (between 15 and 64 years of age) relative to dependants (children and the elderly) as part of the first dividend. A window of opportunity opens when the ratio of the working-age population to dependants is equal to or surpasses 1.7.
Botswana is at a more advanced stage of the demographic transition compared to Africa and is on the cusp of a demographic dividend. Botswana has a high ratio of working-age population to dependants and in 2019 this ratio was 1.6. In the Current Path forecast, the large working-age population is expected to continue to grow from 1.4 million, 61.6% of the total population, in 2019 to 2.2 million, or 67.4% of the total population, in 2043. Botswana lags behind the 1.85 average ratio for upper middle-income Africa but is substantially above the 1.27 average for Africa and the 1.23 average for SADC. In the Current Path forecast, the country will enter its demographic dividend window by 2025, although a recent study has argued that Botswana has already entered this window of opportunity.
Due to the advanced stage of the demographic transition in Botswana, the Demographic scenario does not significantly impact population growth rates. In both the Current Path forecast and the Demographic scenario, Botswana enters a ratio of 1.7 by 2025 and remains within this window throughout the forecast horizon, surpassing the average ratio for upper middle-income Africa in 2040.
The infant mortality rate is the number of infant deaths per 1 000 live births and is an important marker of the overall quality of the health system in a country.
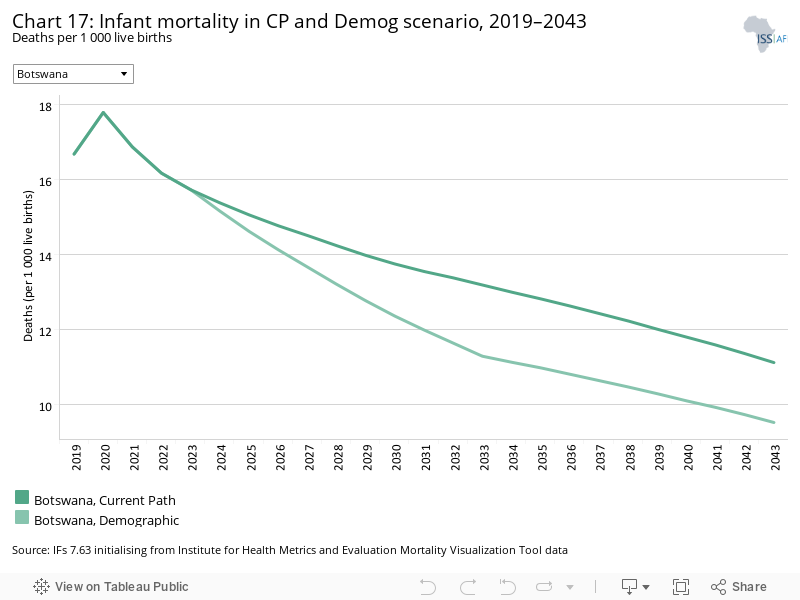
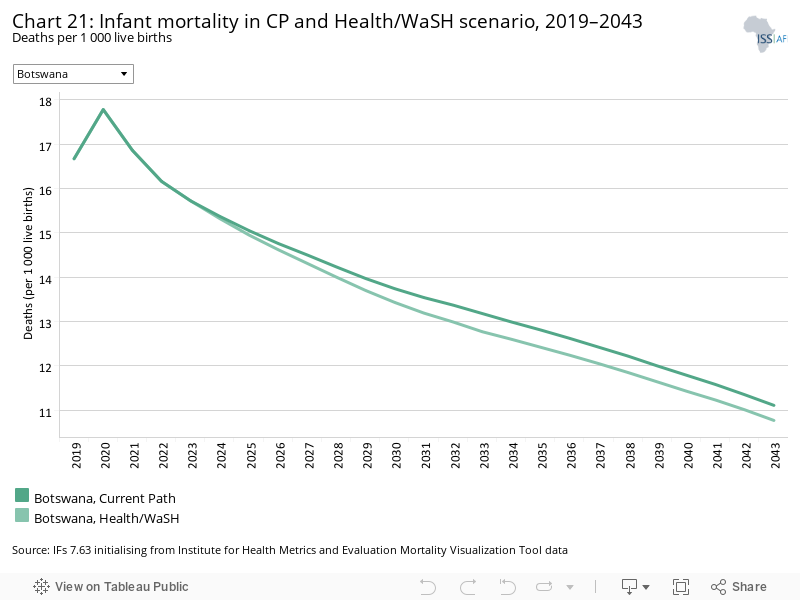
Infant mortality rates in Botswana have significantly and remarkably dropped since 1960. In 1960, deaths per 1 000 live births stood at 78 and by 2019 this figure had dropped to 17, the sixth lowest in Africa. The infant mortality rate in Botswana is 14 deaths per 1 000 live births lower than the average for upper middle-income Africa and nearly 30 lower compared to SADC.
Botswana has performed remarkably well in this development area, however, the period from the mid-1990s to 2004 was marked by a noticeable increase in infant deaths as a direct result of the HIV/AIDS pandemic that ravaged the country. The trends have been reversed since the roll-out of access to ART and a programme that focused on the prevention of mother to child transmission. In the Current Path forecast, infant mortality will be reduced to 11 deaths per 1 000 live births by 2043, still significantly below the 25 expected for upper middle-income Africa. The Demographic scenario positively influences this trajectory and will result in 1.6 fewer deaths per 1 000 live births by 2043.
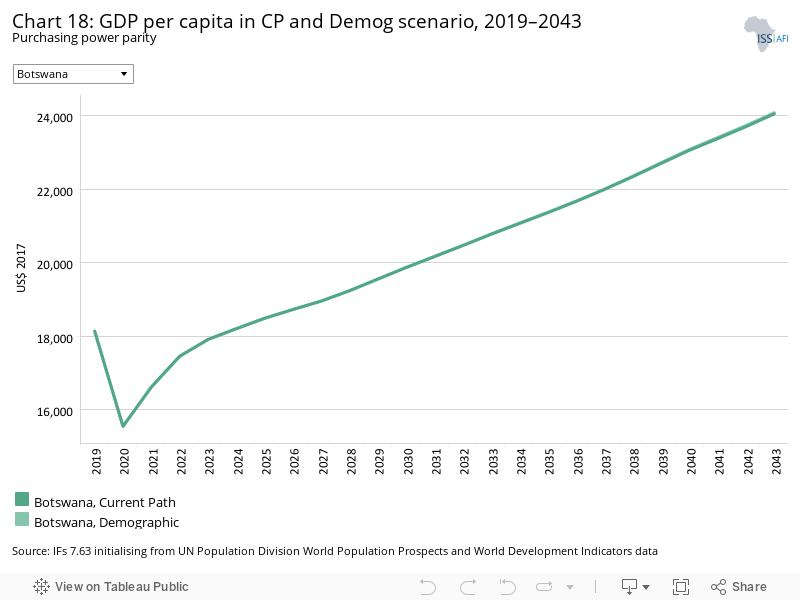
Botswana’s demographic composition has already transitioned to a more advanced stage due to much lower fertility rates over an extended time. The interventions proposed in the Demographic scenario therefore offer little to no impact on the income of the population as Botswana enters (or continues) its first demographic dividend. By 2043, Botswana’s GDP per capita is expected to increase by only US$33 above the Current Path forecast resulting in a per capita income of US$24 089. The GDP per capita gap between Botswana and the average for upper middle-income countries is forecast to grow in the Demographic scenario from US$3 903 in 2019 to US$6 300 by 2043.
This section presents reasonable but ambitious improvements in the Health/WaSH scenario, which include reductions in the mortality rate associated with both communicable diseases (e.g. AIDS, diarrhoea, malaria and respiratory infections) and non-communicable diseases (NCDs) (e.g. diabetes), as well as improvements in access to safe water and better sanitation. The acronym WaSH stands for water, sanitation and hygiene.
The intervention is explained here in the thematic part of the website.
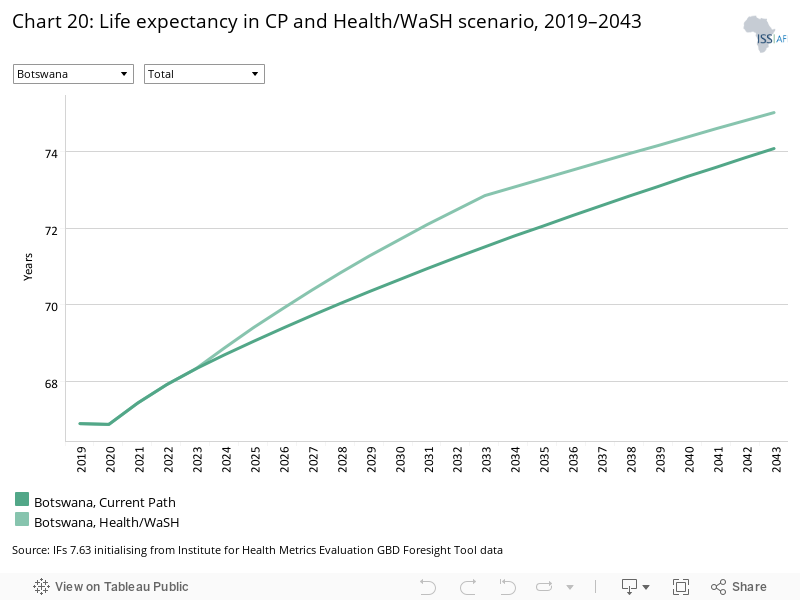
At the turn of the century, during the height of the HIV/AIDS pandemic in Botswana, the country’s life expectancy plummeted to 45 years and was ranked 50th on the continent. It has since improved significantly, and in 2015 it reached 65 years — the same levels attained in 1990 before the pandemic took hold. In 2019, life expectancy stood at 67 years, the third highest among upper middle-income Africa, a remarkable improvement of 22 years since the turn of the century. Currently, Botswana’s life expectancy is 4 years above its regional neighbours in SADC.
In the Current Path forecast, Botswana’s life expectancy is expected to continue improving, reaching 74.1 years by 2043, 4 years above the average for upper middle-income countries in Africa. Continued investment in the reduction of both communicable diseases (AIDS) and non- communicable diseases will reduce mortality rates and, in the Health/WaSH scenario, it is expected that life expectancy will increase by nearly a year in 2043 compared to the Current Path forecast.
The Health/WaSH scenario will have a positive impact on reducing infant deaths compared to the Current Path forecast, although only by a small margin. This scenario will lower the infant mortality rate to 10.8 deaths per 1 000 live births by 2043, 0.3 deaths fewer compared to the Current Path forecast.
The Agriculture scenario represents reasonable but ambitious increases in yields per hectare (reflecting better management and seed and fertiliser technology), increased land under irrigation and reduced loss and waste. Where appropriate, it includes an increase in calorie consumption, reflecting the prioritisation of food self-sufficiency above food exports as a desirable policy objective.
The intervention is explained here in the thematic part of the website.
The data on yield per hectare (in metric tons) is for crops but does not distinguish between different categories of crops.
Botswana does not boast great agricultural crop production potential. The country only cultivates 0.3 million hectares of crop land, and with limited access to water resources and cyclic droughts, the country is likely to remain dependent on the importation of basic foodstuffs. In 2019, crop production stood at 0.4 million metric tons with a demand of 1.2 million metric tons. Beef is Botswana’s primary agricultural product with meat production standing at 0.5 million metric tons in 2019 and a demand of 0.6 million metric tons. Only 45% of Botswana’s surface area is considered suitable for grazing.
In 1970, the agricultural contribution to GDP stood at 43.7%, but by 2019 the sector’s contribution had dropped to 3.6%. While this is a reflection of the changing nature of Botswana’s economy after the exploration of minerals (diamonds), it also reflects the reluctance of the sector to innovate and become more resilient against climate shocks.
In 2019, agricultural yields in Botswana stood at 1.5 metric tons per hectare, 3.2 tons per hectare less than the average for upper middle-income countries in Africa and 2.4 metric tons per hectare less than the average for Africa. In the Agriculture scenario, it is forecast that yields will increase to 3.7 metric tons per hectare by 2043. The Agriculture scenario will improve yields with 1.8 metric tons per hectare compared to the Current Path forecast in 2043.
Botswana is extremely vulnerable to food insecurity and relies heavily on South Africa and Zambia for food imports. In 2019, total agricultural demand exceeded production, accounting for a 51.2% import dependency. In the Current Path forecast, demand is projected to continue exceeding production, resulting in a significant import dependency of 57.9% by 2043.
The Agriculture scenario will benefit Botswana by increasing land access to irrigation and improving yields. In this scenario, Botswana can lower its import dependency to 44% by 2043, down from 57.9% in the Current Path forecast. This, however, still paints a picture of a food-insecure country with heavy dependency on the importation of crops.
By 2043, the Agriculture scenario will have a modest impact on GDP per capita, increasing income by US$360 over the Current Path forecast. This will result in a GDP per capita income of US$24 416 in 2043. Income will remain significantly above the average for upper middle-income countries in Africa with a growing income gap throughout the forecast horizon.
Botswana has limited agricultural potential due to a lack of arable land and limited water resources. Additionally, only 11.4% of the labour force was employed in the agriculture sector in 2019, and this share is projected to drop to 7.2% by 2043. The livestock sector is already performing well, limiting the potential impacts of agricultural interventions. The Agriculture scenario will therefore have a small impact on poverty reduction in the country by 2043. The scenario has an immediate impact on reducing poverty in the short term but will only reduce poverty by 0.4 percentage points compared to the Current Path forecast in 2043, lifting an additional 20 000 people out of poverty.
The Education scenario represents reasonable but ambitious improved intake, transition and graduation rates from primary to tertiary levels and better quality of education. It also models substantive progress towards gender parity at all levels, additional vocational training at secondary school level and increases in the share of science and engineering graduates.
The intervention is explained here in the thematic part of the website.
Botswana spends a gigantic 11.7% of its GDP on education, the highest percentage globally. Foundational phase education is provided in Setswana to optimise learning comprehension, after which the education system embraces English as the main medium. Literacy rates are high, measuring 87.6% in 2019 and are expected to reach 98% by 2043 in the Current Path forecast. Primary and the first three years of secondary education are provided for free and there is a very low learner to teacher ratio.
The mean years of education in Botswana, measuring 10 in 2019, is slightly higher than the 9.8 average for upper middle-income Africa and significantly higher than the 6.2 average for Africa. Mean years of education among the female population group is however 0.3 years lower than male attendance.
Botswana’s investment in education, as a share of GDP, is the highest in the world and by 2043 this will bear dividends, as mean years of education reaches 11.1 years in the Current Path forecast. In the Education scenario, Botswana will reach a mean of 11.3 years in 2043, 0.2 years above the Current Path forecast.
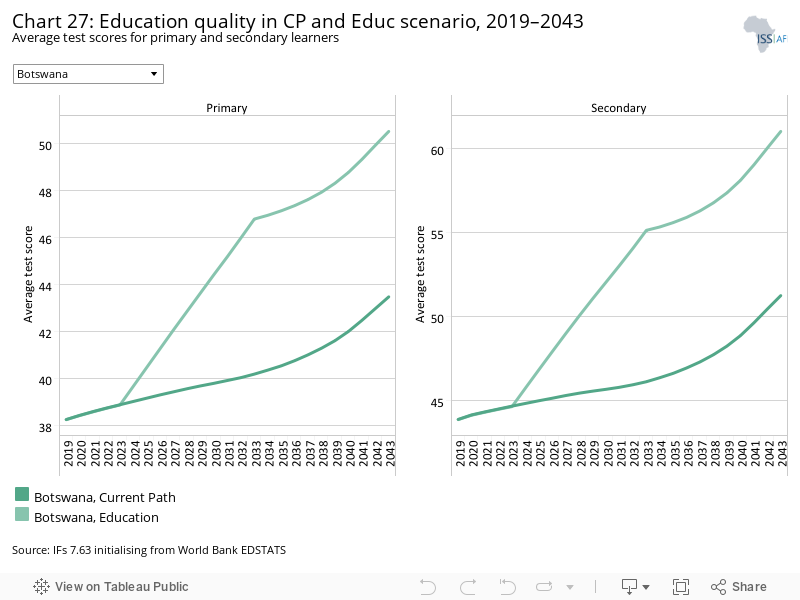
However, while Botswana provides great access to education, its learning outcomes are poor, albeit slightly better than the average for upper middle-income Africa. Education quantity is sufficient but Botswana must focus on quality education.
In 2019, Botswana’s primary test score was 38.3, and by 2043, it is expected to increase to 43.5 in the Current Path forecast. Botswana is expected to benefit from the Education scenario and is forecast to attain average test scores for primary learners of 50.5 by 2043, 7 percentage points higher than the Current Path forecast.
In the Education scenario, the test score for Botswana at the secondary level is 61 in 2043, up from 43.9 in 2019. The Education scenario is expected to result in test scores for secondary learners to be 10 percentage points higher by 2043 compared to the Current Path forecast at 51. Average test scores for secondary learners were above the average for upper middle-income countries in Africa in 2019 and will remain significantly above this average by 2043 in the Education scenario.
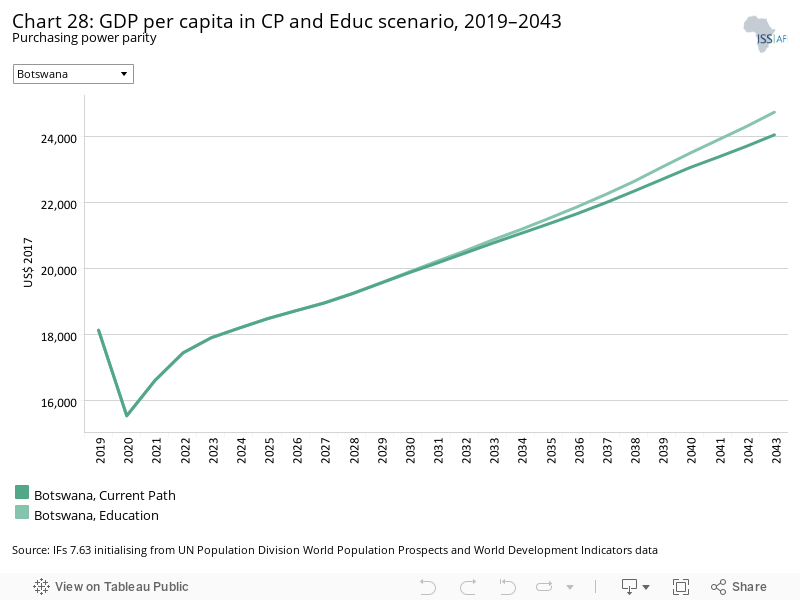
By 2043, the GDP per capita in Botswana in the Education scenario is expected to increase by US$687 resulting in income levels of US$24 743, compared to US$24 056 in the Current Path forecast. The GDP per capita for Botswana is expected to continue to perform above its upper middle-income peers in Africa with a growing income gap throughout the forecast horizon to 2043.
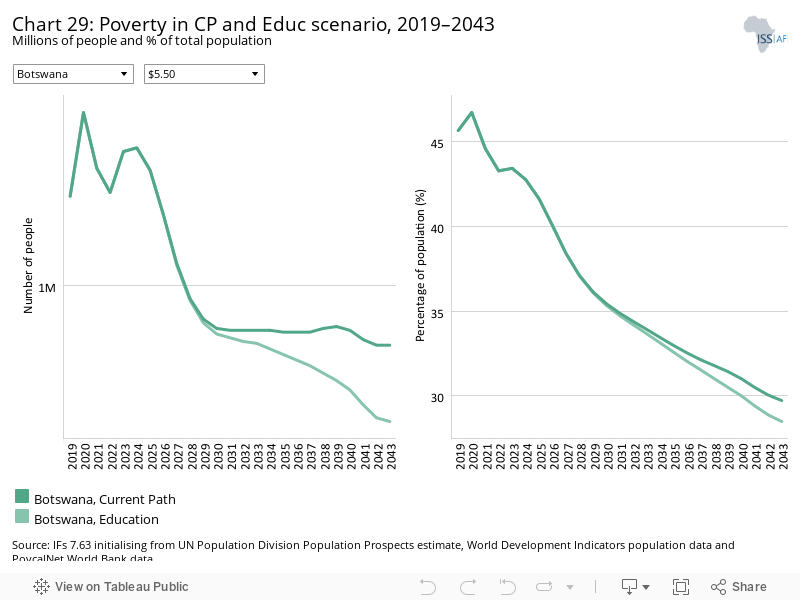
In the Education scenario, it is expected that poverty in Botswana will decrease to 28.5% by 2043, down from 45.7% in 2019. This is a 1.2 percentage point improvement compared to the Current Path forecast that is expected to be 29.7% by 2043. The scenario has the potential to lift an additional 40 000 people out of poverty.
The Manufacturing/Transfers scenario represents reasonable but ambitious manufacturing growth through greater investment in the economy, investments in research and development, and promotion of the export of manufactured goods. It is accompanied by an increase in welfare transfers (social grants) to moderate the initial increases in inequality that are typically associated with a manufacturing transition. To this end, the scenario improves tax administration and increases government revenues.
The intervention is explained here in the thematic part of the website.
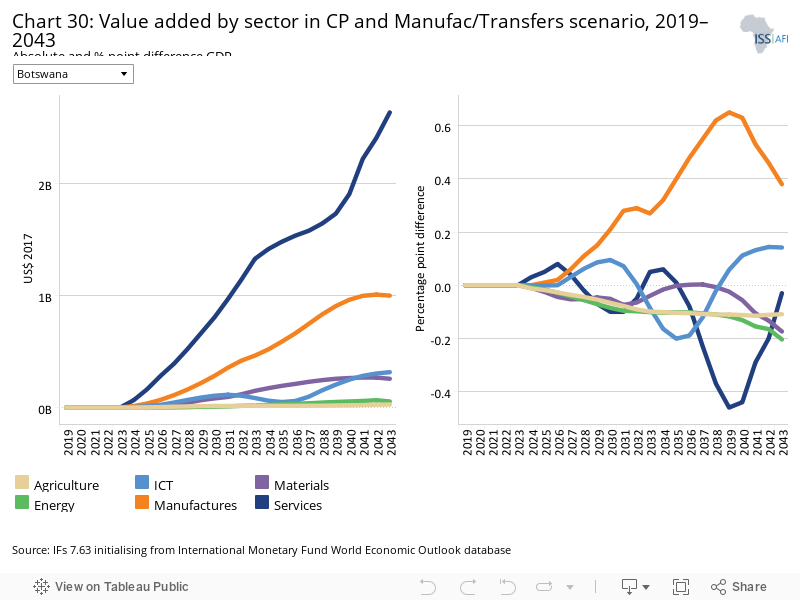
Chart 30 should be read with Chart 8 that presents a stacked area graph on the contribution to GDP and size, in billion US$, of the Current Path economy for each of the sectors.
In the Manufacturing/Transfers scenario, the service sector will continue to be the largest contributor to the economy, contributing an additional US$2.6 billion to the GDP by 2043 but experiencing a 0.03 percentage point decline compared to the Current Path forecast.
The Manufacturing/Transfers scenario will significantly improve the contribution of the manufacturing sector, which will contribute an additional US$1 billion (a 0.38 percentage point improvement) to GDP by 2043 compared to the Current Path forecast. ICT will also see an increase of 0.14 percentage points above the Current Path forecast, equating to a rise of US$0.3 billion. All three of the other sectors, materials, energy and agriculture, will experience a decline in contributions compared to the Current Path forecast.
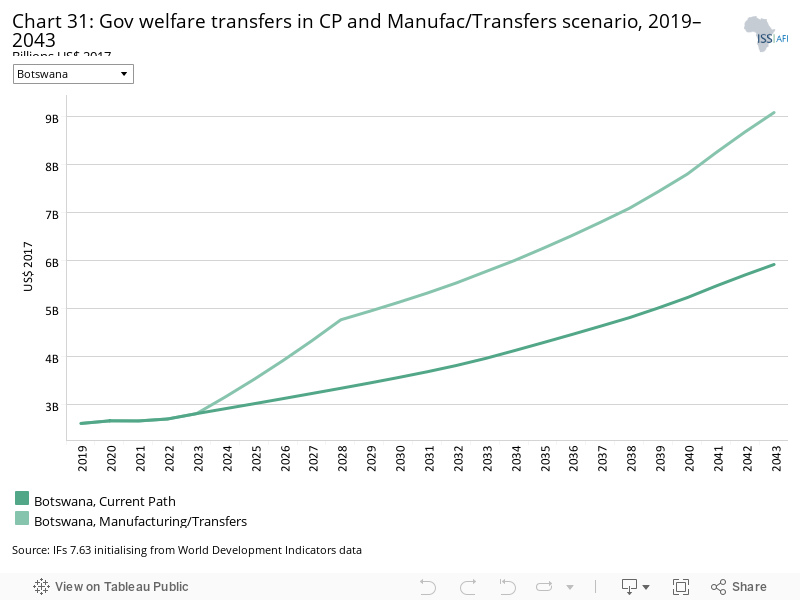
In 2019, social welfare spending (government welfare transfers to unskilled workers) equated to US$2.6 billion. In the Manufacturing/Transfers scenario, social welfare expenditure will increase to US$9.1 billion, US$3.2 billion higher than in the Current Path forecast. The purpose of these transfers is to target those workers who will be most affected by the restructuring of the economy, as more capital intensive investments are made and the demand for unskilled labour decreases.
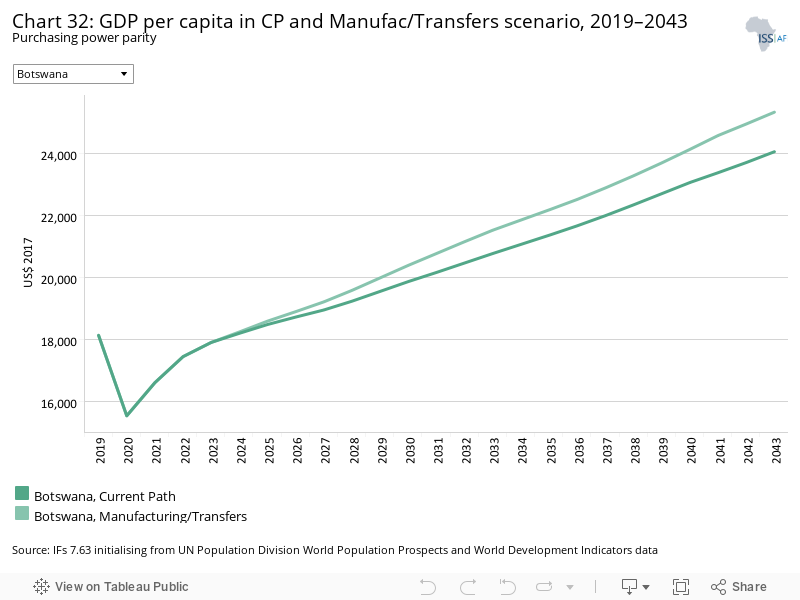
The interventions proposed in the Manufacturing/Transfers scenario will have a significant impact on the GDP per capita of Botswana in 2043, increasing it by US$1 276 above the Current Path forecast. GDP per capita is expected to increase to US$25 332 in this scenario compared to US$24 056 in the Current Path forecast. In both the Current Path forecast and the Manufacturing/Transfers scenario, GDP per capita will still be significantly above the average for upper middle-income countries in Africa by 2043. The Manufacturing/ Transfers scenario also has a bigger impact on Botswana’s income compared to the impact it has on upper middle-income countries in Africa. This shows the continuing and growing importance of investments needed for expanding Botswana’s manufacturing sector.
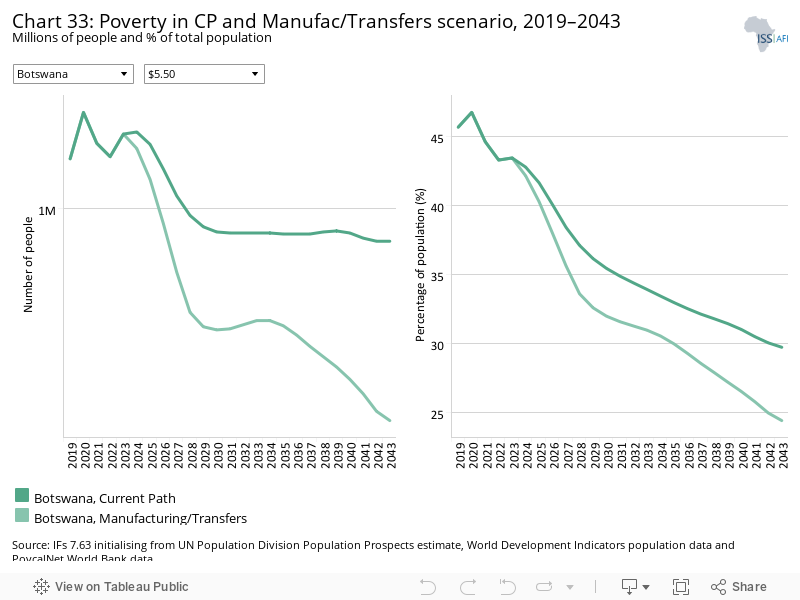
The Manufacturing/Transfers scenario will also have a significant impact on poverty reduction in the country by 2043. In this scenario, the poverty rate is reduced to 24.4%, a 5.3 percentage point reduction compared to the Current Path forecast by 2043. An additional 180 000 people will be lifted out of poverty in the Manufacturing/Transfers scenario compared to the Current Path forecast in 2043.
The Leapfrogging scenario represents a reasonable but ambitious adoption of and investment in renewable energy technologies, resulting in better access to electricity in urban and rural areas. The scenario includes accelerated access to mobile and fixed broadband and the adoption of modern technology that improves government efficiency and allows for the more rapid formalisation of the informal sector.
The intervention is explained here in the thematic part of the website.
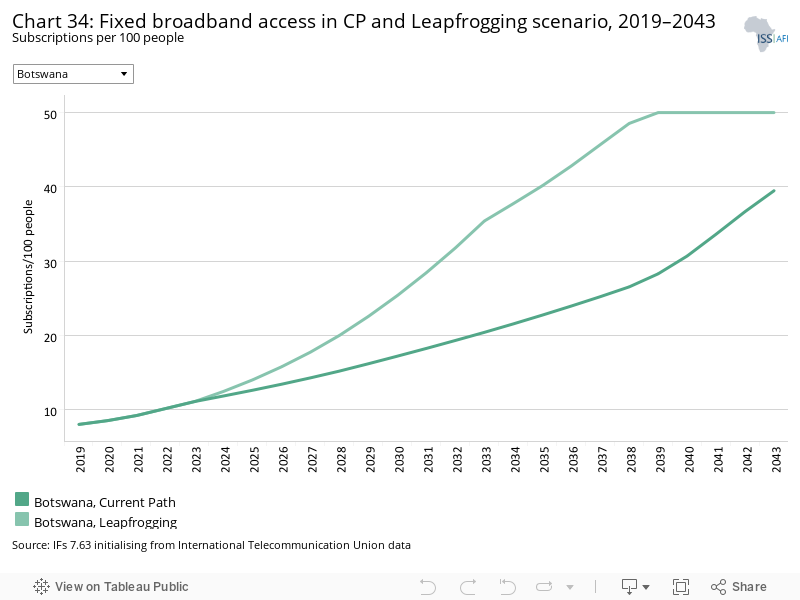
Fixed broadband includes cable modem Internet connections, DSL Internet connections of at least 256 KB/s, fibre and other fixed broadband technology connections (such as satellite broadband Internet, ethernet local area networks, fixed-wireless access, wireless local area networks, WiMAX, etc.).
Botswana’s fixed broadband subscriptions at 8 per 100 people in 2019 was nearly double the average for upper middle-income countries in Africa and 4.8 subscriptions more than the average for Africa. The concentration of urban clusters towards the east and south-east of the country and generally small population size contribute to the performance of this sector. In the Leapfrogging scenario, fixed broadband subscriptions increase to 50 subscriptions per 100 people by 2039. In the Current Path forecast, Botswana only reaches 39.5 subscriptions per 100 people by 2043. The interventions proposed in the Leapfrogging scenario therefore accelerate access from 2024 onwards.
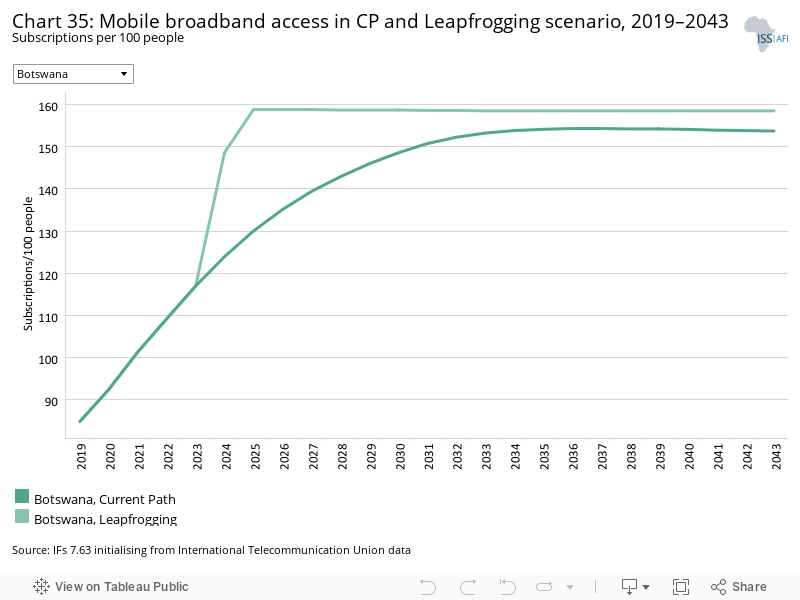
Mobile broadband refers to wireless Internet access delivered through cellular towers to computers and other digital devices.
At 84.7 subscriptions per 100 people, Botswana has slightly fewer mobile broadband subscriptions than the 86.4 subscriptions for upper middle-income Africa, but it has significantly more than the 40.5 subscriptions for Africa in 2019. In the Leapfrogging scenario, mobile broadband subscriptions will increase to 158.9 subscriptions per 100 people by as early as 2025.
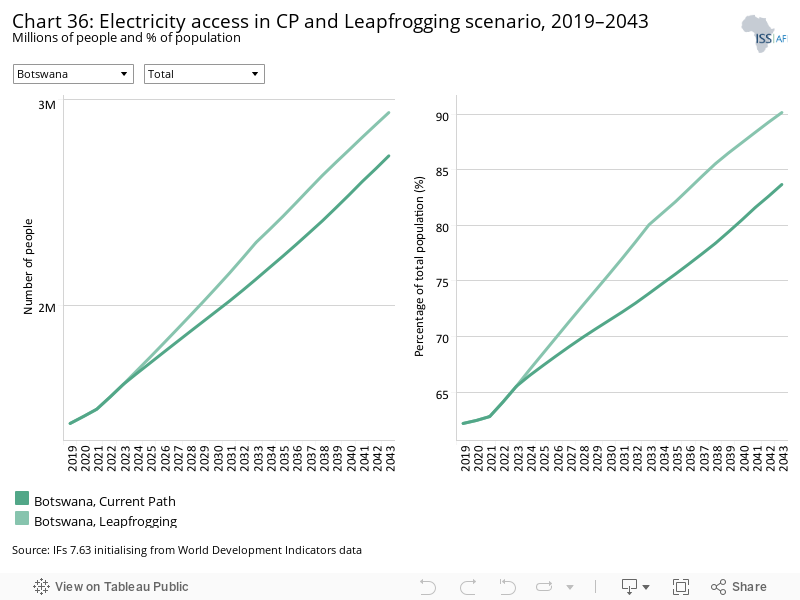
Electricity access in Botswana is low compared to the average for upper middle-income Africa. The country has limited in-house production capability and is heavily dependent on energy imports from neighbouring South Africa. In total, only 62.2% of the country’s population had access to electricity in 2019, nearly 20 percentage points lower compared to upper middle-income Africa but 9 percentage points higher than the average of Africa.
This is the result of an ageing single coal-fire station, inadequate investment in transmission and distribution lines and historical underinvestment in renewable energies. In the Current Path forecast, it is projected that 83.7% of Botswana’s population (translating to 2.7 million people) will have access to electricity by 2043. In the Leapfrogging scenario, electricity access is projected to reach 90.2% by 2043, benefiting an additional 210 000 people.
The projection indicates that in the Leapfrogging scenario, rural electricity access will increase from 33.1% in 2019 to 79.2% by 2043, 10.7 percentage points higher than in the Current Path forecast. For populations living in urban spaces, it is projected that in the Leapfrogging scenario, electricity access will increase from 75.5% in 2019 to 93.8% by 2043, 5.1 percentage points above the Current Path forecast. Without alternative and sustainable energy solutions, socio-economic development will be constrained.
By 2043, the GDP per capita in Botswana is expected to increase to US$24 536 in the Leapfrogging scenario, compared to US$24 056 in the Current Path forecast — an increase of US$480. The GDP per capita for Botswana is expected to continue to be above those from upper middle-income Africa.
The Free Trade scenario represents the impact of the full implementation of the African Continental Free Trade Area (AfCFTA) by 2034 through increases in exports, improved productivity and increased trade and economic freedom.
The intervention is explained here in the thematic part of the website.
The trade balance is the difference between the value of a country's exports and its imports. A country that imports more goods and services than it exports in terms of value has a trade deficit, while a country that exports more goods and services than it imports has a trade surplus.
The full implementation of the AfCFTA not only enables countries to export more easily but also opens them up to increased imports, endangering those sectors where they lack competitive advantage. Botswana’s trade surplus in 2019 stood at 0.4% of GDP. This is expected to worsen significantly in the near future, peaking at a deficit of 4.5% in 2026. The COVID-19 pandemic impacted the trade of luxury goods and Botswana’s dependence on the importation of energy and foodstuff subjects the country to external price fluctuations. The longer-term forecast shows a recovery and improvement with a surplus of 1.2% in 2043 in the Current Path forecast. The Free Trade scenario intervenes in the short term, reducing the deficit to 3% in 2026 and improving the trade balance to a surplus of 4% in 2039.
The interventions proposed in the Free Trade scenario have a positive impact on per capita income in Botswana. By 2043, GDP per capita in Botswana is expected to increase to US$25 146 in the Free Trade scenario, compared to US$24 056 in the Current Path forecast — an increase of US$1 090. GDP per capita for Botswana is expected to continue to perform better compared to its upper middle-income peers.
The Financial Flows scenario represents a reasonable but ambitious increase in worker remittances and aid flows to poor countries, and an increase in the stock of foreign direct investment (FDI) and additional portfolio investment inflows to middle-income countries. We also reduced outward financial flows to emulate a reduction in illicit financial outflows.
The intervention is explained here in the thematic part of the website.
The economy of Botswana benefits only marginally from foreign aid inflows, and in 2019 foreign aid contributed 0.6% to the country’s GDP, on par with the average for upper middle-income Africa. Botswana, and most of upper middle-income Africa, rely much less on foreign aid compared to the average of African countries. Foreign aid flows are projected to decrease in both scenarios, equating to 0.32% in the Financial Flows scenario, compared to 0.36% for the Current Path forecast by 2043.
In 2019, foreign investment in Botswana measured above the average for upper middle-income Africa by 0.9 percentage points. The country’s stable political environment and wealth of natural resources are attractors of investment. In the Financial Flows scenario, FDI inflows increase to 4.5% of GDP by 2043, 1 percentage point higher than the Current Path forecast. The COVID-19 pandemic has impacted inflow of FDI significantly, but it is expected to recover in the short term.
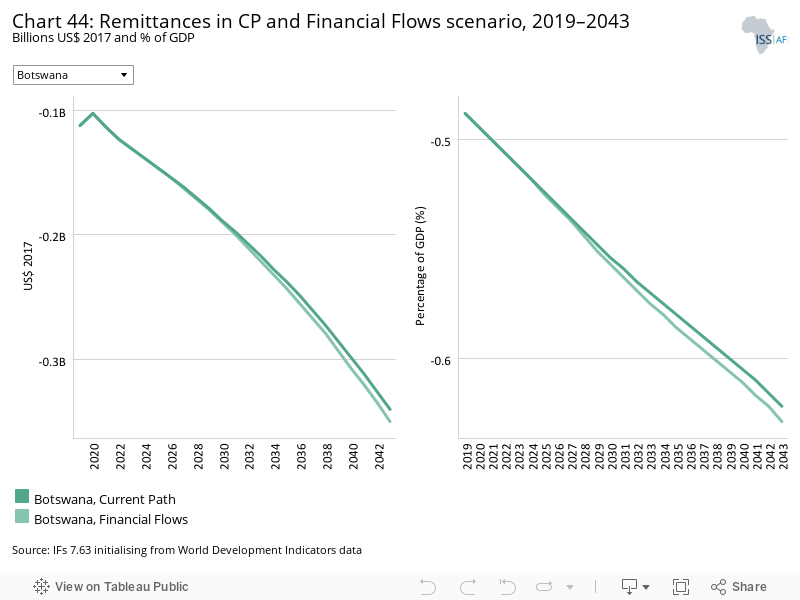
Botswana is a net sender of remittances. The strong economy attracts migrant workers from neighbouring Zimbabwe, South Africa and Zambia. This remittance trend is likely to continue throughout the forecast horizon as Botswana’s economy outperforms many of its neighbouring countries. In 2019, remittances as a % of GDP equated to -0.49% and will decline further to -0.63% by 2043 in the Financial Flows scenario, 0.01 percentage points below the Current Path forecast.
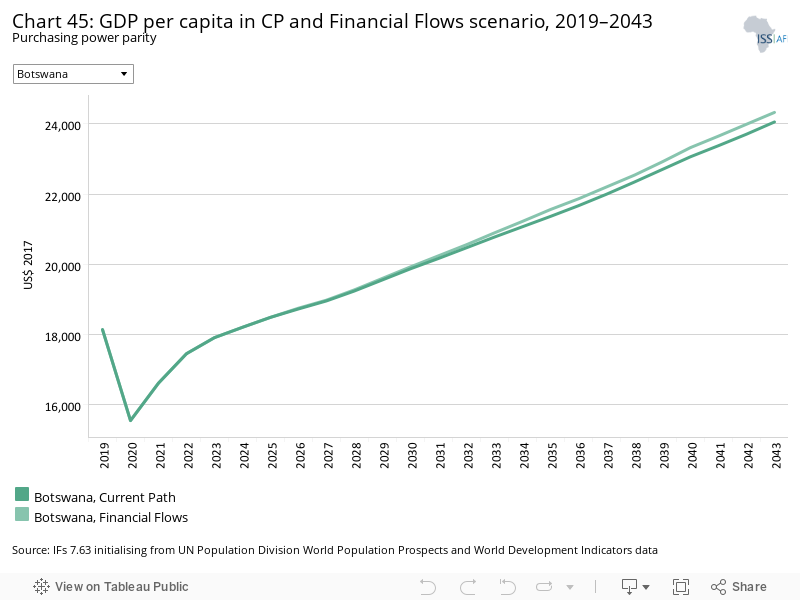
By 2043, the GDP per capita is expected to increase to US$24 329 in the Financial Flows scenario, compared to US$24 056 in the Current Path forecast, an increase of US$273. The GDP per capita for Botswana will remain significantly higher compared to the average for upper middle-income Africa.
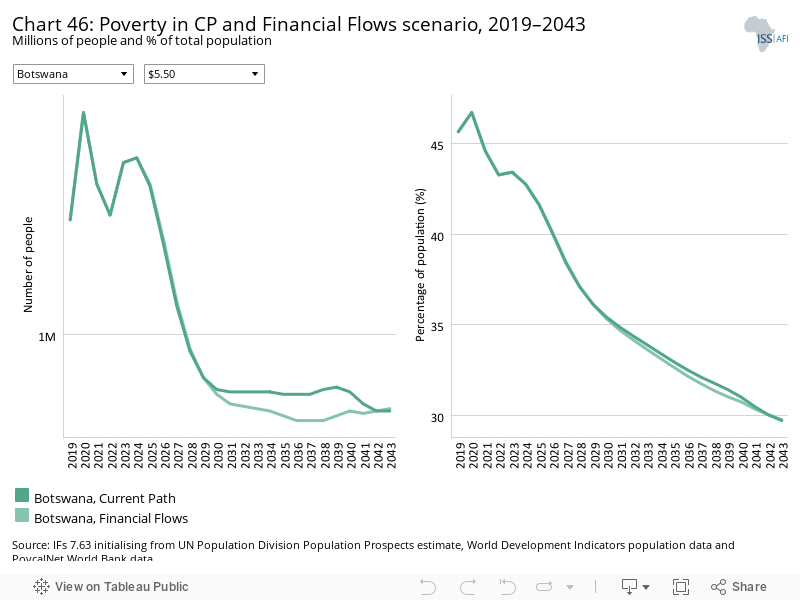
Trade openness will reduce poverty in the long term after initially increasing it due to the redistributive effects of trade. Most African countries export primary commodities and low-tech manufacturing products, and therefore a continental free trade agreement (AfCFTA) that reduces tariffs and non-tariff barriers across Africa will increase competition among countries in primary commodities and low-tech manufacturing exports. Countries with inefficient, high-cost manufacturing sectors might be displaced as the AfCFTA is implemented, thereby pushing up poverty rates. In the long term, as the economy adjusts and produces and exports its comparatively advantaged (lower relative cost) goods and services, poverty rates will decline.
The Financial Flows scenario has no long-term benefit above the Current Path forecast with both reducing the poverty rate from 45.7% in 2019 to 29.7% in 2043. In 2043, 970 000 people will remain below the poverty line of US$5.50.
The Infrastructure scenario represents a reasonable but ambitious increase in infrastructure spending across Africa, focusing on basic infrastructure (roads, water, sanitation, electricity access and ICT) in low-income countries and increasing emphasis on advanced infrastructure (such as ports, airports, railway and electricity generation) in higher-income countries.
Note that health and sanitation infrastructure is included as part of the Health/WaSH scenario and that ICT infrastructure and more rapid uptake of renewables are part of the Leapfrogging scenario. The interventions there push directly on outcomes, whereas those modelled in this scenario increase infrastructure spending, indirectly boosting other forms of infrastructure, including that supporting health, sanitation and ICT.
The intervention is explained here in the thematic part of the website.
The country performs significantly below the average level of electricity access for upper middle-income African countries. In 2019, 75.8% of urban and 33.1% of the rural population had access to electricity. The national grid remains very sparse and outdated.
The Infrastructure scenario stands to benefit Botswana by increasing electricity access to 85.3% in 2043, 1.6 percentage points above the Current Path forecast. It will also address the rural access inequality and raise rural access to 71.7% by 2043, 3.1 percentage points above the Current Path forecast. The Infrastructure scenario will benefit urban areas by increasing access with 1.1 percentage points above the Current Path forecast by 2043.
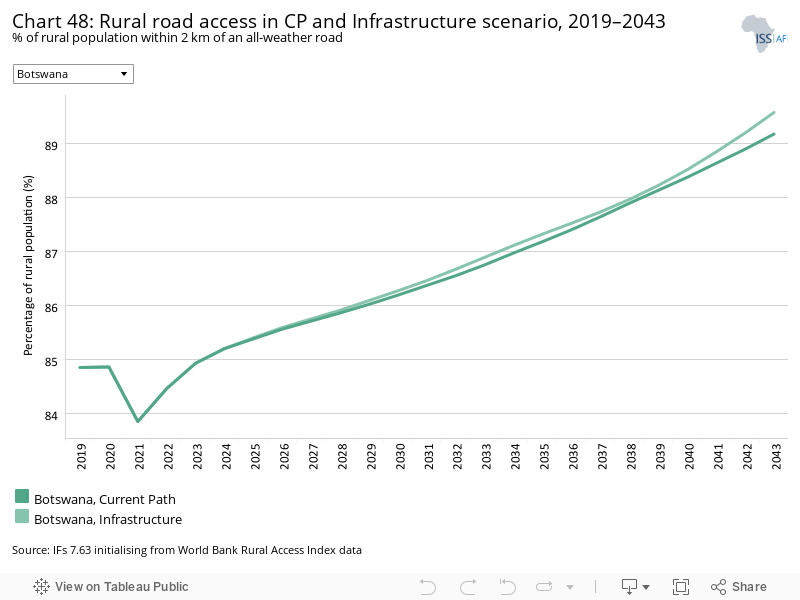
Indicator 9.1.1 in the Sustainable Development Goals refers to the proportion of the rural population who live within 2 km of an all-season road and is captured in the Rural Access Index.
Measuring rural accessibility is a very important development indicator. There is a strong link between investing in rural access roads and positive socio-economic impacts, such as improving rural income, reducing poverty, reducing maternal deaths, improving paediatric health and increased agricultural productivity.
Botswana has a good quality road network, with strong arterials connecting South Africa with Namibia. Its sparse rural population also contributes to overall high accessibility. In 2019, 85% of Botswana’s rural population had access to an all-weather road, compared to an average of 83.5% for upper middle-income countries in Africa and 53% for the average of Africa. The Infrastructure scenario will only marginally influence rural accessibility and by 2043 it is projected that 89.6% of the rural population will have access to an all-weather road, compared to 89.2% for the Current Path forecast.
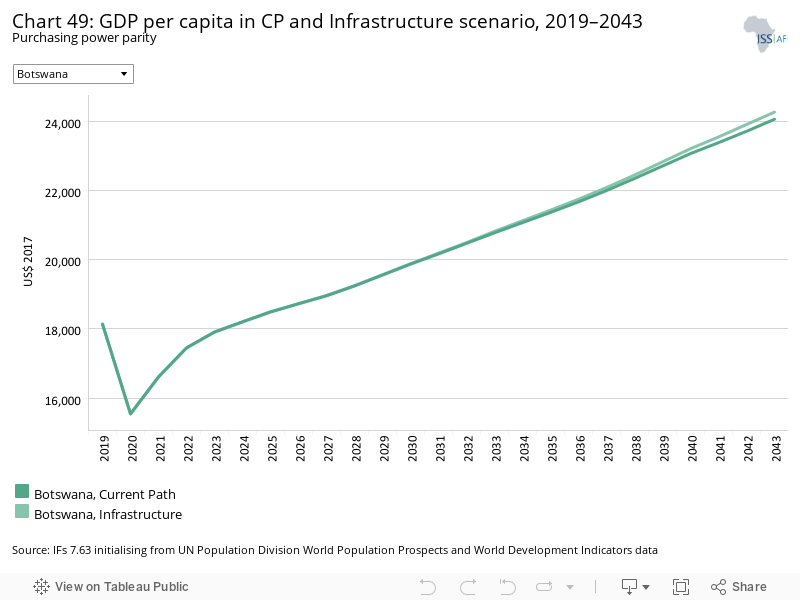
By 2043, the GDP per capita in Botswana is expected to increase to US$24 263 in the Infrastructure scenario, compared to US$24 056 in the Current Path forecast, an increase of US$207. The GDP per capita for Botswana will remain above the average for upper middle-income Africa with a growing per capita gap throughout the forecast horizon.
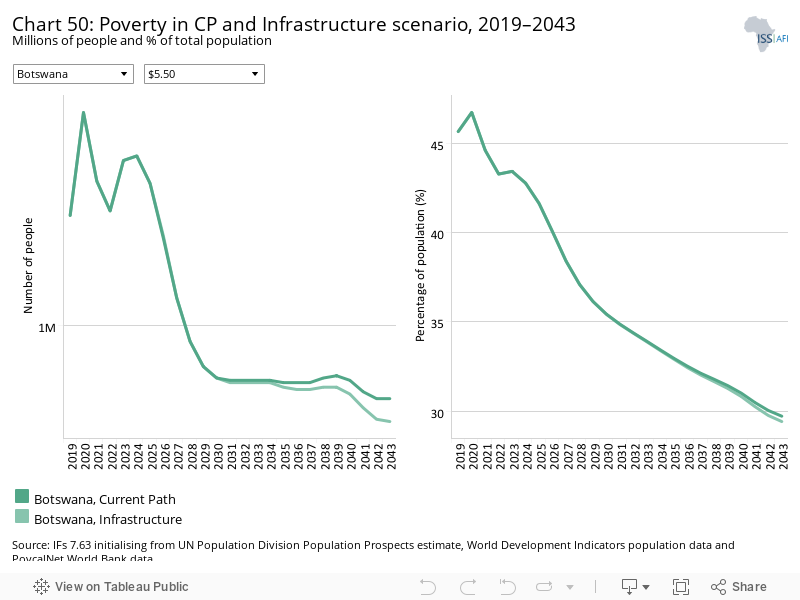
The Infrastructure scenario has a negligible impact on poverty reduction, lowering poverty by only 0.3 percentage points by 2043 compared to the Current Path forecast and lifting an additional 10 000 people out of extreme poverty. The poverty rate remains significantly below the average for upper middle-income Africa throughout the forecast horizon.
The Governance scenario represents a reasonable but ambitious improvement in accountability and reduces corruption, and hence improves the quality of service delivery by government.
The intervention is explained here in the thematic part of the website.
As defined by the World Bank, government effectiveness ‘captures perceptions of the quality of public services, the quality of the civil service and the degree of its independence from political pressures, the quality of policy formulation and implementation, and the credibility of the government’s commitment to such policies’.
Chart 51 presents the impact of the interventions in the Governance scenario on government effectiveness.
Botswana scores significantly higher than the average of upper middle-income Africa, Africa and its regional neighbours in SADC. In 2019, Botswana had the second highest government effectiveness score in Africa, second only to Mauritius. Botswana’s government is considered to be an effective government and boasts a capable state with strong and functioning institutions. The Governance scenario therefore improves the score only marginally from a quality score of 3 in 2019 to 3.3 by 2043.
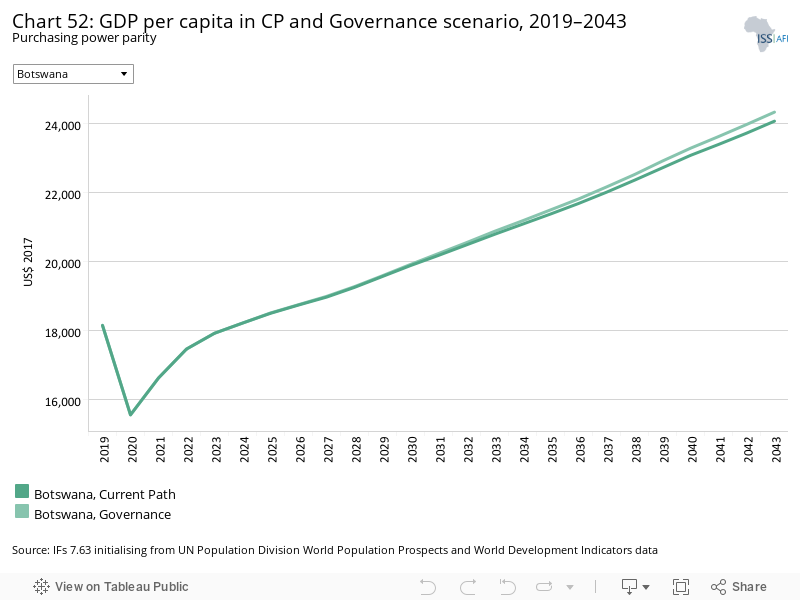
By 2043, the GDP per capita in Botswana is expected to increase to US$24 318 in the improved Governance scenario, compared to US$24 056 in the Current Path forecast, an increase of US$262. The GDP per capita for Botswana will remain above the average for upper middle-income Africa with a growing per capita gap throughout the forecast horizon.
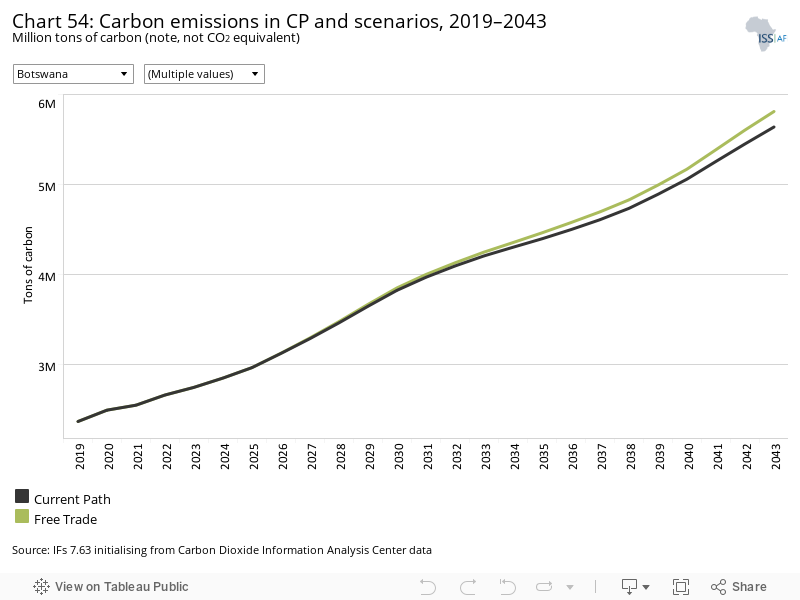
Chart 54 displays projected tons of carbon emissions for Botswana in the Current Path and the 11 intervention scenarios. Note that IFs uses carbon equivalents rather than CO2 equivalents.
Botswana’s carbon emissions are projected to increase most in the Manufacturing/Transfers scenario, emitting an additional 3.4 million tons of carbon by 2043 compared to 2019, and 0.2 million tons of carbon more than the Current Path forecast for 2043. The Free Trade scenario will lead to the second highest level of emissions, followed by the Stability scenario. In the Demographic scenario, emissions are forecast to be the same as in the Current Path forecast. In 2043, emissions in the Demographic scenario are likely to be 5.6 million tons, up from 2.4 million tons in 2019.
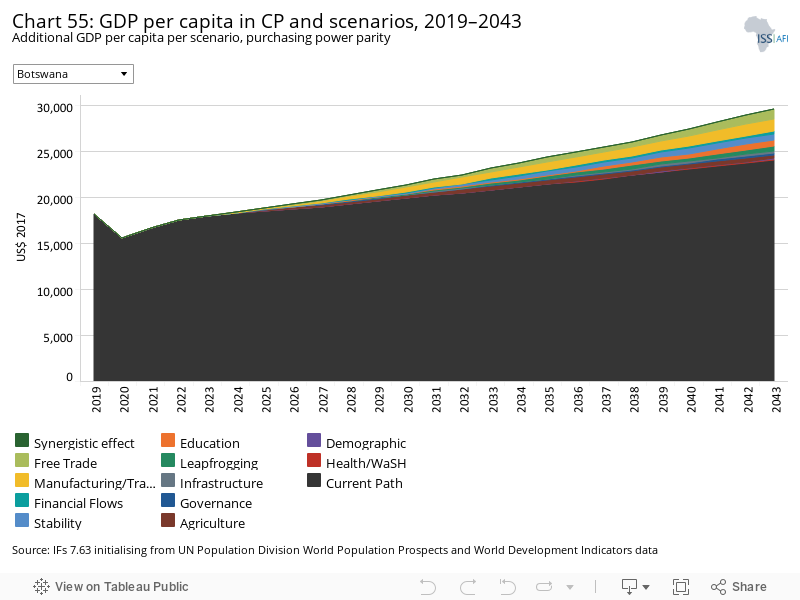
The Combined Agenda 2063 scenario consists of the combination of all 11 sectoral scenarios presented above, namely the Stability, Demographic, Health/WaSH, Agriculture, Education, Manufacturing/Transfers, Leapfrogging, Free Trade, Financial Flows, Infrastructure and Governance scenarios. The cumulative impact of better education, health, infrastructure, etc. means that countries get an additional benefit in the integrated IFs forecasting platform that we refer to as the synergistic effect. Chart 55 presents the contribution of each of these 12 components to GDP per capita in the Combined Agenda 2063 scenario as a stacked area graph.
Although Botswana’s economy has benefitted from continued and sound economic growth, the country still stands to benefit from interventions in key development aspects as outlined above. Diversifying the economy and continued investment in the manufacturing sector (as captured in the Manufacturing/Transfers scenario) will benefit per capita income the most, raising income by as much as US$1 275 in 2043 compared to the Current Path forecast.
Improving trade with its neighbours and abroad (as captured in the Free Trade scenario) will also significantly raise GDP per capita by 2043 by an additional US$1 090 above the Current Path forecast. The synergistic effect of a Combined Agenda 2063 scenario that assumes improvements are made in all 11 broad intervention areas could add an additional US$87 in 2043 on top of the combined per capita income.
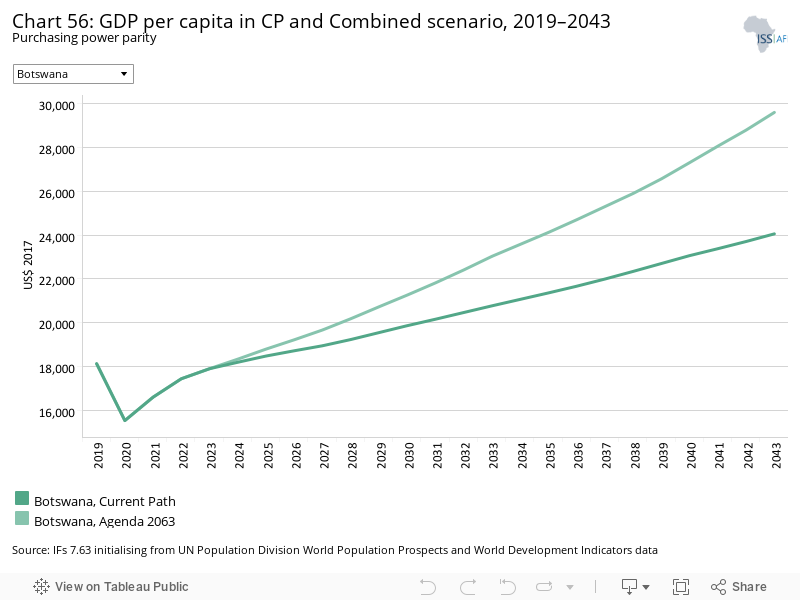
Whereas Chart 55 presents a stacked area graph on the contribution of each scenario to GDP per capita as well as the additional benefit or synergistic effect, Chart 56 presents only the GDP per capita in the Current Path forecast and the Combined Agenda 2063 scenario.
The Combined Agenda 2063 scenario has the potential to raise the GDP per capita in Botswana to US$29 594 by 2043, US$5 538 above the Current Path forecast for the same year. The Combined Agenda 2063 scenario shows that a policy push across all the development sectors is necessary to achieve even greater growth and development in Botswana. This additional push is much needed if Botswana is to address its persistently high level of unemployment that continues to hamper growth and keep the poverty rate high.
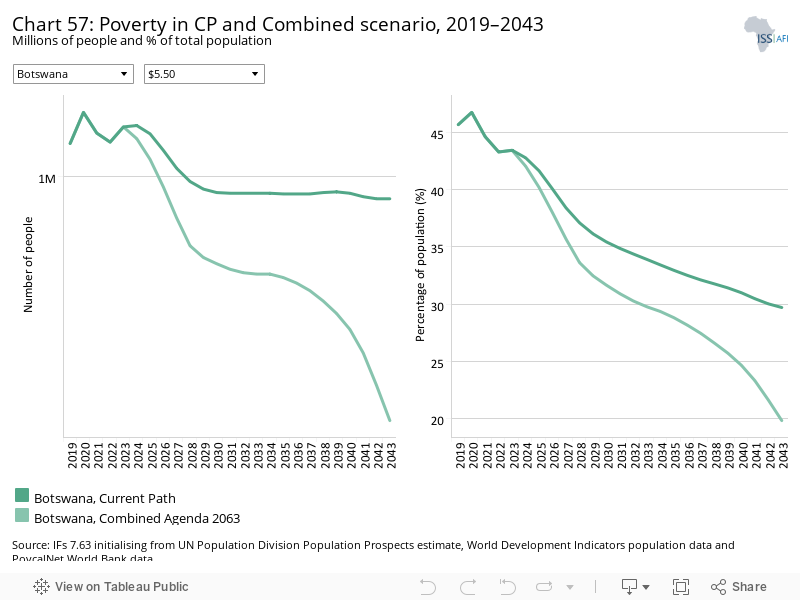
The Combined Agenda 2063 interventions can significantly benefit the economy of Botswana by reducing the poverty burden the country currently bears. If Botswana can effectively implement measures as outlined in the Combined Agenda 2063 scenario, poverty can be reduced from 46.7% in 2019 to 19.9% in 2043 using the US$5.50 benchmark for upper middle-income countries. The scenario therefore has the potential to reduce poverty in 2043 by 9.8 percentage points compared to the Current Path forecast, lifting an additional 320 000 people out of poverty. Poverty will be eradicated in Botswana by 2039 in this scenario, using the US$1.90 benchmark, nine years later than the SDG goal of eliminating poverty at that level by 2030.
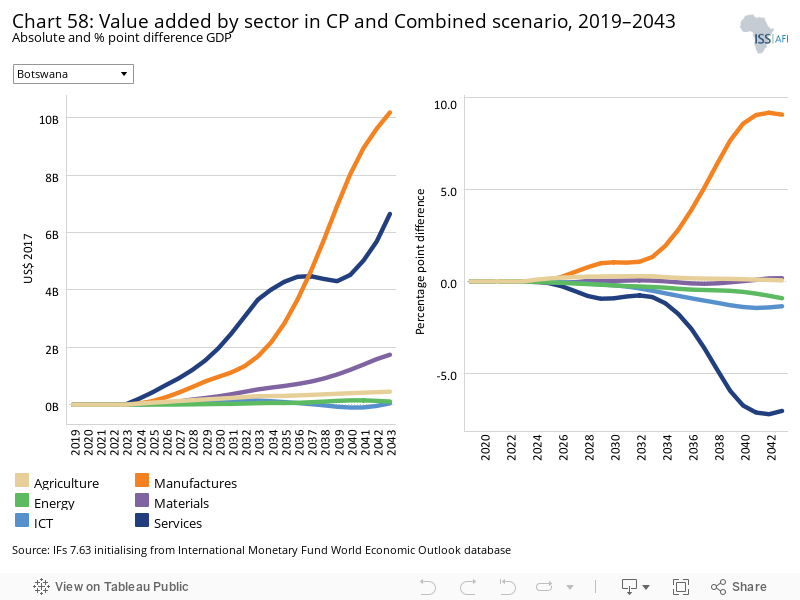
See Chart 8 to view the Current Path forecast of the sectoral composition of the economy.
This chart displays the percentage point difference and the value difference between the Current Path forecast and the Combined Agenda 2063 scenario for the six sectors of the economy modelled in IFs. The manufacturing sector will contribute 9.1 percentage points more to GDP in the Combined Agenda 2063 scenario compared to the Current Path forecast, equivalent to a difference of US$10.2 billion by 2043. The service sector will contribute 7 percentage points less to the GDP in the Combined Agenda 2063 scenario compared to the Current Path forecast. Even though the contribution will be 7 percentage points lower, the value added would be US$6.6 billion more by 2043 compared to the Current Path forecast, the result of the economy being US$18.4 billion larger (see Chart 59) in 2043 in the Combined Agenda 2063 scenario.
Botswana’s GDP is forecast to grow to US$73.9 billion by 2043 in the Combined Agenda 2063 scenario, compared to US$54.8 billion in the Current Path forecast, an increase of 35% (or US$19.1 billion). This shows the value that the concurrent implementation of the interventions in the 11 sectoral scenarios could have on economic growth.
The positive effect that the Combined Agenda 2063 scenario will have on GDP growth inevitably comes at the cost of increasing carbon emissions. Globally and regionally, however, Botswana is projected to remain a small emitter and by 2043 will be ranked 27th for carbon emissions in Africa in the Combined Agenda 2063 scenario. In 2019, Botswana’s carbon emissions were 2.4 million tons and they are projected to increase to 6.5 million tons of carbon by 2043 in the Combined Agenda 2063 scenario, 0.9 million tons above the Current Path forecast for 2043.
Page information
Contact at AFI team is Alize le Roux
This entry was last updated on 14 August 2025 using IFs v7.63.
Donors and sponsors


Reuse our work
- All visualizations, data, and text produced by African Futures are completely open access under the Creative Commons BY license. You have the permission to use, distribute, and reproduce these in any medium, provided the source and authors are credited.
- The data produced by third parties and made available by African Futures is subject to the license terms from the original third-party authors. We will always indicate the original source of the data in our documentation, so you should always check the license of any such third-party data before use and redistribution.
- All of our charts can be embedded in any site.
Cite this research
Alize le Roux (2025) Botswana. Published online at futures.issafrica.org. Retrieved from https://futures.issafrica.org/geographic/countries/botswana/ [Online Resource] Updated 14 August 2025.