 Benin
Benin
Feedback welcome
Our aim is to use the best data to inform our analysis. See our Technical page for information on the IFs forecasting platform. We appreciate your help and references for improvements via our feedback form.
Please note: This country report was developed using African Futures’ previous analytical framework, which organised the assessment across 11 sectoral scenarios. We have since updated and streamlined the analytical architecture to 8 sectoral scenarios. While the two frameworks remain broadly aligned, the current structure improves consistency, comparability and integration across themes and geographic studies. This page will therefore be updated to the current framework in due course. Read more about our analytical framework on the Technical Page.
In this entry, we first describe the Current Path forecast for Benin as it is expected to unfold to 2043, the end of the third ten-year implementation plan of the African Union’s Agenda 2063 long-term vision for Africa. The Current Path in the International Futures (IFs) forecasting model initialises from country-level data that is drawn from a range of data providers. We prioritise data from national sources.
The Current Path forecast is divided into summaries on demographics, economics, poverty, health/WaSH and climate change/energy. A second section then presents a single positive scenario for potential improvements in stability, demographics, health/WaSH, agriculture, education, manufacturing and transfers, leapfrogging, free trade, financial flows, infrastructure, governance and the impact of various scenarios on carbon emissions. With the individual impact of these sectors and dimensions having been considered, a final section presents the impact of the Combined Agenda 2063 scenario.
We generally review the impact of each scenario and the Combined Agenda 2063 scenario on gross domestic product per person and extreme poverty, except for Health/WaSH that uses life expectancy and infant mortality.
The information is presented graphically and supported by brief interpretive text.
All US$ numbers are in 2017 values.
Executive Summary
- Current Path forecast
- Benin is a lower middle-income country in Africa with a population of 11.9 million people. It is bordered by Togo to the west, Nigeria to the east, Burkina Faso to the north-west and Niger to the north-east. Life expectancy in Benin is around 63.6 years, and there is a high disease burden from both communicable and non-communicable diseases. Benin’s GDP per capita in 2019 stood at US$2 439, and about 7.9 million people live below the benchmark poverty line of US$3.20 for lower middle-income countries. Jump to Current Path forecast
- In the Current Path forecast, Benin increases its population from an estimated 11.9 million people in 2019 to 21.2 million people in 2043, and witnesses slow but certain growth in urbanisation, such that by 2043, 58% of the population will reside in urban areas. Jump to Demographics: Current Path
- Benin is expected to experience significant growth in GDP, reaching US$66.3 billion in 2043 and an increase in GDP per capita to US$4 685 in 2043. The country reduces its level of informality, with a decrease in the size of the informal sector’s contribution to GDP, from 40.9% in 2019 to 33.7% in 2043, and increases its reliance on the service sector for job creation, with a rise in its contribution to GDP to US$36.6 billion (55.3% of GDP). Jump to Economics: Current Path
- The country still struggles with the number and proportion of people living below the poverty line of US$3.20 with 11 million poor people (51.9% of the population) in 2043. Jump to Poverty: Current Path
-
In 2043, Benin increases its carbon emissions to 7 million tons. Jump to Carbon emissions/Energy: Current Path
- Sectoral Scenarios
- The Stability scenario will improve Benin’s score on the government security index to 0.92 in 2043, and simultaneously increase the GDP per capita to US$4 817, reducing the proportion of people living below the US$3.20 poverty line by 1.2 percentage points. Jump to Stability Scenario
- Benin will achieve the demographic dividend by 2043 in the Demographic scenario, although this is two years later than the average of its income peer group. Jump to Demographic scenario
- Life expectancy will increase to 73.2 years by 2043 and reduce infant mortality per 1 000 live births to 19.4 in the Health/WaSH scenario. Jump to Health/WaSH scenario
- In the Agriculture scenario, Benin’s yield per hectare will rise to 8.2 metric tons, and the nation will remain a net importer of agricultural products with a balance of 7% of total agricultural demand by 2043. Jump to Agriculture scenario
- The Education scenario will result in a higher GDP per capita of US$4 846 by 2043, although the number of poor people in Benin will decline only marginally as a result of implementing this scenario. Jump to Education scenario
- Government welfare transfers to households will increase to US$2.8 billion in 2043 in the Manufacturing/Transfers scenario. Jump to Manufacturing/Transfers scenario
- The Leapfrogging scenario will increase mobile broadband subscriptions per 100 people from 21.6 in 2019 to 152.9 in 2043, and also enable access to electricity to 80.9% of the population. Jump to Leapfrogging scenario
- In the Free Trade scenario, there will be an increase in GDP per capita to US$5 166 by 2043 and a reduction in the proportion of poor people in Benin to 47.1% of the population. Jump to Free Trade scenario
- The Financial Flows scenario will decrease the amount of foreign aid as a percentage of GDP, while marginally increasing the contribution of FDI to Benin’s economy to 1.8% in 2043. Jump to Financial Flow scenario
- The percentage of the rural population living within 2 km of all-weather roads to 47.6% will increase by 2043 in the Infrastructure scenario. Jump to Infrastructure scenario
- The Governance scenario will increase the GDP per capita to US$4 800 in 2043. Jump to Governance scenario
- While Benin’s carbon emissions are projected to increase in all the scenarios, the Free Trade scenario will have the greatest effect, resulting in additional emissions of 7.8 million tons of carbon in 2043. Jump to Impact of scenarios on carbon emissions
- Combined Agenda 2063 scenario
- In the Combined Agenda 2063 scenario, Benin’s GDP per capita increases by US$2 736 in 2043, with the Free Trade and Leapfrogging scenarios having the greatest potential to increase the GDP per capita. There is aggressive growth of the economy to US$117.2 billion in 2043, compared to projections of US$66.3 billion in the Current Path forecast, and a reduction in the number of people living below the poverty line to 6.4 million people (31.8% of population). Benin sees a significant increase in carbon emissions to 10.1 million tons by 2043. Jump to Combined Agenda 2063 scenario
All charts for Benin Development Futures
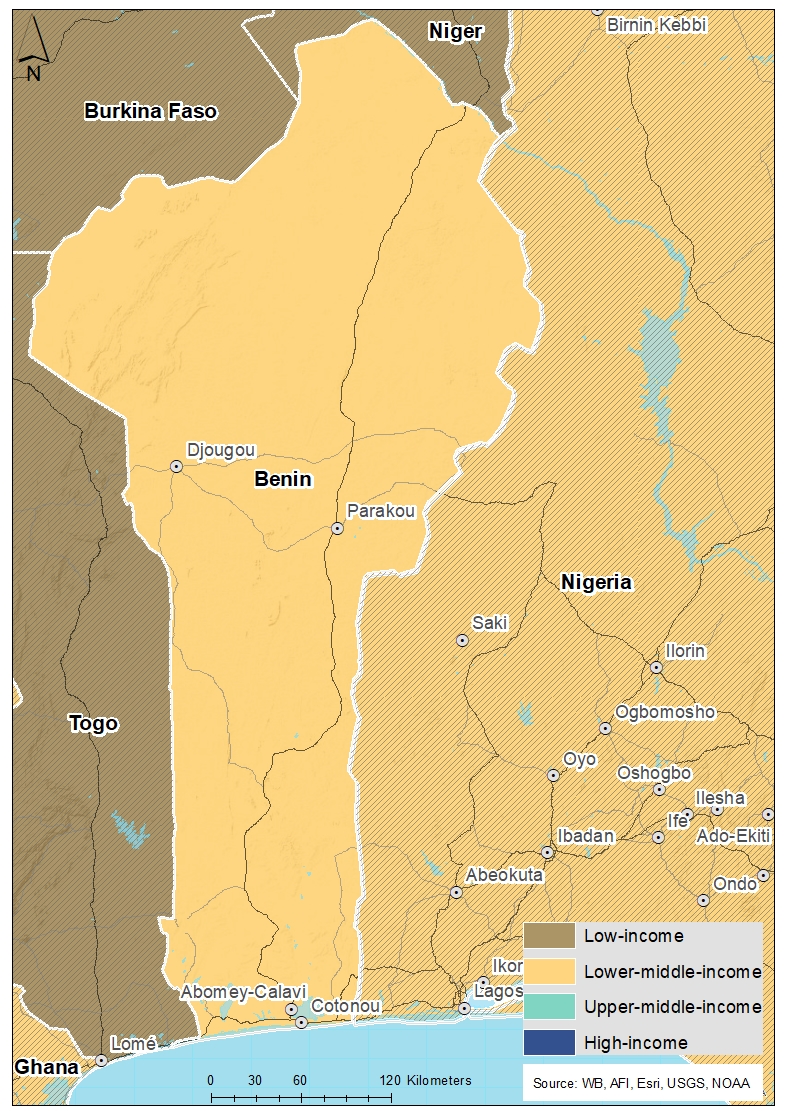
- Chart 1: Political map of Benin
- Chart 2: Population structure in CP, 1990–2043
- Chart 3: Urban and rural population in CP, 1990–2043
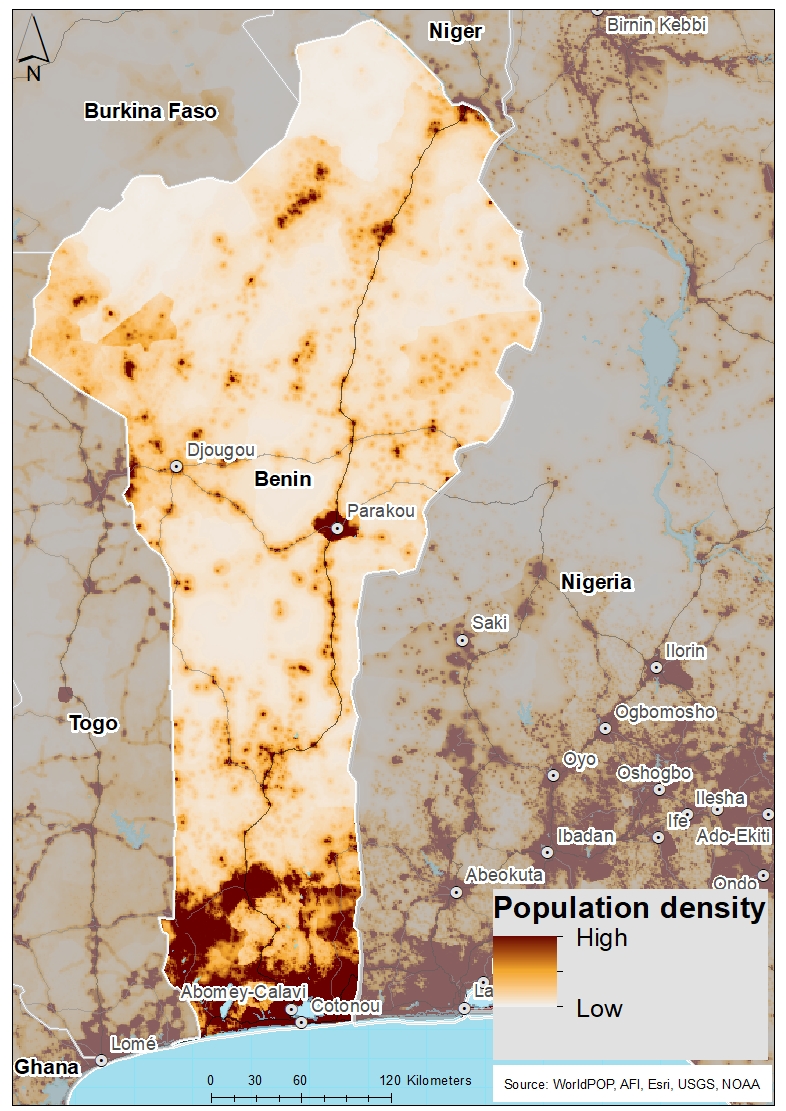
- Chart 4: Population density map for 2019
- Chart 5: GDP in CP, 1990–2043
- Chart 6: GDP per capita in CP, 1990–2043
- Chart 7: Informal sector value in CP, 2015–2043
- Chart 8: Value added by sector in CP, 2015–2043
- Chart 9: Agriculture production/demand in CP, 1990–2043
- Chart 10: Poverty in CP, 2015–2043
- Chart 11: Energy production by type in CP, 1990–2043
- Chart 12: Carbon emissions in CP, 1990–2043
- Chart 13: Governance security in CP and Stability scenario, 2019–2043
- Chart 14: GDP per capita in CP and Stability scenario, 2019–2043
- Chart 15: Poverty in CP and Stability scenario, 2019–2043
- Chart 16: Demographic dividend in CP and Demog scenario, 2019–2043
- Chart 17: Infant mortality in CP and Demog scenario, 2019–2043
- Chart 18: GDP per capita in CP and Demog scenario, 2019–2043
- Chart 19: Poverty in CP and Demog scenario, 2019–2043
- Chart 20: Life expectancy in CP and Health/WaSH scenario, 2019–2043
- Chart 21: Infant mortality in CP and Health/WaSH scenario, 2019–2043
- Chart 22: Yield/hectare in CP and Agric scenario, 2019–2043
- Chart 23: Agriculture imports in CP and Agric scenario, 2019–2043
- Chart 24: GDP per capita in the CP and Agric scenario, 2019–2043
- Chart 25: Poverty in CP and Agric scenario, 2019–2043
- Chart 26: Mean years of education in CP and Educ scenario, 2019–2043
- Chart 27: Education quality in CP and Educ scenario, 2019–2043
- Chart 28: GDP per capita in CP and Educ scenario, 2019–2043
- Chart 29: Poverty in CP and Educ scenario, 2019–2043
- Chart 30: Value added by sector in CP and Manufac/Transfers scenario, 2019–2043
- Chart 31: Gov welfare transfers in CP and Manufac/Transfers scenario, 2019–2043
- Chart 32: GDP per capita in CP and Manufac/Transfers scenario, 2019–2043
- Chart 33: Poverty in CP and Manufac/Transfers scenario, 2019–2043
- Chart 34: Fixed broadband access in CP and Leapfrogging scenario, 2019–2043
- Chart 35: Mobile broadband access in CP and Leapfrogging scenario, 2019–2043
- Chart 36: Electricity access in CP and Leapfrogging scenario, 2019–2043
- Chart 37: GDP per capita in CP and Leapfrogging scenario, 2019–2043
- Chart 38: Poverty in CP and Leapfrogging scenario, 2019–2043
- Chart 39: Trade balance in CP and Free Trade scenario, 2019–2043
- Chart 40: GDP per capita in CP and Free Trade scenario, 2019–2043
- Chart 41: Poverty in CP and Free Trade scenario, 2019–2043
- Chart 42: Foreign aid in CP and Financial Flows scenario, 2019–2043
- Chart 43: Inflow of FDI in CP and Financial Flows scenario, 2019–2043
- Chart 44: Remittances in CP and Financial Flows scenario, 2019–2043
- Chart 45: GDP per capita in CP and Financial Flows scenario, 2019–2043
- Chart 46: Poverty in CP and Financial Flows scenario, 2019–2043
- Chart 47: Electricity access in CP and Infrastructure scenario, 2019–2043
- Chart 48: Rural road access in CP and Infrastructure scenario, 2019–2043
- Chart 49: GDP per capita in CP and Infrastructure scenario, 2019–2043
- Chart 50: Poverty in CP and Infrastructure scenario, 2019–2043
- Chart 51: Gov effectiveness in CP and Governance scenario, 2019–2043
- Chart 52: GDP per capita in CP and Governance scenario, 2019–2043
- Chart 53: Poverty in CP and Governance scenario, 2019–2043
- Chart 54: Carbon emissions in CP and scenarios, 2019–2043
- Chart 55: GDP per capita in CP and scenarios, 2019–2043
- Chart 56: GDP per capita in CP and Combined scenario, 2019–2043
- Chart 57: Poverty in CP and Combined scenario, 2019–2043
- Chart 58: Value added by sector in CP and Combined scenario, 2019–2043
- Chart 59: GDP in CP and Combined scenario, 2019–2043
- Chart 60: Carbon emissions in CP and Combined scenario, 2019–2043


This page provides an overview of the key characteristics of Benin along its likely (or Current Path) development trajectory. The Current Path forecast from the International Futures forecasting (IFs) platform is a dynamic scenario that imitates the continuation of current policies and environmental conditions. The Current Path is therefore in congruence with historical patterns and produces a series of dynamic forecasts endogenised in relationships across crucial global systems. We use 2019 as a standard reference year and the forecasts generally extend to 2043 to coincide with the end of the third ten-year implementation plan of the African Union’s Agenda 2063 long-term development vision.
Benin is a lower middle-income country in West Africa, bordered by Togo to the west, Nigeria to the east, Burkina Faso to the north-west, and Niger to the north-east. The country is a member of a number of international cooperations such as the African Union, the Economic Community of West African States, and the Organisation of Islamic Cooperation. The official language of Benin is French, although there are many indigenous languages spoken by citizens. Benin covers an area of 114 763 km2 and has a population of about 11.9 million as of 2019. The climate is quite hot and humid, with about two rainy seasons and two dry seasons each year. Four terrestrial ecoregions lie within Benin's borders: Eastern Guinean forests, Nigerian lowland forests, Guinean forest-savanna mosaic, and West Sudanian savanna. Administratively, Benin is divided into 12 departments which, in turn, are subdivided into 77 communes. The capital of Benin is Porto-Novo, but the seat of government is in Cotonou, the country's largest city and economic capital. Principal exports from Benin include ginned cotton, cotton cake and cotton seeds, cashew, shea butter, cooking oil, and lumber. The mineral resources of the country are limited, such that although there is some production of cement, clay, gold, sand and gravel, all are relatively insignificant to the country’s income. The nation’s only seaport and international airport is located in Cotonou.
Benin is the 9th most populous country in West Africa and the 29th most populous in Africa. The country had an estimated population of 11.9 million in 2019, up from 5 million in 1990 — an increase of 138% in the country’s population over the past 29 years. On the Current Path, the population of Benin is forecast to increase to 21.2 million by 2043, representing an approximate increase of 78.6% within the period. The relatively slower rate of population growth can be attributed to the adoption of improved birth control methods such as the use of contraceptives. Benin has a large youthful population with a youth bulge of 47.8% and a median age of 18.7 years in 2019. The youth bulge, defined as the ratio of the population between the ages of 15 and 29 to the total adult population, will remain above 40% in the Current Path forecast horizon. The large youth bulge in the country raises concerns about youth unemployment, which stood at about 5% in 2019, and underemployment. According to the School-to-Work Survey, the main factors hindering youth employment are the lack of professional experience and vocational and technical education, and support for young people as they search for jobs. To address these concerns, the government has embarked on a number of policies and programmes aimed at reducing youth unemployment. Some of these include entrepreneurship education and apprenticeship for work experience through the National Employment Agency. However, these programmes have been limited to only those who are tertiary graduates.
In addition, 42% of Benin’s population is below the age of 15 years and 27.7% is under the age of 30 years. The relatively large cohort of children under the age of 15 constrains the materialisation of the demographic dividend. With the expected decline in the fertility rate from 4.8 births per woman in 2019 to 3.1 births in 2043, the proportion of people below the age of 15 years is projected to fall to 33.8% over the next 24 years. This signals the likelihood of a larger adult population, increasing the share of people under the age of 64 years from 27% in 2019 to 33.7% in 2043. The average life expectancy in Benin was 66 years in 2019, and it is estimated to increase to 72.6 years in 2043. The relatively low life expectancy is mainly due to a high disease burden emanating from communicable and non-communicable diseases. With an expected decline in communicable diseases over the period, life expectancy is also projected to increase within the same period.
In 1990, the majority of Benin’s population (about 66%) resided in rural areas. However, over the past 29 years, the number of people residing in rural areas has steadily declined by 13 percentage points, from 66% in 1990 to 52.5% in 2019, suggesting an increase in the urban population. In 2016, about 40% of the total population lived in the urban areas surrounding Cotonou, which is the hub of commercial and political activity. The majority of people from rural areas migrate to urban centres due to poverty, harsh climatic conditions, unemployment, declining natural resources in the rural areas, and the search for greener pastures in the urban centres. Between 2024 and 2025, the country is expected to achieve parity in urban–rural settlement such that by 2043, about 58% of the Beninese population is projected to live in the urban areas.
The total land area of Benin is approximately 112 760 km2. In 2019, Benin was the seventh most densely populated country in West Africa and 13th most densely populated country in Africa. The population density of Benin is estimated to be about 1.1 people per hectare, which is higher than the average of 0.45 for Africa and 0.65 for West Africa. The southern part of Benin along the Gulf of Guinea is densely populated, while the central and northern parts of the country are sparsely populated. The largest city in the country is Cotonou, which is the de facto administrative capital due to its port. Cotonou also contains about two-thirds of all industries in Benin and serves as the centre of government. Other notably densely populated areas include the cities of Parakou, Djougou and Bohicon, and the capital city Porto-Novo.
A major challenge of the Benin economy is overdependence on volatile global cotton and oil prices. The country is 100% dependent on petroleum imports, making it vulnerable to dollar exchange rates and fluctuations in oil prices. The economy of Benin is also dependent on the economy of its main trading partner, Nigeria, such that any time there is a crisis in Nigeria, Benin is affected. The low commodity crises and global recession in the 1990s led to economic difficulties in the country in that decade. However, injections of external investment from both private and public sources mitigated these difficulties. The country has implemented a number of economic recovery and internationally assisted programmes, such as the Highly Indebted Poor Countries Initiative in 2005 that was aimed at economic growth and poverty reduction. Consequently, Benin has had sustained growth in the past years with average growth of 4.9% from 2012 to 2016. The GDP of Benin more than tripled from US$4.9 billion in 1990 to US$17.6 billion in 2019, representing an increase of 259% over the 29-year period. Over the next 22 years, Benin’s GDP is estimated to almost quadruple to US$66.3 billion from its 2019 level. The increase in GDP reflects the economic growth expected to occur within the next 22 years as compared to previous years.
Although many of the charts in the sectoral scenarios also include GDP per capita, this overview is an essential point of departure for interpreting the general economic outlook of Benin.
Benin’s GDP per capita has seen a steady increase over time, despite the country’s rapid population growth. The country increased its GDP per capita by about 53% from US$1 595 in 1990 to US$2 439 in 2019. The marginal increase in GDP per capita reflects the relatively high GDP growth compared to the population size over the period. With an expected increase in GDP and decline in fertility rates, it is projected that the GDP per capita will rise over the next 22 years, such that by 2043, the GDP per capita will more than double to US$4 685. Throughout the period under consideration, Benin’s GDP per capita was far lower than the average of lower middle-income countries in Africa. By 2043, Benin’s GDP per capita is projected to be US$4 457 lower than the projected average of US$9 142 for lower middle-income countries on the continent. This suggests that Benin either has a higher population growth rate or slower economic growth compared to the average lower middle-income country in Africa.
The Beninese economy largely relies on the informal sector, especially informal trade with its neighbouring country Nigeria. The informal sector accounts for about 90% of all employment in Benin. The size of the informal sector in Benin was equivalent to 40.9% of GDP in 2019; however, it is expected to decline to 33.7% by 2043, constituting a 7.2 percentage point decrease over the 24-year period. In 2019, the total number of people employed by the informal sector constituted 77.6% of the total labour force; this is expected to decline to 67.1% in 2043. It is therefore not surprising that the level of informality will also decline within the same period. This can partly be attributed to the government’s efforts, beginning in 2014, with the launch of the entreprenant status, a simplified free legal regime meant to entice small businesses to formalise their operations. This initiative contributed to the increased formalisation of small businesses in the country. Throughout the period under consideration, the size of the informal sector in Benin is higher than the average of lower middle-income African countries. This suggests that Benin has performed relatively poorly in formalising its economy compared to the average of other African countries within its income group.
The IFs platform uses data from the Global Trade and Analysis Project (GTAP) to classify economic activity into six sectors: agriculture, energy, materials (including mining), manufactures, services and information and communication technologies (ICT). Most other sources use a threefold distinction between only agriculture, industry and services with the result that data may differ.
The three largest contributing sectors to GDP in Benin are service, agriculture and manufacturing, respectively. In 2019, the service sector’s contribution to GDP was about US$8.8 billion (50.1% of GDP). It is not surprising given that the service sector employs 42.9% of the labour force. This contribution to GDP is expected to increase to US$36.6 billion (55.3% of GDP) by 2043. The agriculture sector, which employs about 38.3% of the total labour force, is currently the second largest contributor to GDP with a share of 23.6% (about US$4.2 billion) in 2019. Manufacturing is the third most significant contributor to GDP with a share of 21.1% (US$3.7 billion). However, it is expected that by 2022, the manufacturing sector will overtake the agriculture sector as the second largest contributor to GDP, so that by 2043, the manufacturing sector will contribute 20.1 percentage points more to GDP than agriculture. The growth of the manufacturing sector, which is vital for economic transformation and sustainable job creation, is good for the economy. However, although a dwindling agriculture sector is consistent with structural transformation of an economy, it raises concerns about food insecurity in the country. Authorities should improve agriculture productivity to ensure food security.
The data on agricultural production and demand in the IFs forecasting platform initialises from data provided on food balances by the Food and Agriculture Organization (FAO). IFs contains data on numerous types of agriculture but aggregates its forecast into crops, meat and fish, presented in million metric tons. Chart 9 shows agricultural production and demand as a total of all three categories.
In 1990, Benin’s demand for agricultural products outstripped domestic production by 0.19 million metric tons, which increased to 2.5 million metric tons in 2019. This can partly be attributed to the declining interest in the agriculture sector reflected in the share of total employment. From 1991 to 2019, the sector’s share of total employment reduced significantly from 50.9% to 38.3%. In addition, problems such as the lack of adoption of improved technology for farming, poor soil quality and unfavourable weather conditions have affected crop yield. Although the yield per hectare for crops is expected to increase from 4.3 metric tons in 2019 to 5.6 metric tons on the Current Path in 2043, the gap between demand and production will widen. By 2043, demand will outstrip domestic production by about 10.9 million metric tons, representing a 336% increase over the period. This raises concerns about food security in the country within the next 24 years. For instance, Benin depends on imports to meet its rice needs as domestic rice demand always exceeds domestic production capacity. In 2017, it was estimated that about 10% of the population faced food insecurity and 32% of young children suffered from chronic malnutrition.
There are numerous methodologies for and approaches to defining poverty. We measure income poverty and use GDP per capita as a proxy. In 2015, the World Bank adopted the measure of US$1.90 per person per day (in 2011 international prices), also used to measure progress towards the achievement of Sustainable Development Goal (SDG) 1 of eradicating extreme poverty. To account for extreme poverty in richer countries occurring at slightly higher levels of income than in poor countries, the World Bank introduced three additional poverty lines in 2017:
- US$3.20 for lower middle-income countries
- US$5.50 for upper middle-income countries
- US$22.70 for high-income countries.
As a lower middle-income country, Benin uses the US$3.20 per person per day benchmark. The fundamental causes of poverty in the country include the overreliance on the vulnerable agriculture sector that employs the majority of the population. Other factors include inequality in the distribution of resources to healthcare and education as well as an economic gender gap. As of 2019, 70.8% of Benin’s population (7.9 million people) were surviving on US$3.20 per day, and it is projected to increase to about 11 million people (51.9% of the population) in 2043. This means that although the proportion of the poor population will reduce by 18.9 percentage points, the absolute number of poor people in the country will be 2.6 million people more than the level in 2019 due to the population growth rate that is outpacing development progress. Throughout the period under consideration, the proportion of poor people in Benin is higher than the average of lower middle-income countries in Africa, such that by 2043, the extreme poverty rate in Benin is 11.4 percentage points above the projected average of 38.3 % for lower middle-income countries in Africa.
The IFs platform forecasts six types of energy, namely oil, gas, coal, hydro, nuclear and other renewables. To allow comparisons between different types of energy, the data is converted into billion barrels of oil equivalent (BBOE). The energy contained in a barrel of oil is approximately 5.8 million British thermal units (MBTUs) or 1 700 kilowatt-hours (kWh) of energy.
Benin largely relies on imports to meet its energy demands. For instance, about 85% of electricity consumption is sourced from imports from Ghana, Côte d’Ivoire and Nigeria. From 1990 to 1998, oil was the sole energy produced by Benin with a total production of 1.5 million BOE in 1990 which declined to 0.4 million BOE in 1998. However, from 1999 to 2014, there was no energy produced in the country. This probably can be attributed to the depletion of the oil reserves in the country. Benin has vast unused renewable energy potential; however, low domestic capacity and expertise as well as low domestic capital formation continue to hinder the realisation of this potential. From 2015, the country began production of renewable energies such that they are now the sole energy produced in the country. In 2019, the total amount of renewable energy produced was 0.1 million BOE. This is projected to increase to 0.5 million BOE in 2043 as the sole energy produced by the country.
Carbon is released in many ways, but the three most important contributors to greenhouse gases are carbon dioxide (CO2), carbon monoxide (CO) and methane (CH4). Since each has a different molecular weight, IFs uses carbon. Many other sites and calculations use CO2 equivalent.
Benin is one of the countries in Africa with significantly low levels of carbon emissions. The low level of carbon emissions can partly be attributed to the low level of industrial activity and reliance on solar as the only energy produced in the country. Regardless, carbon emissions have increased steadily from nearly zero in 1990 to 2 million tons of carbon in 2019. On the Current Path, carbon emissions are forecast to increase to 7 million tons by 2043. It is interesting to note that while the country is shifting toward renewable energy as the sole energy type produced, carbon emissions will continue to increase. This may be as a result of the increased use of biomass driven by population growth and the projected increase in industrial activity in coming years.
Sectoral Scenarios for Benin Development Futures
Download to pdfThe Stability scenario represents reasonable but ambitious reductions in risk of regime instability and lower levels of internal conflict. Stability is generally a prerequisite for other aspects of development and this would encourage inflows of foreign direct investment (FDI) and improve business confidence. Better governance through the accountability that follows substantive democracy is modelled separately.
The intervention is explained here in the thematic part of the website.
This scenario generally signifies increased political stability, reduced internal conflict, high FDI inflows, improved and accountable governance and low levels of corruption in the country. Benin has had relative political stability since the adoption of its current constitution in 1991. Since then, there have been a total of 14 presidential and parliamentary elections that have led to the alternation of power among five leaders, although there have been some reported irregularities. However, political reforms embarked on by the incumbent President Tolon are impacting Benin’s multiparty credentials. The new rules governing political parties have reduced the number of parties from the over 200 that existed in 2018 to 10 in 2019, with only five obtaining their registration. Also, the decision by the constitutional court to bar three parties, which were mainly pro-opposition, from taking part in the 2019 National Assembly elections weakened accountability, representative democracy and raised tensions in the country. In 2019, Benin’s score on the governance security index was 0.74, which is higher than the 0.72 average of lower middle-income countries in Africa. In the Stability scenario, the country’s score is projected to rise to 0.86 in 2043, which is 0.08 points above the Current Path forecast in the same year. Compared to the average of lower middle-income countries in Africa, Benin’s score in 2043 will be 0.1 more than the average of lower middle-income countries in Africa.
In 2019, the GDP per capita for Benin was US$2 439, which was far less than the average of US6 989 for lower middle-income countries in Africa. In the Stability scenario, GDP per capita is projected to increase to US$4 817 by 2043. This expected growth in GDP can be explained by the fact that political stability inspires investor confidence and stimulates domestic and foreign investments, which are essential for economic growth. While the GDP per capita will be US$132 more than the Current Path forecast in 2043, it will still be US$4 325 below the average of lower middle-income countries in Africa.
As Benin is a lower middle-income country, it uses the global benchmark of US$3.20 per day. In 2019, 8.4 million people (about 70.8% of the population) were living on less than US$3.20 per day. The Stability scenario will reduce the number of people living below the poverty line to 50.7% by 2043, which is 1.2 percentage points below the Current Path forecast but 12.4 percentage points above the average of lower middle-income countries in Africa. Nonetheless, the number of poor people will rise marginally from 8.4 million people in 2019 to 10.7 million people in 2043 in the Stability scenario. The materialisation of the Stability scenario could lead to 260 000 fewer poor people than the Current Path in 2043.
This section presents the impact of a Demographic scenario that aims to hasten and increase the demographic dividend through reasonable but ambitious reductions in the communicable-disease burden for children under five, the maternal mortality ratio and increased access to modern contraception.
The intervention is explained here in the thematic part of the website.
Demographers typically differentiate between a first, second and even a third demographic dividend. We focus here on the contribution of the size of the labour force (between 15 and 64 years of age) relative to dependants (children and the elderly) as part of the first dividend. A window of opportunity opens when the ratio of the working-age population to dependants is equal to or surpasses 1.7.
In 2019, the ratio of working-age persons to dependants was 1.2:1, meaning that there were 1.2 working-age persons for each dependant in the country. This is less than the average of 1.32 for lower middle-income countries in Africa. Generally, the demographic dividend materialises when the country reaches a minimum ratio of 1.7 working-age persons for each dependant. While in the Current Path forecast the country will not reach its demographic dividend by 2043, in the Demographic scenario, Benin is expected to reach this minimum ratio by 2043. This is two years later than the average of lower middle-income countries in Africa. The materialisation of the demographic dividend in the Demographic scenario can be explained by increased access to modern contraceptives which will lead to a decline in fertility rates.
The infant mortality rate is the number of infant deaths per 1 000 live births and is an important marker of the overall quality of the health system in a country.
The infant mortality rate in Benin in 2019 was 48.7 deaths per 1 000 live births. Although this figure is high, it is relatively lower than the average of 46.4 deaths per 1 000 live births for lower middle-income countries in Africa. By 2043, the Demographic scenario will lead to a decline in infant mortality to 17 deaths per 1 000 live births, which is 3.5 deaths fewer than the Current Path forecast and 12.7 deaths fewer than the average of lower middle-income countries in Africa.
In 2019, the GDP per capita for Benin was US$2 439, which is far below the US$6 989 average of lower middle-income African countries. By 2043, it is estimated that based on the Demographic scenario, the GDP per capita will increase to US$4 783, which is US$98 more than the projected US$4 685 on the Current Path in the same year. However, this will still be significantly lower the US$9 142 average of low-income countries in Africa. The additional increase in the GDP per capita as a result of the Demographic scenario can partly be attributed to the reduction in population growth as a result of the decline in fertility rates emanating from improved access to contraceptives. It can also be attributed to economic growth arising from the materialisation of the demographic dividend.
As noted earlier, the number of people in Benin living below the poverty line of US$3.20 per day in 2019 was 8.4 million. In the Demographic scenario, this number will steadily rise to 10.4 million in 2043, which will be 540 000 fewer than in the Current Path forecast. Similarly, the proportion of the poor population will be reduced to 50.9% in the Demographic scenario, which is about 1.03 percentage points lower than in the Current Path forecast but 12.6 percentage points higher than the average of lower middle-income countries in Africa in 2043. The decline in both the number and portion of poor people in the Demographic scenario compared to the Current Path forecast reflects the decline in the population size as a result of modern contraceptive use that reduce fertility rates.
This section presents reasonable but ambitious improvements in the Health/WaSH scenario, which include reductions in the mortality rate associated with both communicable diseases (e.g. AIDS, diarrhoea, malaria and respiratory infections) and non-communicable diseases (NCDs) (e.g. diabetes), as well as improvements in access to safe water and better sanitation. The acronym WaSH stands for water, sanitation and hygiene.
The intervention is explained here in the thematic part of the website.
The healthcare system in Benin is underfunded. As of 2019, the Benin government’s total expenditure on healthcare was estimated to be about only 3.3%. An increase in life expectancy can be a result of an improved health system that reduces deaths by communicable and non-communicable diseases. It can also be achieved through improved sanitation and access to safe water. In 2019, the life expectancy at birth for the average Beninese was 66 years, which was below the average of 67.5 for lower middle-income countries in Africa. On average, females have a higher life expectancy at birth (68 years) compared to males (64 years). In the Health/WaSH scenario, life expectancy is estimated to increase to about 73.2 years by 2043, which is above the Current Path forecast of 72.8 years and about a year below the average of 73.4 for lower middle-income African countries. This increased life expectancy in the country can be attributed to the expected reduction in mortality from communicable diseases such as typhoid fever, tuberculosis, cholera and meningitis, which have high risks of infection that may result in death. However, deaths from non-communicable diseases continue to be a challenge. Females will continue to have a higher life expectancy than males with a difference of about five years by 2043.
In 2019, the infant mortality rate per 1 000 live births in Benin was 48.7 deaths. By 2043, infant mortality per 1 000 live births in the country will be 19.4 deaths in the Health/WaSH scenario and 20.5 deaths in the Current Path forecast. This means that infant mortality is reduced more quickly in the Health/WaSH scenario than in the Current Path forecast.
The Agriculture scenario represents reasonable but ambitious increases in yields per hectare (reflecting better management and seed and fertiliser technology), increased land under irrigation and reduced loss and waste. Where appropriate, it includes an increase in calorie consumption, reflecting the prioritisation of food self-sufficiency above food exports as a desirable policy objective.
The intervention is explained here in the thematic part of the website.
The data on yield per hectare (in metric tons) is for crops but does not distinguish between different categories of crops.
In 2019, the average yield per hectare of crops was 4.3 metric tons, which was below the average of 5.1 metric tons per hectare for lower middle-income countries in Africa. In the Current Path forecast, this is projected to increase to about 5.6 metric tons per hectare by 2043. However, in the Agriculture scenario, the average yield will be about 8.2 metric tons per hectare in 2043, 2.6 metric tons above the Current Path forecast. This means that Benin could improve agricultural production by adopting modern methods of farming including the use of fertiliser and improved seeds.
Benin is import dependent when it comes to agriculture although the country has a youthful population and many livelihoods depend on it. Challenges facing the agriculture sector include the lack of adoption of improved technology for farming, poor transportation networks, inadequate storage and processing facilities, poor soil quality and unfavourable weather conditions. As a result, the country has always had a net positive import dependence as a per cent of total demand. In 2019, the net agricultural import was 16.3% of agricultural demand in the country, which was above the average of lower middle-income countries in Africa. The Current Path forecast projects that import dependence will grow to 35.1% of total demand by 2043. The situation is mitigated in the Agriculture scenario such that by 2043, the country will be a net importer of agricultural products with a balance of 7% of total agricultural demand. This is lower than the projected average in the scenario for lower middle-income countries by about 5.7 percentage points, suggesting that there is a lot of untapped potential in terms of agriculture production.
The Agriculture scenario is expected to lead to an increase in the GDP per capita over the years. As a result of the Agriculture scenario, by 2043, the GDP per capita will increase from US$2 439 in 2019 to US$4 928, constituting about a 102.1% increase over the period. These estimates are greater than the projections in the Current Path forecast such that by 2043, the additional gains from GDP per capita as a result of the Agriculture scenario will be US$243. In the Agriculture scenario, Benin’s GDP per capita will remain below average of lower middle-income countries in Africa. Furthermore, by 2043, the GDP per capita of Benin will be a little over half that of the average of lower middle-income countries in Africa.
In the Current Path forecast, about 11 million people (59.1% of the population) are projected to live on less than US$3.20 per day by 2043. However, in the Agriculture scenario, both the number and proportion of people living below the poverty line of US$3.20 will be reduced. By 2043, the number of poor people is projected to fall to 9.9 million (47% of the population). This means that a little over one million additional Beninese can be lifted out of extreme poverty by focusing primarily on agricultural growth. This is not surprising given that a significant proportion of people in Benin, especially from rural areas, are employed within the agriculture sector, and the many interventions in improving the sector are likely to have a greater impact on poverty reduction. Throughout the period under consideration in the Agriculture scenario, the proportion of people living in extreme poverty in Benin will be far higher than the average of lower middle-income countries in Africa. By 2043, the poverty rate in Benin will be about 13.5 percentage points above the average of lower middle-income countries in Africa.
The Education scenario represents reasonable but ambitious improved intake, transition and graduation rates from primary to tertiary levels and better quality of education. It also models substantive progress towards gender parity at all levels, additional vocational training at secondary school level and increases in the share of science and engineering graduates.
The intervention is explained here in the thematic part of the website.
The main challenges of the education system in Benin are high absenteeism among teachers, due to low remuneration, and the lack of adequate capacity to manage the educational system. Primary education in Benin is free and compulsory, which has increased enrolment at the basic level. However, the dropout rate among students is high, with regional inequalities. While both the access and completion rate are high in the southern part of the country, the completion rate in the northern part, which is more rural, is low. In 2019, Benin’s mean years of education was 5.7, which is below the average of 7.2 for lower middle-income countries in Africa. In terms of gender, the mean years of education for males is 6.8, which is 2.1 years more than the average of 4.7 years for females. This means that on average, men are more likely to attain a higher level of education than women. The gap in favour of men for mean years of education in Benin is higher than the average of 1.3 years for lower middle-income countries on the continent. By 2043, in the Education scenario, it is expected that the mean years of education will rise to 7.9 years, which will be 0.3 years more than the Current Path estimate and 0.9 years less than the average of lower middle-income countries in Africa. Also, based on the Education scenario forecast, the gender gap regarding mean years of education will reduce by 0.7 years by 2043, while the gender gap closes by 0.4 years for the average lower middle-income countries in Africa within the same period.
The average test score for primary learners in Benin in 2019 was 27.3%, which was higher than the 33.6% for the average of lower middle-income countries in Africa, signifying relatively lower performance in this regard. The Education scenario will increase the average test scores for primary learners to 38.5%, compared to the Current Path forecast estimated at 33%. Furthermore, by 2043, the Education scenario will result in 3.2 percentage points more than the average of lower middle-income African countries.
In 2019, the average secondary learner test score for Benin was 37.8%, which is below the average of 41.7% for lower middle-income African countries. Benin performs relatively better at secondary level than at the primary level. By 2043, the average test score for secondary learners in the Education scenario is projected to rise to 49.5%, which is 8.3 percentage points above the Current Path estimates of 41.2% and the average of 41.8% for lower middle-income countries in Africa.
By 2043, the increase in the GDP per capita as a result of the Education scenario is estimated to be US$4 846, which is US$161 more than the projected GDP per capita of US$4 685 in the Current Path forecast. This suggests that an investment in education increases the human capital formation of a country, improves productivity and ultimately drives growth of the economy. The projected GDP per capita is however lower than the average of US$9 142 for lower middle-income countries in Africa.
By 2043, in the Education scenario, there will be 5.8 million poor people (27.4% of the population). This means that the Education scenario will contribute to reducing the number of poor people by 350 000 people in 2043 compared to the Current Path forecast, suggesting that although education is a powerful tool to reduce poverty, it takes time — often decades — to produce the expected results. Also, the proportion of poor people in Benin based on the Education scenario will be 11.9 percentage points higher than the average of lower middle-income countries in Africa.
The Manufacturing/Transfers scenario represents reasonable but ambitious manufacturing growth through greater investment in the economy, investments in research and development, and promotion of the export of manufactured goods. It is accompanied by an increase in welfare transfers (social grants) to moderate the initial increases in inequality that are typically associated with a manufacturing transition. To this end, the scenario improves tax administration and increases government revenues.
The intervention is explained here in the thematic part of the website.
Chart 30 should be read with Chart 8 that presents a stacked area graph on the contribution to GDP and size, in billion US$, of the Current Path economy for each of the sectors.
In the Manufacturing/Transfers scenario, the service sector will be the largest contributor to GDP with an absolute contribution of US$4.4 billion more by 2043 compared to the Current Path forecast. The rate of contribution to GDP by the service sector will decline until it reaches a minimum at -0.21 percentage points difference in 2035 and increase thereafter to 0.51 percentage points in 2043. The manufacturing sector, which is the second largest contributor, is also projected to contribute an additional US$2.2 billion to GDP by 2043. However, its rate of contribution will increase and peak at a 0.94 percentage point difference and decline afterwards to a 0.12 percentage point difference to GDP based on the Manufacturing/Transfers scenario. Although the third contributor to GDP in Benin is the ICT sector, with a contribution of US$0.47 billion, its rate of contribution will marginally overtake the manufacturing sector as the second largest contributor by 2043. It is significant to note that the rate of the contribution of the agriculture sector to GDP based on the difference between the Manufacturing/Transfer scenario and the Current Path forecast is negative and declining throughout the period, such that by 2043, its rate of contribution will be a -0.75 percentage point difference. While a decline in the share of agricultural contribution to GDP can be attributed to structural transformation of the economy, it raises concerns about food security and the trade deficit of the country.
The Beninese government’s welfare transfers to households are significantly low. In 2019, total welfare transfers to households were US$0.36 billion. This is projected to increase to US$2.8 billion by 2043 in the Manufacturing/Transfers scenario, representing a 686.1% increase over the period. This suggests that the Manufacturing/Transfers scenario can lead to an improvement in government welfare transfers by an additional US$0.93 billion compared to the Current Path in 2043.
By 2043, it is estimated that the GDP per capita will rise to US$5 034, which is US$349 more than projections from the Current Path forecast. The GDP per capita for Benin in the Manufacturing/Transfers scenario will however still be below the average of US$9 142 for lower middle-income countries in Africa by 2043.
By 2043, the total number of poor people is projected to be around 10.4 million (49.1% of the population) in the Manufacturing/Transfers scenario. This is higher than the projected 11.0 million people (51.9%) on the Current Path, suggesting that the Manufacturing/Transfers scenario can lead to 620 000 more people being lifted above the poverty line of US$3.20 per day. Nonetheless, the proportion of poor people in Benin based on the Manufacturing/Transfers scenario in 2043 will be about 11 percentage points above the average of lower middle-income countries in Africa.
The Leapfrogging scenario represents a reasonable but ambitious adoption of and investment in renewable energy technologies, resulting in better access to electricity in urban and rural areas. The scenario includes accelerated access to mobile and fixed broadband and the adoption of modern technology that improves government efficiency and allows for the more rapid formalisation of the informal sector.
The intervention is explained here in the thematic part of the website.
Fixed broadband includes cable modem Internet connections, DSL Internet connections of at least 256 KB/s, fibre and other fixed broadband technology connections (such as satellite broadband Internet, ethernet local area networks, fixed-wireless access, wireless local area networks, WiMAX, etc.).
Broadband increases productivity, reduces transaction costs and optimises supply chains, positively affecting economic growth. In 2019, the total number of fixed broadband subscriptions was 4.1 per 100 people, which was slightly above the average of 3.7 for lower middle-income countries in Africa. In the Current Path forecast, fixed broadband subscriptions are expected to rise to 34.3 per 100 people. The Leapfrogging scenario will lead to a greater increase in fixed broadband subscriptions compared to the Current Path forecast, with a difference of almost 16 subscriptions per 100 people by 2043. This means that the additional fixed broadband subscriptions as a result of the Leapfrogging scenario is 16 subscriptions per 100 people in 2043. Across the forecast horizon, the fixed broadband subscription in Benin is expected to be higher than the average of lower middle-income African countries.
Mobile broadband refers to wireless Internet access delivered through cellular towers to computers and other digital devices.
In 2019, Benin had 21.6 mobile broadband subscriptions per 100 people, which was below the average of 49.1 for lower middle-income countries on the continent. Although between 2024 and 2028, mobile broadband subscriptions in the Leapfrogging scenario rise above those in the Current Path forecast, in the long term, the Leapfrogging scenario and the Current Path forecast converge. By 2043, mobile broadband subscriptions in the Current Path forecast and the in Leapfrogging scenario increase to 152.9 per 100 people, above the average of 147.6 for Africa’s lower middle-income countries.
The number of Beninese with access to electricity in 2019 was 4.8 million people (40.8% of the total population). This is far below the average of 66.3% for lower middle-income countries in Africa. There exists an urban–rural inequality in terms of access to electricity: in 2019, while about 65.3% of people in urban centres had access to electricity, only 18.9% of rural dwellers had access to electricity. In the Leapfrogging scenario, it is projected that by 2043, about 80.9% of Beninese (17.1 million people) will have access to electricity. This is higher than the 68.8% (14.6 million people) projected in the Current Path forecast, signifying that the Leapfrogging scenario can provide access to electricity to an additional 2.5 million people compared to the Current Path in 2043. It is however below the projected average of 81.7% for lower middle-income countries in Africa. By 2043, 93% and 86.6% of urban dwellers in Benin will have access to electricity in the Leapfrogging scenario and in the Current Path forecast, respectively. In the case of rural dwellers, 64.7% and 45.1% will have access to electricity by 2043 in the Leapfrogging scenario and in the Current Path forecast, respectively.
Technology is an important driver of economic growth as it increases efficiency and productivity which promote economic growth. Benin’s GDP per capita is projected to increase from US$2 439 in 2019 to US$5 040 in 2043 in the Leapfrogging scenario. This represents an increase of US$355 compared to the Current Path forecast in 2043. However, this still falls below the average of US$9 142 for lower middle-income countries in Africa.
In the Leapfrogging scenario, the number of poor people in 2043 is projected to be 10.4 million (49.2% of the population). This projection is lower than the 11 million people estimated in the Current Path forecast in the same year, which suggests that the number of poor people in the Leapfrogging scenario is about 600 000 fewer people than the Current Path forecast in 2043. The number of poor people projected in the Leapfrogging scenario is 10.2 percentage points higher than the average of lower middle-income African countries in 2043.
The Free Trade scenario represents the impact of the full implementation of the African Continental Free Trade Area (AfCFTA) by 2034 through increases in exports, improved productivity and increased trade and economic freedom.
The intervention is explained here in the thematic part of the website.
The trade balance is the difference between the value of a country's exports and its imports. A country that imports more goods and services than it exports in terms of value has a trade deficit, while a country that exports more goods and services than it imports has a trade surplus.
Benin, like many African economies, is a net importer of goods and services. In 2019, Benin’s trade deficit represented 6.2% of GDP. Although the country exports commodities such as raw cotton, refined petroleum, gold, coconuts and cashews for markets in Nigeria, Bangladesh, China and India, the huge trade deficit is mainly due to the importation of fuel, food and capital equipment mainly from Togo, Ghana, France, Belgium, the UK and China. From 2024 to 2038, the Free Trade scenario leads to a quicker improvement in trade balance compared to the Current Path forecast, reaching a peak of a deficit of 1.1% of GDP in 2032 before declining. However, the trend reverses thereafter so that by 2043 the Current Path forecast leads to a deficit of 2.3% compared to the 4.6% deficit in the Free Trade scenario. This suggests that the full implementation of the AfCFTA can improve the trade balance of Benin in the short term. However, in the long term, intense competition from other African countries will reduce Benin’s exports while imports will increase as a result of free trade. Although Benin’s trade deficit as a percentage of GDP of 6.2% was lower than the average of lower middle-income African countries, from 2038, the situation will reverse in the Free Trade scenario, such that by 2043 Benin’s trade deficit will be 1.3 percentage points of GDP higher than the average of lower middle-income African countries on the Current Path.
The GDP per capita for Benin is estimated to increase to US$5 166 by 2043 in the Free Trade scenario, which is US$481 more than the projections on the Current Path in 2043. This means that if Benin takes advantage of the AfCFTA to increase trade and productivity, it could significantly improve economic growth and income per capita above the Current Path forecast. Nevertheless, the average GDP per capita for Benin is lower than the projected US$9 142 for lower middle-income African countries in the Free Trade scenario.
From 2026 to 2033, the Current Path forecast leads to a much quicker reduction in poverty compared to the Free Trade scenario. However, from 2034, the Free Trade scenario will lead to a greater reduction in both the number and proportion of poor people compared to the Current Path forecast. By 2043, the number of people living below the poverty line of US$3.20 per day will be about 9.9 million people (47.1% of the population). This is 4.8 percentage points lower than the Current Path forecast, meaning that the Free Trade scenario has one million fewer poor people than the Current Path forecast by 2043; though the proportion of poor people projected in the Free Trade scenario is still higher than the average of lower middle-income countries in Africa.
The Financial Flows scenario represents a reasonable but ambitious increase in worker remittances and aid flows to poor countries, and an increase in the stock of foreign direct investment (FDI) and additional portfolio investment inflows to middle-income countries. We also reduced outward financial flows to emulate a reduction in illicit financial outflows.
The intervention is explained here in the thematic part of the website.
The total foreign aid received by Benin in 2019 was 4.9% of GDP (US$602.2 million), which is far higher than the average of 1.7% for lower middle-income countries in Africa. Most of this aid has gone into budget support; for instance, between 2005 and 2009, the average budget support from foreign donors increased by about 14%. The influx of aid to the country was mainly for humanitarian reasons, especially during Togo’s political crisis in 2005 during which many Togolese fled to Benin. Although foreign aid to Benin in absolute terms is projected to rise, foreign aid as a percentage of GDP is expected to decline further such that by 2043, the total foreign aid received by the country is projected to be 2.3% of GDP in the Financial Flows scenario and 2.1% of GDP in the Current Path forecast. This suggests that in the Financial Flow scenario, foreign aid as a percentage of GDP is higher than in the Current Path forecast in 2043. Furthermore, these projections are still higher than the average of lower middle-income African countries. The decline in foreign aid is expected though, given that Benin recently became a lower middle-income country, which automatically disqualifies the country from certain aid packages.
Benin’s total FDI in 2019 amounted to 1.2% of GDP, which was higher than the average of 2.6% for lower middle-income African countries. This suggests that FDI to Benin has been relatively low compared to the average of its income group peers. Some factors hindering FDI growth in the country include corruption, erratic electricity supply and poor infrastructural networks. In an effort to increase FDI to the country, the government has implemented a number of reforms — key among them are multiple tax incentives, a single business registration desk and a unified regulatory framework for public–private partnerships. The current Synthetic Professional Tax regime also favours the establishment of small businesses. By 2043, it is projected that the total FDI to the country will be about 1.6% of GDP in the Current Path forecast. In the Financial Flows scenario, FDI is projected to be around 1.8% of GDP in 2043, which is still below the projected average of 3.5% for lower middle-income countries on the continent. FDI can act as a catalyst for economic development as it brings much-needed capital and technology to the recipient countries. The Benin government should continue its reforms to attract more FDI, especially manufacturing FDI.
In 2019, the total value of remittances that Benin received amounted to US$0.05 billion, which constituted about 0.3% of GDP. This is significantly lower than the average of 2.6% for lower middle-income African countries, depicting relatively lower levels of remittances to the country. Both the absolute value of remittances and remittances as a percentage of GDP are projected to fall over the forecast period. In the Financial Flows scenario, remittance is projected to fall to US$-0.24 billion, representing -0.35% of GDP. Remittances will decline quicker in the Current Path forecast, so that by 2043 the total value of remittances in the country will be about US$-0.28 billion, representing -0.43% of GDP. This suggests that Benin will become a net provider of remittances by 2043.
Benin’s GDP per capita is estimated to rise to US$4 743 by 2043 in the Financial Flows scenario. This represents an increase of US$58 over the Current Path forecast in the same year. However, the US$4 743 estimate is below the average of lower middle-income countries in Africa, which is projected to be US$9 142 by 2043.
Trade openness will reduce poverty in the long term after initially increasing it due to the redistributive effects of trade. Most African countries export primary commodities and low-tech manufacturing products, and therefore a continental free trade agreement (AfCFTA) that reduces tariffs and non-tariff barriers across Africa will increase competition among countries in primary commodities and low-tech manufacturing exports. Countries with inefficient, high-cost manufacturing sectors might be displaced as the AfCFTA is implemented, thereby pushing up poverty rates. In the long term, as the economy adjusts and produces and exports its comparatively advantaged (lower relative cost) goods and services, poverty rates will decline.
In the Financial Flows scenario, about 10.9 million people (51.3% of the total population) are projected to live below the poverty line of US$3.20 per day in 2043. This estimate constitutes a reduction of about 130 000 people compared to the Current Path in the same year. It is also higher than the projected average of 38.3% for lower middle-income countries in Africa in 2043.
The Infrastructure scenario represents a reasonable but ambitious increase in infrastructure spending across Africa, focusing on basic infrastructure (roads, water, sanitation, electricity access and ICT) in low-income countries and increasing emphasis on advanced infrastructure (such as ports, airports, railway and electricity generation) in higher-income countries.
Note that health and sanitation infrastructure is included as part of the Health/WaSH scenario and that ICT infrastructure and more rapid uptake of renewables are part of the Leapfrogging scenario. The interventions there push directly on outcomes, whereas those modelled in this scenario increase infrastructure spending, indirectly boosting other forms of infrastructure, including that supporting health, sanitation and ICT.
The intervention is explained here in the thematic part of the website.
Access to electricity is essential for economic growth as firms rely heavily on electricity for production. In 2019, 4.8 million people (40.8% of the population) had access to electricity in Benin, and this is expected to increase to 16 million in 2043 (75.5% of the population) in the Infrastructure scenario. This increase exceeds the projected value of 14.6 million people (68.8% of the population) in the Current Path forecast in the same year. In terms of the urban–rural dichotomy, the urban population with access to electricity will increase from 65.3% in 2019 to 86.6% and 88.3% in the Current Path forecast and the Infrastructure scenario, respectively. In contrast, the proportion of rural dwellers with access to electricity will increase to 45.1% and 58.4% in the Current Path forecast and the Infrastructure scenario, respectively.
The Government of Benin is building generation assets, expanding transmission capacity, and modernising its distribution network, while expanding access through grid and off-grid connections. The government has demonstrated commitment to power sector reform by installing a management contract to run its national electricity distribution utility, SBEE (Société Béninoise d'Energie Electrique), as well as enacting a new energy code.
Indicator 9.1.1 in the Sustainable Development Goals refers to the proportion of the rural population who live within 2 km of an all-season road and is captured in the Rural Access Index.
Accessibility to rural areas is important in spurring the socio-economic development of a country and improving the living standards of rural dwellers. It enables rural dwellers to enjoy amenities from nearby urban areas while allowing urban centres to also benefit from the agricultural products supplied by rural areas more easily. In 2019, 35.9% of all rural dwellers in Benin resided within 2 km of an all-weather road, which was far below the average of lower middle-income African countries. In the Infrastructure scenario, this figure is expected to rise to 47.6% by 2043 — higher than the 45.9% projected in the Current Path forecast but below the average of 67.8% for lower middle-income countries in Africa.
Investment in infrastructure facilitates trade, promotes economic inclusion and improves productivity and growth. Benin’s GDP per capita is estimated to rise to US$4 902 by 2043 in the Infrastructure scenario. This is US$218 more than the projection in the Current Path forecast in the same year but below the average of US$9 142 for lower middle-income countries in Africa.
The proportion of the poor population is expected to decline from 70.8% in 2019 to 50.1% in 2043 in the Infrastructure scenario. This corresponds to 10.6 million poor people in 2043 who will live below the poverty line. Comparing this with the projections in the Current Path forecast suggests that there will be 370 000 fewer poor people in the Infrastructure scenario than in the Current Path forecast for the same year. The poverty rate in the scenario in 2043 will however be higher than the estimated average of 38.3% for lower middle-income countries in Africa.
The Governance scenario represents a reasonable but ambitious improvement in accountability and reduces corruption, and hence improves the quality of service delivery by government.
The intervention is explained here in the thematic part of the website.
As defined by the World Bank, government effectiveness ‘captures perceptions of the quality of public services, the quality of the civil service and the degree of its independence from political pressures, the quality of policy formulation and implementation, and the credibility of the government’s commitment to such policies’.
Chart 51 presents the impact of the interventions in the Governance scenario on government effectiveness.
In 2019, Benin’s score for government effectiveness was 1.96, which was above the average of 1.89 for lower middle-income countries in Africa. In both the Current Path forecast and Governance scenario, government effectiveness is estimated to increase over the period under consideration, although the increase in the Governance scenario is higher than the increase in the Current Path forecast. The projected score for government effectiveness in the Governance scenario in 2043 will be 2.5, which is 0.07 more than the projected score in the Current Path forecast. Also, Benin has a higher score in government effectiveness compared to the average of 2.3 for lower middle-income countries in Africa.
In the Governance scenario, Benin’s GDP per capita is projected to increase to US$4 800 in 2043, which is US$115 more than the estimates in the Current Path forecast but lower than the average of US$9 142 for lower middle-income countries in Africa in the same year. This suggests that good governance in the form of reducing corruption and improving the quality of service delivery and accountability can stimulate economic growth and increase income levels. Authorities in Benin should therefore make efforts to improve governance.
In the Governance scenario, the proportion of people living below the poverty line of US$3.20 per day is expected to decline to 50.9% in 2043, which is higher than the 38.3% average of lower middle-income African countries. It also corresponds to about 220 000 people fewer than the 4.4 million poor people projected in the Current Path forecast for 2043.
This section presents projections for carbon emissions in the Current Path for Benin and the 11 scenarios. Note that IFs uses carbon equivalents rather than CO2 equivalents.
The total amount of carbon emitted by Benin in 2019 was 2.2 million tons. The country’s carbon emissions are projected to increase in all the scenarios with total emissions of carbon estimated to be around 10.1 million tons of carbon by 2043. The intervention with the greatest impact on carbon emissions is the Free Trade scenario, which will lead to an increase in Benin’s carbon emissions by 7.8 million tons in 2043. This is followed by the Leapfrogging and Agriculture scenarios with projected increases in carbon emissions of 7.7 and 7.6 million tons, respectively, by 2043.
The Combined Agenda 2063 scenario consists of the combination of all 11 sectoral scenarios presented above, namely the Stability, Demographic, Health/WaSH, Agriculture, Education, Manufacturing/Transfers, Leapfrogging, Free Trade, Financial Flows, Infrastructure and Governance scenarios. The cumulative impact of better education, health, infrastructure, etc. means that countries get an additional benefit in the integrated IFs forecasting platform that we refer to as the synergistic effect. Chart 55 presents the contribution of each of these 12 components to GDP per capita in the Combined Agenda 2063 scenario as a stacked area graph.
The synergistic effect of all the scenarios on the GDP per capita is estimated to be about US$476 in 2043. The scenario with the greatest impact on GDP per capita by 2043 is the Free Trade scenario, followed by the Leapfrogging and Manufacturing/Transfers scenarios, while the scenario with the least impact on GDP per capita is Health/WaSH. This suggests that in the long term, the Free Trade and Leapfrogging scenarios have the greatest potential to improve human and economic development in Benin.
Whereas Chart 55 presents a stacked area graph on the contribution of each scenario to GDP per capita as well as the additional benefit or synergistic effect, Chart 56 presents only the GDP per capita in the Current Path forecast and the Combined Agenda 2063 scenario.
Benin’s GDP per capita is estimated to increase to US$7 421 in 2043 in the Combined Agenda 2063 scenario. This is US$2 937 more than the projection in the Current Path forecast, meaning that the Combined Agenda 2063 scenario will lead to an additional increase of US$2 736 in GDP per capita in 2043 compared to the Current Path. However, Benin’s GDP per capita in the Combined Agenda 2063 scenario will still be below the average of US$9 142 for lower middle-income countries in Africa in 2063.
In the Combined Agenda 2063 scenario, the number of poor people will significantly decline such that by 2043, 6.4 million Beninese, representing 31.8% of the population, will be living below the poverty line of US$3.20 per day. This means that, compared with the Current Path, an additional 4.6 million people can be lifted out of extreme poverty in the Combined Agenda 2063 scenario. The projections for the proportion of poor people in Benin in the Combined Agenda 2063 scenario will be lower than the average of 38.3% for lower middle-income African countries by 2043.
See Chart 8 to view the Current Path forecast of the sectoral composition of the economy.
In the Combined Agenda 2063 scenario, the biggest contributors to GDP in the long term are the service, manufacturing and agriculture sectors, respectively. By 2043, the service sector will contribute an additional US$28 billion to GDP, which corresponds to 0.01 percentage points of GDP larger than the Current Path forecast. Manufacturing, which is projected to contribute US$34.9 billion in 2043, will witness a growth in its rate of contribution so that by 2043, its contribution will amount to 1.1 percentage points of GDP above the Current Path. Although agriculture will contribute US$3 billion more, in terms of percentage of GDP, its contribution will decline by 1.1 percentage points compared to the Current Path forecast in 2043, indicating the structural transformation of the economy.
The estimated GDP (MER) for 2043 in the Combined Agenda 2063 scenario in 2043 will be US$117.2 billion, which is higher than the Current Path forecast of US$66.3 billion. This suggests that compared to the Current Path forecast, the size of the economy will almost double in the Combined Agenda 2063 scenario by 2043. The Combined Agenda 2063 scenario shows that a policy push across all the development sectors is necessary to achieve sustained growth and development in Benin.
The total amount of carbon emitted in Benin in 2019 was 2.2 million tons. In the Combined Agenda 2063 scenario, the total carbon emitted is projected to rise to 10.1 million tons by 2043. This is higher than the estimates of 7.2 million in the Current Path forecast for 2043 meaning that the Combined Agenda 2063 scenario leads to much higher carbon emissions than the Current Path. The materialisation of the Combined Agenda 2063 scenario would stimulate economic growth in Benin, but the cost in terms of environmental degradation is high. To mitigate the environmental impact of the Combined Agenda 2063 scenario, its implementation should be accompanied by concrete steps to accelerate the energy transition.
Page information
Contact at AFI team is Enoch Randy Aikins
This entry was last updated on 28 May 2026 using IFs v7.63.
Donors and sponsors


Reuse our work
- All visualizations, data, and text produced by African Futures are completely open access under the Creative Commons BY license. You have the permission to use, distribute, and reproduce these in any medium, provided the source and authors are credited.
- The data produced by third parties and made available by African Futures is subject to the license terms from the original third-party authors. We will always indicate the original source of the data in our documentation, so you should always check the license of any such third-party data before use and redistribution.
- All of our charts can be embedded in any site.
Cite this research
Enoch Randy Aikins (2026) Benin Development Futures. Published online at futures.issafrica.org. Retrieved from https://futures.issafrica.org/geographic/countries/benin/ [Online Resource] Updated 28 May 2026.