The Rebirth: Tunisia’s potential development pathways to 2040
Summary
- Good macroeconomic indicators before the start of the revolution in December 2010 masked issues like high unemployment, corruption and a socio-political system that benefits insiders. Jump to Introduction
- The current political fragmentation and economic crisis will test the country’s resolve to retain its belief in democracy. Jump to Introduction
- Tunisia's population is rapidly ageing and the country will fall below the replacement level of 2.1 live births by 2022. Jump to Population
- The economic situation in Tunisia has worsened since the revolution and large government expenditures and subsidy policies have complicated the problem. Jump to Economy
- Tunisia’s economic growth is stagnant because of poor governance, low levels of investment, a small formal sector and a large, low-productivity informal sector. Jump to Economy
- Import dependence on foodstuffs exposes the country to international food price shocks. With declining foreign reserves the country’s food security situation will remain vulnerable to 2040. Jump to Economy
- Progressive social and reproductive health laws in Tunisia have created a false sense of gender equity and self-determination. But inequality in income and labour opportunities persists between regions and across gender. Women and young graduates are the most affected. Jump to Poverty, inequality and subsidies
- Tunisia has a well-educated and large working-age population. Given employment opportunities, this labour force could generate a demographic dividend. Jump to Education
- By 2040, health costs will have surged owing to the burden of treating more non-communicable diseases. Jump to Health
Recommendations Jump to Conclusion
The government of Tunisia should:
- reform its economy to allow greater inclusivity and competition — the most difficult of these reforms will be trying to formalise its large informal sector, dismantling the impact of established interests and lowering the barriers of entry to participate in the formal economy.
- create an environment conducive to small businesses and entrepreneurship to boost business and investments in the private sector and promote job creation and entrepreneurship.
- continue with its efforts towards more targeted social safety net programmes such as a universal child allowance programme that would more effectively alleviate poverty and inequality and reduce subsidies that benefit the wealthy.
- reform labour laws to allow the many qualified women and youth to participate in the labour market.
- improve the quality of education and allow greater flexibility in the language of instruction.
- take advantage of the potential to boost agriculture and improve food security.
- adapt to the impacts of climate change through better management of its water resources and awareness creation among its population on the responsible use of water.
All charts for The Rebirth: Tunisia’s potential development pathways to 2040
- Chart 2: Population
- Chart 3: Demographic dividend, Tunisia and other groups
- Chart 4: Per capita income
- Chart 6: Growth accounting for Tunisia, OLMICs and UMICs
- Chart 8: Tunisia’s agricultural crop demand and supply in million metric tonnes
- Chart 10: Poverty rate at US$2.60, US$3.20 and US$5.50 per day in Tunisia
- Chart 11: Education flow (latest data from 2015 & 2018)
-
Chart 13: Summary of sectoral interventions
Chart 13: Summary of sectoral interventions
- Chart 14: GDP in the four scenarios
- Chart 15: Extreme poverty in the four scenarios (US$3.20)
- Chart 16: Inequality in the four scenarios
- Chart 17: Agricultural import dependence
- Chart 18: Per cent change in water demand in the three scenarios relative to the Current Path in 2040


Tunisia is unique in the North African region. The country achieved independence primarily through political campaigns and not armed struggle, boasts a relatively diversified economy and has progressive reproductive health policies different from most of its neighbours. However, the progress made since independence on various indices, such as years of education and women’s rights, and the generally positive macroeconomic indicators concealed a widespread sense of frustration.
The dearth of economic opportunities and unequal access to these opportunities manifested in high and rising youth unemployment and pervasive corruption. The interior regions of the country were the most affected and significant disparity has persisted between the coastal region and much of the hinterland.
The closed social, economic and political system that has stifled competition and continues to be dominated by a clique of insiders — with the presidency at its core — is perhaps the most important factor in understanding the events that culminated in the Freedom and Dignity Revolution that erupted at the end of December 2010.
Today, Tunisia is the only country in the region that has transitioned to a democracy as a result of these events, but it finds itself assailed by a range of domestic and regional challenges. Instead of a robust economy and improved livelihoods, the pervasive sense today is one of economic frustration and disaffection with the ability of democracy to deliver better governance.
The demographic structure of the country, coupled with high levels of education, played an important role in the lead-up to the revolution, and will continue to shape Tunisia’s future in important ways as the country’s population ages more rapidly than that of its peers.
Tunisia has consistently had a larger urban population than the averages in the region and is about 20 percentage points more urban than the average for other lower middle-income countries (OLMICs) globally and in Africa. Contrary to the experience in the rest of North Africa and in OLMICs, these high levels of urbanisation have not contributed to more equitable income growth as much as would be expected. However, they have assisted in the provision of more education and delivery of better basic infrastructure services.
Tunisia has a range of impressive human development indicators and significant human capital. Rebalancing the economy — moving it away from past practices based on privilege and cronyism towards equal access and opportunity — is critical for its development and transformation.
Creating an open-opportunity economy, achieving oversight over all aspects of government spending and economic policy, cutting back on wasteful expenditure, reforming the subsidy policies, improving the business climate and the quality of education, ensuring domestic security and consolidating democratic institutions are among the difficult but necessary challenges with which Tunisia needs to grapple.
This report presents an integrated analysis of Tunisia’s likely future development trajectory (or Current Path) to 2040, using the International Futures (IFs) forecasting platform. The analysis is then complemented by presenting the impact of three policy orientations that prioritise growth, sustainability and equality, and leapfrogging, respectively. The three pathways frame the choices for resource allocation and accompanying trade-offs that need to be made for the future. Underpinning all three scenarios is the need to reform governance. All monetary values in this report have been converted from 2011 US$, used by IFs, into 2019 euro values, unless indicated otherwise.
|
Chart 1: Comparison groups To create comparisons across countries and regions, we use the World Bank’s classification of economies into low-income, lower middle-income, upper middle-income and high-income groups for the 2020 fiscal year. [1See World Bank, New country classifications by income level: 2019–2020, 1 July 2019, Because the IFs system does not calculate gross national income (GNI), we use GDP per capita in purchasing power parity as a proxy.] The World Bank classifies Tunisia as one of 21 lower middle-income economies in Africa. The other lower middle-income countries in North Africa are Egypt, Mauritania and Morocco. However, Tunisia straddles various identities that complicate income-based comparisons. It is part of both the African region and the Middle East and North Africa (MENA) region, and shares many characteristics with both. For this reason we tend to use the global lower middle-income group of countries for comparative purposes in addition to regions such as sub-Saharan Africa, where appropriate. When Tunisia is compared with country groups, it is excluded from that group to maintain the accuracy of the comparison, hence the use of ‘other’ (e.g. ‘other lower middle-income’ or OLMICs). When using the upper middle-income group of countries (UMICs), we exclude China, as its large population and economy tends to skew comparisons with other income groups. |
After gaining independence from France in 1956, Tunisia was ruled by Prime Minister and later President Habib Bourguiba, who embarked on an expansive social and state-led development model. For example, the Code of personal status adopted after independence in 1956 granted women full legal status, outlawed polygamy and repudiated the right of a husband to unilaterally divorce his wife, enabling the development of a more gender-equitable society. [2R Khedher, Tracing the Development of the Tunisian 1956 Code of Personal Status, Journal of International Women's Studies, 18:4, 2017, 30–37.]
In 1965 the country became the first Muslim majority country to liberalise abortion laws. In 1958 Tunisia introduced free education and in 1990 the government passed new education legislation that, among other things, introduced free compulsory basic education from ages 6–16 and modernised the education system. As a result, thecountry has achieved high enrolment and literacy rates that resemble upper-middle rather than lower middle-income country characteristics. [3Oxford Business Group, Tunisia’s education system to be overhauled]
After standing unopposed for re-election on four occasions, Bourguiba was constitutionally designated ‘president for life’ in 1974, only to be overthrown in a bloodless coup in 1987 by then prime minister Zine El Abidine Ben Ali. [4The PSD was the only legal party until 1981 when the ban on opposition parties was lifted. Global Security, Tunisia: politics. By then, Habib Bourguiba was reported to be senile.]
Ben Ali promised democracy and other socio-economic reforms but failed to deliver on inclusive growth, in spite of the fact that average gross domestic product (GDP) per capita between 1960 and 2010 improved at a rate of 3% per year, representing a more than fourfold increase. These improvements were facilitated by an expansive state-led development paradigm that expanded cronyism.
After three rigged elections that he won with nearly 100% support, [5R Prince, Tunisia elections: the real thing this time, Institute for Policy Studies, 2 November 2011] Ben Ali was ousted by events now known as the Freedom and Dignity (or Jasmine) Revolution starting on 18 December 2010.
People took to the streets after a 26-year-old Tunisian street vendor, Mohamed Bouazizi, self-immolated in a desperate protest against a system that had denied him the most basic opportunity to earn a living. After a month-long period of intense riots and protests across the country, Ben Ali was forced to flee to Saudi Arabia and sentenced in absentia to 35 years in prison for embezzlement and later to life imprisonment for the killing of protesters. [6R Hamilton, Ben Ali: Tunisia’s ousted ex-president dies in exile aged 83, BBC, 19 September 2019.] He eventually died while in self-imposed exile.
Meanwhile, the popular uprising had spread to North Africa and the Middle East in what eventually became known as the Arab Spring. In its wake, Egypt’s Hosni Mubarak and Libya’s Muammar Gaddafi were both ousted from power, irrevocably altering the region’s future.
The robust macroeconomic indicators generally quoted by the African Development Bank (AfDB) [7African Development Bank (AfDB), The revolution in Tunisia: economic challenges and prospects, Economic Brief, 11 March 2011, ] and the International Monetary Fund (IMF) [8Murilo Portugal at the conclusion of his visit to Tunisia, April 6, 2007, Press Release 07/65; IMF, Statement by the IMF Mission on the 2007 Article IV consultation with Tunisia, 6 June 2007, Press Release 07/121. International Monetary Fund (IMF), Statement by IMF Deputy Managing Director] during the years leading up to the revolution obscured many frustrations around economic opportunity. Pervasive corruption and inequalities, high youth unemployment, slow economic liberalisation and low levels of private investment are some of the issues commonly highlighted.
Ben Ali and his inner circle dominated the economy from banking to tourism, manufacturing and oil. State instruments like tax auditing, licencing control and inspections were used to stifle competition and control investment, limiting opportunities to those provided by the state and in lowly paid jobs. [9E Tran, Tunisian success: an economic analysis, International Review, 28 September 2018] Many Tunisians were forced to earn a living in the informal sector, since only those with the right connections or enough resources to buy access could enter the formal sector.
In the aftermath of the revolution, Tunisia has sought to implement an ambitious social and economic reform agenda, but because of low growth its macroeconomic indicators have weakened and its ability to implement redistributive policies has lessened. Whereas the GDP expanded by an average of nearly 4.5% between 2000 and 2010, the rate was only 2% between 2010 and 2018.
Government spending and the size of the public sector have increased while reform aimed at reducing inefficient subsidies and the large public sector has gained little traction. Insecurity is spilling over its porous borders with Libya and Algeria, while the quality of its education system is deteriorating.
Continued frustration among Tunisians was brought to the fore in the October 2019 elections when Kais Saied, a conservative law professor and generally considered a political outsider, was elected as president. The fragmented political establishment and subsequent contestation to form a new government is testament to the political and developmental uncertainties ahead.
The goals and promise of the Freedom and Dignity Revolution remain unfulfilled for Tunisians. It is increasingly clear that without deep and structural economic reforms, regular elections will not translate into better opportunities.
Tunisia’s population was estimated at 11.8 million in 2019 and is expected to increase to 13.3 million by 2040. The country’s population is largely urban, well educated and significantly older than that of most other countries in the MENA region and even the average for OLMICs, as shown in Chart 2. Generally, this is the result of progressive social reforms, including family planning and the higher legal age of marriage. [10RH Curtiss, Tunisia: ‘A country that works’ – Tunisia’s family planning success underlies its economic progress, Washington Report on Middle East Affairs, November–December 1996]
The Code of personal status and Tunisia’s liberalisation of abortion laws also had a positive impact on the reproductive health of women. [11I Nazer, The Tunisian experience in legal abortion, International Journal of Gynecology & Obstetrics, 17:5, Mar–Apr 1980, 488–92.] The result has contributed to the steady decline in the total fertility rate (TFR), particularly since 1995.
Combined with education and urbanisation, Tunisia’s efforts to empower women reduced TFR from about seven children per woman at independence to approximatelytwo children per woman by 2005. Today, TFR in Tunisia is the third lowest in Africa (behind Libya and Mauritius) and is rapidly approaching the demographic profile for UMICs, characterised by low birth and death rates and a higher median age.
In fact, Tunisia’s TFR is projected to fall below the replacement level of 2.1 children in the early 2020s, which will cause a decline in the size of the working-age population (15–64 years) while the elderly population (65 years and over) will grow.
Also evident from Chart 2 is the rapid increase in the size of Tunisia’s working-age population (15–64 years) in the years preceding the Freedom and Dignity Revolution. In the absence of jobs and employment opportunities, this rapid growth proved destabilising, particularly since it was accompanied by increased levels of urbanisation and educational attainment.
However, the share of the adult population between 15 and 29 years — known as the ‘youth bulge’ — is now shrinking quite rapidly, which will likely moderate the risk of greater social unrest.
Tunisia reached its peak demographic dividend, or the ratio of working-age people to dependants, in 2011, when it had about 2.3 people of working age for every dependant (Chart 3). This ratio has since declined to the current rate of two people of working age for every dependant and is projected to remain relatively constant to 2040.
This favourable ratio with regard to the contribution that labour makes to economic growth is not, however, translating into income growth, as would be expected.
Tunisia is moving rapidly through its demographic transition without having achieved the associated benefits that typically accompany high levels of urbanisation, improved health outcomes and high levels of education. Income and overall economic growth have deteriorated and job opportunities in the formal sector are scarce.
The impediment, it would seem, is the country’s opaque economic system, which is dominated by strong vested interests and allows little competition. Despite the impressive human capital outcomes, it has under-delivered in terms of employment and economic inclusion.
The next decade will continue to offer Tunisia a demographic window to harness the economic potential of its large working-age population before the ratio slowly declines. Thereafter, the country might have to compensate for its smaller ratio of working-age population to dependants through higher savings, investment and technology — none of which has performed particularly well previously.
Tunisia’s rapidly ageing population will require greater spending on preventing, diagnosing and treating non-communicable diseases (NCDs) such as cancer, which are often costlier and require more sophisticated resources than communicable diseases. Managing the non-communicable and communicable disease burden at once is especially difficult and will require increased spending on health.
Growth
Published in 2015, Tunisia’s five-year development strategy emphasises the promotion of private sector development for economic growth and job creation, a vibrant civil society and strong international partnerships. [12World Bank, Tunisia Country Strategy 2016–2020, Washington DC: World Bank, April 2016.]
However, thus far little progress has been made. Instead, rising expenditure has increased public debt from 40% of GDP in 2010 to an estimated 73% of GDP in 2019, consuming more than 22% of the budget, although the budget deficit has dropped from 7.4% of GDP in 2016 to 3.9% in 2019. [13A McDowall, Explainer: Tunisia grapples with post revolution economic slide, Reuters, 3 December 2019, ]
With the current account under pressure, dwindling foreign reserves, a weakening currency, an unemployment rate of over 15% and inflation at approximately 6.5%, the Tunisian economy is struggling.
Tunisia’s significant subsidies on energy, fuel, food and transport and a large public service wage bill are exacerbating inequality and straining government’s coffers.
According to the IMF, ‘the richest 20 percent of Tunisians consume 28 percent of all subsidies, while the lowest 20 percent only receive 14 percent.’ [14IMF, Frequently asked questions on Tunisia, 18 July 2019] Civil service wages represent the biggest public expenditure item at about half the total budget, or 15% of Tunisia’s GDP. [15IMF, Frequently asked questions on Tunisia, 18 July 2019]
Since 2000, Tunisia’s growth rate has fallen below the average for OLMICs, a trend projected to continue even beyond 2040. However, the IMF reported economic growth of 2.5% in 2019, up from 1.8% in 2018. [16IMF, Tunisia]
On the Current Path, Tunisia will experience an average annual economic growth rate of 2.4% between 2019 and 2040 compared to an expected average annual population growth rate of 0.6%. Incomes will improve, but more slowly than in its OLMIC peers (see Chart 4), and the gap between Tunisia’s per capita income and the average for OLMICs is expected to narrow. Tunisia is also expected to fall further behind the average for UMICs. This dynamic is concerning, given its significant human capital endowment, which should enable significantly more rapid growth in incomes.
Economic structure
Since 2010, tourism, manufacturing and efforts at expansionary policies have driven Tunisia’s growth. [17AfDB, African Economic Outlook 2019, 2019] The service sector [18ICT is not part of services but is recorded separately within IFs.] is estimated to make the largest contribution to GDP (between 50% and 60%) and is set to remain dominant to 2040. [19The IFs forecast shows that services make the largest contribution to GDP at just over 50%. Other sources indicate that the sector is well over 60% of total value added. The difference is likely due to different methodologies and classifications. For example, some definitions of services include ICT while in IFs ICT is considered as a standalone sector. European Commission, The EU text proposal on trade in services and investment liberalisation, Factsheet, European Commission, January 2019] Tourism, a major contributor to services, has suffered in the last few years owing to terrorist attacks and other security issues, but has shown signs of recovery since 2018, recording a 42.5% jump in revenues in the first half of 2019. [20Nordea Trade, Tunisia profile: economic and political overview; Al Arabiya, Tunisia’s tourism revenues jump 42.5 percent in the first half of 2019, 8 July 2019, ]
Manufacturing is the second largest contributor to GDP at an estimated 29% in 2019, according to IFs, which is above the OLMICs average. The country also has a large information and communications technology (ICT) sector that contributes over 4% to GDP, significantly above OLMICs’ averages.
Agriculture plays a small but important role at roughly 12% of GDP, while the energy sector contributes a meagre 2% of GDP. On the Current Path, the GDP contributions of agriculture and energy will decline modestly although still increasing in absolute dollar terms.
However, industrial production has been falling, especially in the mechanical and textile sectors, which have suffered from a drop in external demand owing to competition from China and Tunisia’s high production costs. [21Organisation for Economic Co-operation and Development (OECD), Tunisia economic snapshot: economic forecast summary, November 2019] In addition, the production of phosphate, a major source of revenue and domestic stock of foreign exchange, halved between 2010 and 2016 in part due to labour and union strikes. Oil and gas production also nearly halved over this period. [22I Diwan, Tunisia’s upcoming challenge: Fixing the economy before it’s too late, Arab Reform Initiative, 23 September 2019, ]
The performance and profitability of Tunisia’s many large state-owned companies continue to decline. These large monopolies, which depend on ongoing injections of capital from the government to survive, distort markets and hinder competition and innovation. [23H Morsy, A Giamouridis and R Selim, Rethinking the role of the state in Tunisia, European Bank, 12 September 2017, ]
In addition, the trade deficit grew to an all-time high of €6.9 billion in 2019 with imports at over €22.6 billion (TND [24Currency code for the Tunisian dinar.] 63 billion) and exports at €15.6 billion (TND 43.9 billion). [25Statistiques Tunisie, Foreign trade: data]
Given the low levels of intra-regional trade in the region, it is no surprise that almost 80% of Tunisia’s exports go to the European Union (EU) rather than its neighbours. The lack of regional integration is a major constraint on development in Tunisia and North Africa.
Negotiations for a Deep and Comprehensive Free Trade Area (DCFTA) between the EU and Tunisia were launched on 13 October 2015 to include agriculture and services. [26The DCFTA will build on the EU–Tunisia Association Agreement, which entered into force in 1998 and created a free trade area between the EU and Tunisia. See European Commission, Tunisia, ] The negotiations are expected to create new trade and investment opportunities and ensure Tunisia is better integrated into the EU single market, but the domestic impact is contested. [27European Commission, Tunisia]
Tunisia has a significant informal and parallel economic sector that is substantially larger than the average for OLMICs when measured as a portion of the total economy or GDP. A World Bank study notes that 60% of Tunisia’s graduates end up in the informal sector or unemployed. [28World Bank, The Unfinished Revolution: Bringing Opportunity, Good Jobs and Greater Wealth to All Tunisians, May 2014, ] This high level of informality constrains growth, as informal sectors are generally less productive than formal sectors and make a smaller contribution to taxes.
Many Tunisians are forced to engage in the informal sector in spite of their high levels of education; a situation that contributed to the overwhelming frustration that underpinned the revolution. [29Expert consultation workshop in Tunis, 9–11 September 2019.]
Although some economists believe that the government relies on the informal sector to reduce unemployment, [30Expert consultation workshop in Tunis, 9–11 September 2019.] labour absorption in the informal sector is actually about a third below the average for OLMICs. In spite of its large informal sector (as a per cent of GDP), informal labour as a portion of total labour in Tunisia is more than 30 percentage points below the OLMICs average.
The theory that Tunisia’s large informal and parallel economy (estimated at 38% of GDP in 2013) is more than survivalist and involves considerable illicit activity is borne out by a World Bank estimate that about 25% of fuel consumed in Tunisia is smuggled from Algeria, where fuel is cheaper. [31L Ayadi et al, Estimating Informal Trade across Tunisia's Land Borders, World Bank Policy Research Working Paper WPS 6731, 2013, Informal economy presents Tunisia with thorny issue, The Arab Weekly, 30 June 2017] Much of the informal sector in Tunisia could therefore more appropriately be described as being part of the shadow economy, consisting of black market transactions such as smuggling and undeclared work. This is generally the case because formal sector opportunities are unavailable.
Tunisia’s high import taxes, outdated regulations and corrupt customs officials are some of the issues that deter business people from complying with official trade and currency exchange laws. They also contribute to the extremely low level of formal trade between countries in the Maghreb. In 2017, a former trade minister estimated that the share of small enterprises in the parallel economy amounted to an annual loss of €1.2 billion for the state just from value-added tax alone. [32S Quillen, Informal economy presents Tunisia with thorny issue, The Arab Weekly, 30 June 2017]
A study of the prevalence of the informal sector and the challenges to its formalisation shows that a third of informal workers and entrepreneurs listed bureaucracy, nepotism and corruption as major impediments to formalisation. [33Initiative Tunisienne Pour L’emploi Inclusif, Toward economic inclusion: transitioning Tunisia’s informal workers into the formal economy]
Nonetheless, IFs forecasts that the informal economy will decline by about four percentage points of GDP by 2040 from roughly 23% in 2019, but it remains around six percentage points larger than the average for OLMICs across the forecast horizon. From a structural point of view, more rapid formalisation of the informal sector would boost government revenues, accelerate economic growth and expand regional trade.
To examine the other reasons for slow growth beyond the large size of Tunisia’s shadow economy, we turn to analysis of the three standard contributors to economic growth, namely labour, capital and technology (or multifactor productivity [MFP] — see Chart 5).
|
Chart 5: Measuring productivity in IFs The IFs system assesses the stock (e.g. labour force size) and flow (e.g. investment) dynamics between capital, labour and technology as a means to assess and model countries’ long-term growth prospects. Technology is measured as multifactor productivity (MFP) and is further divided into four components — human capital, knowledge capital, social capital and physical capital. Additions to the initial MFP are computed within the IFs system using inputs from other sub-models, such as education. The growth forecast therefore represents the expected economic output from financial interaction between households, firms and government on the basis of both direct economic inputs such as labour and domestic/foreign investment, and deeper drivers such as the level of human development, quality of governance, and physical infrastructure that augment the quality and/or quantity of the direct inputs. In this way, IFs integrates longer-term issues, whereas most economic models focus on shorter-term equilibration and deal with the long run exogenously. |
Compared to OLMICs, labour and capital contribute the least to Tunisia’s growth, although, by 2035, the contribution from labour reaches the current mean of OLMICs. Of the three primary factors, MFP makes the greatest contribution to economic growth in Tunisia compared to OLMICs and UMICs, as shown in Chart 6 at five-year intervals.
The reason for labour’s low contribution is that Tunisia’s labour participation rate has steadily diverged from the OLMICs’ mean since 1985, and is currently about 12 percentage points lower, with rates for females significantly below that of males.
The poor contribution from capital is because investment in Tunisia’s economy is around six percentage points below that for OLMICs at around 20% of GDP. Since the 2011 revolution, foreign direct investment (FDI) has declined sharply. In 2017, for example, FDI inflows amounted to €894 million, a 45% decrease from 2012. The result is that Tunisia’s stock of FDI declined to €29 billion in 2017 compared to €29.8 billion in 2016. [34UNCTAD, World Investment Report, 2019 Country Fact sheet, Tunisia]
The Tunisian government has taken a number of measures to attract FDI to industries such as energy, tourism, construction material, telecommunications, finance and electronics. In 2018, for example, the government passed legislation to simplify the procedures required to work and do business as a foreigner. [35Giambrone Law, Tunisia’s radical strategy to encourage foreign investment, 13 September 2018, ]
Furthermore, in 2017 remittance inflows came to roughly €1.9 billion while outflows were approximately €29.5 million. In 2018 inflows were estimated to be over €2 billion. While remittances have contributed significantly to livelihoods (consumption) in Tunisia, only a small portion is allocated to investment. [36M Kouni, Remittances and Growth in Tunisia: A Dynamic Panel Analysis from a Sectoral Database, Journal of Emerging Trends in Economics and Management Sciences (JETEMS), 7:5, 2016, 342–51. The remittance figures are likely underestimated because of the presence of a significant black market and other informal ways through which people send and receive money.]
Although MFP performs well, according to the World Bank’s human capital index, Tunisia scores lower than expected in terms of its education and income levels. [37It is made up of five indicators: the probability of survival to age five, a child’s expected years of schooling, harmonised test scores as a measure of quality of learning, adult survival rate (fraction of 15-year-olds who will survive to 60), and the proportion of children who are not stunted. See World Bank, Human Capital Project] It is one of the few countries where a higher level of education decreases employability, particularly for women. [38World Bank, The World Bank in Tunisia: Overview, 9 October 2018]
In addition to the opportunities offered in the shadow economy and barriers to entry into the formal economy, one of the reasons for this is the lack of fringe benefits like maternity leave in the private sector. [39Expert workshop, Tunisia, November 2019.]
The World Bank estimated that unemployment was approximately 15% in 2018, and disproportionately affects the youth and women. The unemployment rate for graduates and women hovers at roughly 30% and 25%, respectively. [40IMF, Tunisia’s economic outlook in 4 charts, 22 October 2018]
Theoretically, the country has an ambitious legislative reform agenda and a progressive constitution, and indices on governance quality closely track the averages for ULMICs rather than OLMICs. But it is also evident that the post-2011 economic environment is characterised by a deteriorating business climate, a decline in investment and a shift away from capital investment. Instead of declining, cronyism seems to have survived the Freedom and Dignity Revolution. [41I Diwan, Tunisia’s upcoming challenge: Fixing the economy before it's too late, Arab Reform Initiative, 23 September 2019]
Chart 7: Governance measures
IFs draws the measures of government effectiveness and regulatory quality from the World Bank’s Worldwide Governance Indicators (WGI) project. Government effectiveness ‘captures perceptions of the quality of public services, the quality of the civil service and the degree of its independence from political pressures, the quality of policy formulation and implementation, and the credibility of the government's commitment to such policies.’ Regulatory quality reflects perceptions of the government’s ability to create and implement policies and regulations that promote the development of the private sector. Greater government effectiveness and regulatory quality link forward to improved ICT and enhanced social capital.
These dynamics highlight the extent to which economic growth and opportunity has not matched political progress in Tunisia. In the short- to medium-term, Tunisia will have to reduce the size of the parallel economy, contain unemployment, reduce public debt, improve public spending efficiency and address the social and regional disparities in the country.
These challenges require a reassessment of the country’s governance model and the introduction of substantive competition that will take time to have an impact. Lowering taxes and barriers to participation in the formal sector and reviewing tariff differentials with neighbours, among other things, could gradually lead to greater investment and formalisation.
Agriculture is an important element of the Tunisian economy. Tunisia is one of the world’s largest producers and exporters of olive oil and one of the few African countries that is fully self-sufficient in dairy products, vegetables and fruit. The sector contributes about 12% of GDP and employs roughly 16% of Tunisia’s labour force. [42International Trade Administration (ITA), Tunisia: Agricultural sector, February 2019]
Roughly two-thirds of the country is suitable for agriculture, and is mostly cultivated by small-scale farmers. [43Food and Agriculture Organization (FAO), Tunisia] Although foreign investors cannot own agricultural land, they can get long-term leases on public land from the Ministry of Agriculture. [44ITA, Tunisia: Agricultural sector, February 2019]
However, Tunisia’s average crop yields are low, at under 2 tonnes per hectare, compared to the average for OLMICs at 6.3 metric tonnes, indicating challenges in the agricultural sector and the potential for improvement. In fact, yields have hardly changed since independence, although agriculture consumes 80% of the country’s natural water resources. [45A Horchani, Water in Tunisia: A national perspective, in National Research Council, Agricultural water management: Proceedings of a workshop in Tunisia, Washington DC: The National Academies Press, 2007] By 2040, average crop yields are projected to increase to only 2.4 tonnes per hectare compared to the average for OLMICs at about 7.5 tonnes per hectare.
Since 2008, the government has renewed its efforts and formulated a number of national economic and social strategies to address agricultural production and food security as key pillars of the economy, but the results have been disappointing. [46FAO, Country fact sheet on food and agriculture policy trends: Tunisia, August 2017]
Tunisia also loses more than one-fifth of all of its crops to loss and waste — approximately two percentage points higher than countries in the MENA region and OLMICs. The Institut national de la statistique (INS) estimated that approximately 900 000 units of bread, the staple food in Tunisia and the greater Mediterranean region, are wasted per day, amounting to roughly TND 100 million (€50.8 million) annually.
The INS also estimates that food expenditure related to cereals represents about 13% of food expenses, or TND 149 (€53.20) per person per year. [47FAO, FAO hosts National Workshop for Reducing Loss and Waste in the Grain Value Chain in Tunisia, 6 December 2017]
Additionally, agricultural demand has outstripped supply since 1966. Tunisia’s L'Observatoire de la Souveraineté Alimentaire et de l'Environnement [48L'Observatoire de la Souveraineté Alimentaire et de l'Environnement (OSAE), Building food sovereignty in Tunisia, February 2019] (OSAE) reports that one out of two Tunisians consume imported food, and food dependence exceeded 55% of consumption in 2019. This heavy food dependence, according to the OSAE, could worsen if Tunisia enters into the DCFTA with the EU, since it would remove the remaining barriers protecting the country’s agriculture. [49L'Observatoire de la Souveraineté Alimentaire et de l'Environnement (OSAE), Building food sovereignty in Tunisia, February 2019]
A World Bank study suggests that Tunisia does not have an agricultural policy but rather a food security policy that in fact hinders the development of its agricultural sector. State intervention has pushed production away from Mediterranean products — in which Tunisia has a natural comparative advantage — towards less competitive continental products, keeping agricultural productivity at suboptimal levels and preventing the sector from achieving its full potential. [50World Bank, The Unfinished Revolution: Bringing Opportunity, Good Jobs and Greater Wealth to All Tunisians, May 2014]
As a result, reliance on food imports has increased over the years, particularly wheat. [51FAO, GIEWS – Global Information and Early Warning System, Tunisia, Country Brief, December 2018, ] According to the Observatory of Economic Complexity (OEC), Tunisia imported food-related goods to the tune of more than €2.1 billion in 2017. [52Observatory of Economic Complexity (OEC), Tunisia] The FAO forecasted that in 2018/19 cereal imports would average about 3.5 million tonnes.
According to IFs, import dependence on crops as a per cent of net demand is expected to decline from 30% in 2019 to about 22% in 2040, as shown in Chart 8. From a food security perspective, Tunisia is vulnerable to shocks such as fluctuating international prices, which could negatively impact food security, especially in light of declining foreign exchange reserves.
To reduce food dependence, Tunisia needs agrarian reform. The OSAE reports that 3% of agricultural producers in Tunisia have more than 100 hectares each, making up 30% of the total arable land. Most of their produce is exported. The remaining 97% largely produce for the local market. With better support and help from the government this 97% could reduce the country’s food dependence problem.
Climate change also threatens agriculture in Tunisia. USAID projects that Tunisia’s economy will suffer a reduced output of €2–2.7 billion between 2000 and 2030 owing to the combined effects of increasing global food prices and stagnant agricultural yields. [53OSAE, Building food sovereignty in Tunisia, February 2019]
From an agricultural perspective, climate risks to the sector include the decrease in crop yields, a shift in growing seasons, the degradation of soil quality, increased salinisation of aquifers, the decreased availability of water for irrigation and higher food prices.
Chart 9: Climate change
Tunisia, like the rest of the region, is highly exposed to the impacts of climate change, which extend beyond agriculture. With 84% of its population located along its 1 150 km coastline, sea-level rise, floods, coastal erosion, warmer fishing waters and droughts are among the more urgent threats that the country faces. Aside from economic disruption, this will displace exposed and vulnerable populations unless better disaster risk management systems are put in place. [54United Nations Development Programme (UNDP), Climate change focus: Tunisia coastline in need of climate cash boost, Africa Renewal, December 2019–March 2020]
The annual maximum temperature is likely to increase by 1.5–2.5 °C by 2030 and 1.9–3.8 °C by 2050, while the annual minimum temperature is likely to rise by 0.9–1.5 °C by 2030 and 1.2–2.3 °C by 2050. The number of hot days is also projected to increase by roughly 1.3 days per year between 2020 and 2039, while the duration of heatwaves will increase by four to nine days by 2030 and by six to 18 days by 2050. The sea level is expected to rise by 3–61 cm this century. [55USAID, Climate risk profile: Tunisia]
Higher sea levels threaten the low-lying islands off Tunisia’s coast. The effects of climate change will damage infrastructure such as roads, and water and sanitation facilities, worsening existing water security challenges [56USAID, Climate risk profile: Tunisia, ] and weakening coastal structures. The resulting loss in tourism revenue will also negatively impact the economy. [57USAID, Climate risk profile: Tunisia, ] Together with political instability and other drivers, this will in turn increase vulnerability to climate change.
Climate change will also directly impact health in Tunisia. Climate-related risks in the future will include higher mortality rates from extreme heat, increased malnutrition from crop failure, potential increased spread of diseases, and lack of access to clean water. [58USAID, Climate risk profile: Tunisia]
Tunisia has already achieved the headline Sustainable Development Goal (SDG) of eliminating extreme poverty as measured at US$1.90 per person per day. In fact, less than 1% of its population fall below this level of income. Data shows that poverty was generally on the decline in the years leading up to the revolution in December 2010, a trend enabled by economic growth and food subsidies. [59According to the World Bank, ‘subsidies can also introduce relative price distortions that typically provoke: overconsumption and underinvestment in subsidized sectors; the crowding out of more productive investments; delays in economic diversification; weaker current accounts and increasing budget deficits; and adverse effects on health and the environment’. See C Leiva et al, The Socioeconomic Impacts of Energy Reform in Tunisia: A Simulation Approach, World Bank, Policy Research Working Paper WPS 7312, 2015]
Despite having already achieved this important SDG goal, the country will continue to struggle with poverty and social inequality. Chart 10 shows progress on eliminating poverty against the national poverty level of US$2.60 per day [60The National Institute of Statistics designs and applies the poverty measurement methodology in Tunisia. Three poverty lines in dinars (TND) per person per year are estimated and used to calculate the official poverty rates: metropolitan areas (TND 1 878), communal (TND 1 703) and non-communal (TND 1 501). On average, the poverty line is TND 1 706, which roughly translates into US$2.60 per person per day. See World Bank, Poverty and Equity Brief: Tunisia, October 2019], and the World Bank’s US$3.20 extreme poverty level for lower middle-income countries and US$5.50 per day for UMICs. At all three levels, poverty is projected to increase until 2030 before gradually declining to 2040.
The global Multidimensional Poverty Index (MPI) [61Reading on MPI: see Oxford Poverty and Human Development Initiative (OPHI), About], which measures ten indicators across three dimensions, namely health, education and living standards, estimates that approximately 1.3% of Tunisians are multidimensionally poor. [62OPHI, Global MPI country briefing of 2019: Tunisia (Arab states), September 2019]
In addition, poverty is more pronounced in rural areas and among children. In fact, poverty among children [63UNICEF, Tunisie: analyse de la pauvreté infantile en Tunisie, 2014, Children represent 29% of the population and account for 40% of total poverty. And this is the same for the poverty gap, at 5.1% for children against 2.8% for adults.], estimated at over 21%, is nearly twice as high as poverty among adults, and the rural poverty rate of 30% is far above the urban poverty rate of 5%–12%. [64UNICEF, Tunisie: analyse de la pauvreté infantile en Tunisie, 2014, www.unicef.org.tn. The World Bank quotes the Tunisian National Statistics Institute estimate of the national poverty rate (US$2.60) in 2015 at 15.2%, having declined from 20.5% in 2010 and 23.1% in 2005. This differs from the estimate in IFs, which is 2.4%. The World Bank’s Poverty & Equity Brief on Tunisia published in April 2019 estimated the poverty rate using the US$3.20 threshold at 3.2% or 380 000 people. The IFs estimate is at 8.6% for 2018 (World Bank, Poverty and Equity Brief: Tunisia, October 2019). The latest data from the World Development Indicators in 2015 estimates that 3.2% of the population is living on less than US$3.20. (The Borgen Project, Causes of poverty in Tunisia, 23 September 2017; The Borgen Project, Why the poverty rate in Tunisia is still high, 29 September 2017; World Bank in Tunisia, Political-economy context).]
Although inequality as measured by the Gini coefficient is declining and lower than in comparable countries, there are significant disparities beyond income among Tunisians across gender lines and between regions. Inequalities in the labour market and general well-being continue to disproportionately affect women and young graduates. [65OECD, Economic policy reform: Going For Growth Note – Tunisia, ]
Tunisia, like many countries in the MENA region, has used government subsidies, including food subsidies, as a key pillar of the social contract to alleviate poverty and inequality. However, subsidies to the energy sector have come at a high cost and now threaten fiscal sustainability in Tunisia, where they have generally been found to be inefficient and wasteful. In fact, more than 16% of energy subsidies accrue to the wealthiest, compared to only 6.1% for the poorest decile of the population. [66A Hodges and A-R el Lahga, Coût, impact et financement de l’allocation pour enfants en Tunisie, Oxford Policy Management and Partnership for Economic Policy, Report for UNICEF and the Ministry of Social Affairs, Tunis, 6 May 2019.]
Attempts to reform the subsidy policy, particularly in the energy sector, have not been successful, although cuts to the subsidy bill are crucial to reducing the budget deficit.
Tunisia is aware of the need to move away from universal food subsidies towards targeted social assistance programmes that would optimise the budget allocated to this purpose. A 2013 study by the AfDB examined various scenarios to this effect. [67See M Ayedi et al, Food subsidies and direct social assistance: Towards better targeting of monetary poverty and deprivations in Tunisia, AfDB, 30 March 2013] Among the various proposals is a universal child allowance to mitigate the negative impact of general food and energy subsidy reform while effectively promoting poverty reduction and investment in human capital development. [68M Györi and F Veras Soares, Universal Social Protection in Tunisia: Comparing the Effectiveness and Cost‐Efficiency of Food and Energy Subsidies with a Proposed ]
Tunisia has achieved remarkable progress in education outcomes since independence by investing in pre-primary education and making education free and compulsory for learners aged six to 16. At present, Tunisia has the second most educated population in North Africa after Libya and ranks ninth on the continent, as measured by the average years of education attained by Tunisian adults (15 years and older).
The adult literacy rate is just above 80%, which makes it the 16th highest in Africa, and about 16 and six percentage points higher than the African and OLMICs average, respectively.
In 2019, the average Tunisian adult had about 8.2 years of education, projected to increase to 9.4 years by 2040. The average woman had about 7.7 years of education while the average man had 8.7. Yet, in spite of the high levels of female education women’s share of the labour force is, on average, around five percentage points below that for OLMICs (although significantly above the MENA average).
On the Current Path, gender parity in education will improve, with the average man and woman in 2040 having 9.8 and 9.4 years of education, respectively. Only about 23% of adults in Tunisia have no education or incomplete primary education — roughly on par with the average rate of 24% in OLMICs.
The legacy of colonialism and Tunisia’s proximity to the EU have complicated progress, however. Since the 1970s, education has experienced significant Arabisation, although most scientific subjects are still taught in French. The language policy designates classical Arabic as the language of instruction at the initial stages of learning. Thereafter learners are expected to learn and take exams in French.
In spite of its generally impressive educational outcomes, Tunisia is experiencing bottlenecks in upper secondary transition and completion rates, where the requirement for literacy in French in key subjects like science contributes to high drop-out rates.
Gross enrolment and graduation rates for tertiary education, although generally good, are impacted by the bottlenecks at the secondary level.
Given the budgetary constraints and increasing demand for secondary education, government finances are under considerable pressure, but Tunisia still spends significantly more on education than the OLMICs’ average.
Chart 12: Education in IFs and definitions [69Definitions from UNESCO, Glossary]
In IFs, education is conceptualised as a pipeline in which learners progress from primary to secondary and all the way to tertiary level (i.e. completion of one level enables transition to the subsequent level). The more learners a country can enrol in primary school, the larger the pool of learners who can graduate and transition to secondary and tertiary level.
Gross enrolment rate: The number of learners enrolled in a given level of education, regardless of age, expressed as a percentage of the official school-age population corresponding to the same level of education.
Completion rate: The number of persons in the relevant age group who have completed the last grade of the given level of education, as a percentage of the population at the theoretical graduation age for the given level of education.
Gross graduation rate: The number of graduates who have completed the last grade of a given level of education, regardless of age, as a percentage of the population at the theoretical graduation age for the given level of education.
Source: UNESCO glossary, http://uis.unesco.org/en/glossary
Despite successful efforts in improving public education and enrolment, the system is now faced with challenges in the quality of education it is offering.
There has been a drop in learner scores in international assessment measures like the Organisation for Economic Co-operation and Development’s (OECD) Programme for International Student Assessment. [70OECD, PISA 2015 results (Volume V)] In addition, the country’s low education outcomes are evident in the Multiple Indicator Cluster Surveys in 2018, which showed that 33% and 72% of children aged 7–14 do not have foundational reading or math skills, respectively, with large disparities depending on residence and socio-economic status.
The decline in baccalaureate pass rates (end of secondary) at 41% in 2018 from 52% in 2016 is another indication of the challenges faced by the education system.
Apart from straightforward challenges such as the quality of the curriculum and teachers, geographical location also creates differences in educational outcomes.
Educational facilities and institutions are mostly located in Greater Tunis and along the coast. The shortage of educational resources, including human resources, in areas like the governorate of Kairouan impedes learning. In addition, educational infrastructure, like school buildings, is fragile and poorly maintained, especially in rural areas. [71A Nagazi, Reading the shortcomings of the Tunisian educational system, World Bank, 30 October 2017, ]
Overall, the education curriculum is considered to be out of step with the requirements of the job market and the economic and social realities of Tunisia. In addition, recent years have also seen a greater demand for English in the workplace — a requirement that Tunisia will have to grapple with if it wishes to remain economically competitive.
Tunisia’s Strategic Plan for the Education Sector 2016–2020 seeks to address the quality of education in the country. The five-year plan aims to improve teacher training, upgrade the curriculum and education infrastructure, and promote private partnerships. Moreover, vocational training is limited in Tunisia but is necessary for the country to absorb learners who do not proceed to upper secondary school and to provide crucial skills for technical jobs. [72With the help of the World Bank, Tunisia undertook the Tertiary Education for Employability Project in 2016 to address the disconnect between skills and the needs of the labour market. Oxford Business Group, Tunisia’s education system to be overhauled, ]
Tunisians are generally well educated and enrolment rates are quite high by global standards. The considerable number of well-educated people without economic opportunities contributed to the Freedom and Dignity Revolution.
It is critical that the country reforms its education system, ensuring that it is relevant globally and appropriate for the Tunisian context, if it hopes to produce graduates who can create jobs, promote economic growth, reduce socio-economic inequalities and contribute to social stability.
Tunisia introduced free healthcare at independence and has since made significant investments in the sector. As a result, it is estimated to have gone through its epidemiological transition during the late 1960s and early 1970s. Since then, NCDs have been the primary cause of death, replacing communicable diseases.
However, healthcare services started to deteriorate in the late 1970s, at the height of authoritarian rule followed by Tunisia’s financial crisis of the mid-1980s. Despite the challenges in the sector, a large majority of Tunisians have access to medical services and there are increasing private investments in the health sector. [73WHO and Regional Health System Observatory, Health system profile: Tunisia, 2006]
This generally positive situation is reflected in the fact that life expectancy in Tunisia was about 76 years in 2019 and is projected to be close to 79 years by 2040 — nearly three years above the global average.
Infant mortality stands at 10 deaths per 1 000 live births and is lower than that of UMICs globally. Tunisia is projected to have an infant mortality rate of 8 deaths per 1 000 live births by 2030 and six by 2040. The country will not, however, meet the SDG goal of eliminating preventable deaths of newborns and children by 2030.
Tunisia’s maternal mortality ratio is estimated at 55 deaths per 100 000 live births — less than a third of the average for low middle-income countries globally. On the Current Path, the maternal mortality ratio is projected to decline to 15 deaths per 100 000 live births by 2040.
It has also made impressive strides in reducing malnutrition, and in 2019 the World Hunger Index ranked hunger as ‘low’ in the country. [74World Hunger Index, Global Hunger Index 2019: Tunisia, ] However, obesity has become a significant issue. The Tunisian Health Examination Survey of 2016 indicates that 64.5% of Tunisians are overweight, with 72.4% of this number women and 30% are considered to be obese. [75Portail national de la santé en Tunisie, Rapport de l’enquête national THES-2016]
Economic development and the intensification of urbanisation have been accompanied by changes in lifestyle and nutrition, fostering the rise of NCDs. Cardiovascular-related deaths and cancer are the leading causes of mortality in terms of NCDs. Although the importance and impact of NCDs were recognised in the early 1990s in Tunisia, the primary healthcare system is still ill equipped to manage and implement a comprehensive approach to NCDs. [76R Ben et al, Health System Challenges of NCDs in Tunisia, International Journal of Public Health, 60:S1, November 2014.] Awareness of prevention measures for NCDs is also low.
Among communicable diseases, ‘other’ communicable diseases (a catch-all category for communicable diseases that are globally less prevalent/prominent) and respiratory infections are the leading causes of death.
While tobacco smoking is on the rise among both men and women in Tunisia, it is declining across Europe and the United States. Due to the absence of legislation on the issue, the share of young people who smoke tobacco remains high, a trend that is expected to negatively influence mortality in the next decade if appropriate legislation measures are not implemented. [77R Fakhfakh, M Hsairi and N Achour, Epidemiology and Prevention of Tobacco Use in Tunisia: A Review, US National Library of Medicine, 40:6, 2005.]
Meanwhile, deaths from road traffic accidents are quite high. In fact, the World Health Organization reported in 2015 that Tunisia had the second-worst traffic death rate per capita in North Africa, behind war-torn Libya. [78World, ‘The accident rate is simply terrifying’: Tunisia sees deadly spikes on roads, 1 September 2016] In 2018, the National Observatory for Road Safety (ONSR) showed a nearly 16% decline in traffic accidents, although Tunisian roads are still considered deadly. [79Atlas Magazine, Decrease in the number of accidents in Tunisia in 2018, 15 January 2019]
Going forward, mortality from NCDs will continue to increase sharply. Mortality from communicable diseases will decline, but very slowly, while deaths from injuries will rise.
The mortality burden from injuries will surpass that of communicable diseases by 2025.
Because NCDs are inherently more expensive to diagnose and treat than communicable diseases, Tunisia will have to scale up its health framework and the associated amenities to respond to its evolving disease burden.
Tunisia has a relatively well-developed basic infrastructure system. Basic utilities and services like water, sanitation, electricity, telecommunications and transport were rolled out in the 1980s as part of the broader push on economic and human development.
Water and sanitation
Water scarcity has long been a challenge in North Africa, complicated by rapid urbanisation and climate change. Nonetheless, Tunisia has achieved significant success in expanding access to improved water sources and sanitation facilities. [80‘Improved drinking water sources are those which, by nature of their design and construction, have the potential to deliver safe water. The Joint Monitoring Program (JMP) subdivides the population using improved sources into three groups according to the level of service provided. In order to meet the criteria for a safely managed drinking water service, people must use an improved source meeting three criteria: it should be accessible on premises, water should be available when needed, and the water supplied should be free from contamination.’ WHO/UNICEF JMP, Drinking water, ] In 2018, an estimated 14.2% of the population lacked access to safe water [81WHO/UNICEF JMP, Drinking water, ] and only 3% lacked access to an improved sanitation facility — a major improvement from 2000, when 20% of Tunisians lacked access to an improved sanitation facility. [82UNICEF, MICs survey, 2019]
On the Current Path, all Tunisians will have access to safe water by 2028. The generally good health outcomes, particularly with regard to communicable diseases described in the previous section, can be attributed to adequate provision of services like water and sanitation in the country.
However, the growing population and increased demand for water for agriculture are straining the country’s water resources. Between 2012 and 2013, water use grew by 12%, mainly owing to the rise in the urban population of Tunis. [83World Bank, Water: Tunisia’s other development challenge, 4 September 2014] In the summer of 2013 the Greater Tunis area, with a population of 2.5 million people, experienced its first water cuts due to shortages.
To avoid future water shortages, Tunisia needs to reduce inefficiency in water use by modernising infrastructure, implementing modern farming practices and launching public awareness campaigns on sustainable water use.
Energy and electricity
The energy sector in Tunisia is heavily subsidised through a complex system. In 2005, energy subsidies accounted for 3% of GDP. By 2012, this had risen to 12% of GDP (TND 5 600 million). The IMF and the World Bank have pushed for Tunisia to limit energy subsidies, which they argue mostly benefit the affluent, and to curb the high levels of government expenditure. [84Energypedia, Tunisia energy situation] Nonetheless, Tunisia has achieved near universal electricity access.
Currently, about 97% of Tunisia’s electricity generation comes from fossil fuels, mostly from domestic and imported natural gas, almost half of which comes from Algeria. The energy law of 2015 encourages independent power producers (IPPs) to invest in renewable energy.
Since 2017, the government has awarded private companies 12 solar projects of 10 MW each and four wind projects of 30 MW each, all of which are still under construction. By 2018, Tunisia had an installed capacity of about 240 MW of wind power, 10 MW of solar, and 62 MW of hydroelectric, making up 5.7% of national energy production. [85Energypedia, Tunisia energy situation; IMF, Frequently asked questions on Tunisia, 18 July 2019]
The government aimed to source 11% of electricity from renewable sources by 2016 and 30% by 2030. [86International Energy Agency (IEA), Renewable Energy Law for Electricity Production (No. 74/2013)] According to IFs, Tunisia will only achieve that target by 2040, indicating the need for a much more aggressive push on renewables.
Information and communications technology
Tunisia has one of the most developed telecommunications infrastructures in North Africa, with some of the continent's highest market penetration rates. In 2019, ICT was estimated to contribute 4.5% of GDP. The mobile sector in particular has experienced exceptional growth since competition was introduced in 2002. By 2017, Tunisia had recorded 14.2 million mobile subscribers with over 124 subscriptions per 100 people.
A nationwide fibre-optic backbone and international access via submarine cables have supported the rapid development of the Internet sector. [87Tunisia Live, Tunisia and Ghana Lead Africa’s Telecom Growth, June 2019] In 2017, an estimated 7.4 million people were connected to mobile broadband.
However, the sector is characterised by low levels of competition owing to entry barriers in an industry where private sector participation is common. Because of limited competition and restrictions on inter-operator services, Tunisian consumers pay very high prices, which affect firms’ competitiveness and efficiency. [88World Bank, The Unfinished Revolution: Bringing Opportunity, Good Jobs and Greater Wealth to All Tunisians, May 2014, ]
As a result, ICT is largely confined to basic communications and not fully integrated into the economy. Tunisia is thus not reaping the full benefits of ICT, in spite of the fact that its value-added contribution to the economy is comparable to that in UMICs and two percentage points above the average for OLMICs.
In this section, we complement the Current Path forecast of Tunisia’s likely future (presented in the sections above) by contrasting three additional scenarios, namely Going for Growth, Leapfrogging and Sustainability & Equality. These will demonstrate the alternative development pathways that Tunisia can pursue towards a more prosperous future.
The three scenarios illustrate the options within the reach of decision makers in Tunisia and thus set out the range of possibilities and trade-offs that need to be considered. Each presents a unique strategy for advancing development.
However, they share five reforms that are foundational to progress: improved governance, consisting of better business regulation, more economic freedom and less corruption; improved quality of primary and secondary education; and a reduction in subsidies to wealthier households. Tunisia will not progress without addressing all five of these fundamentals.
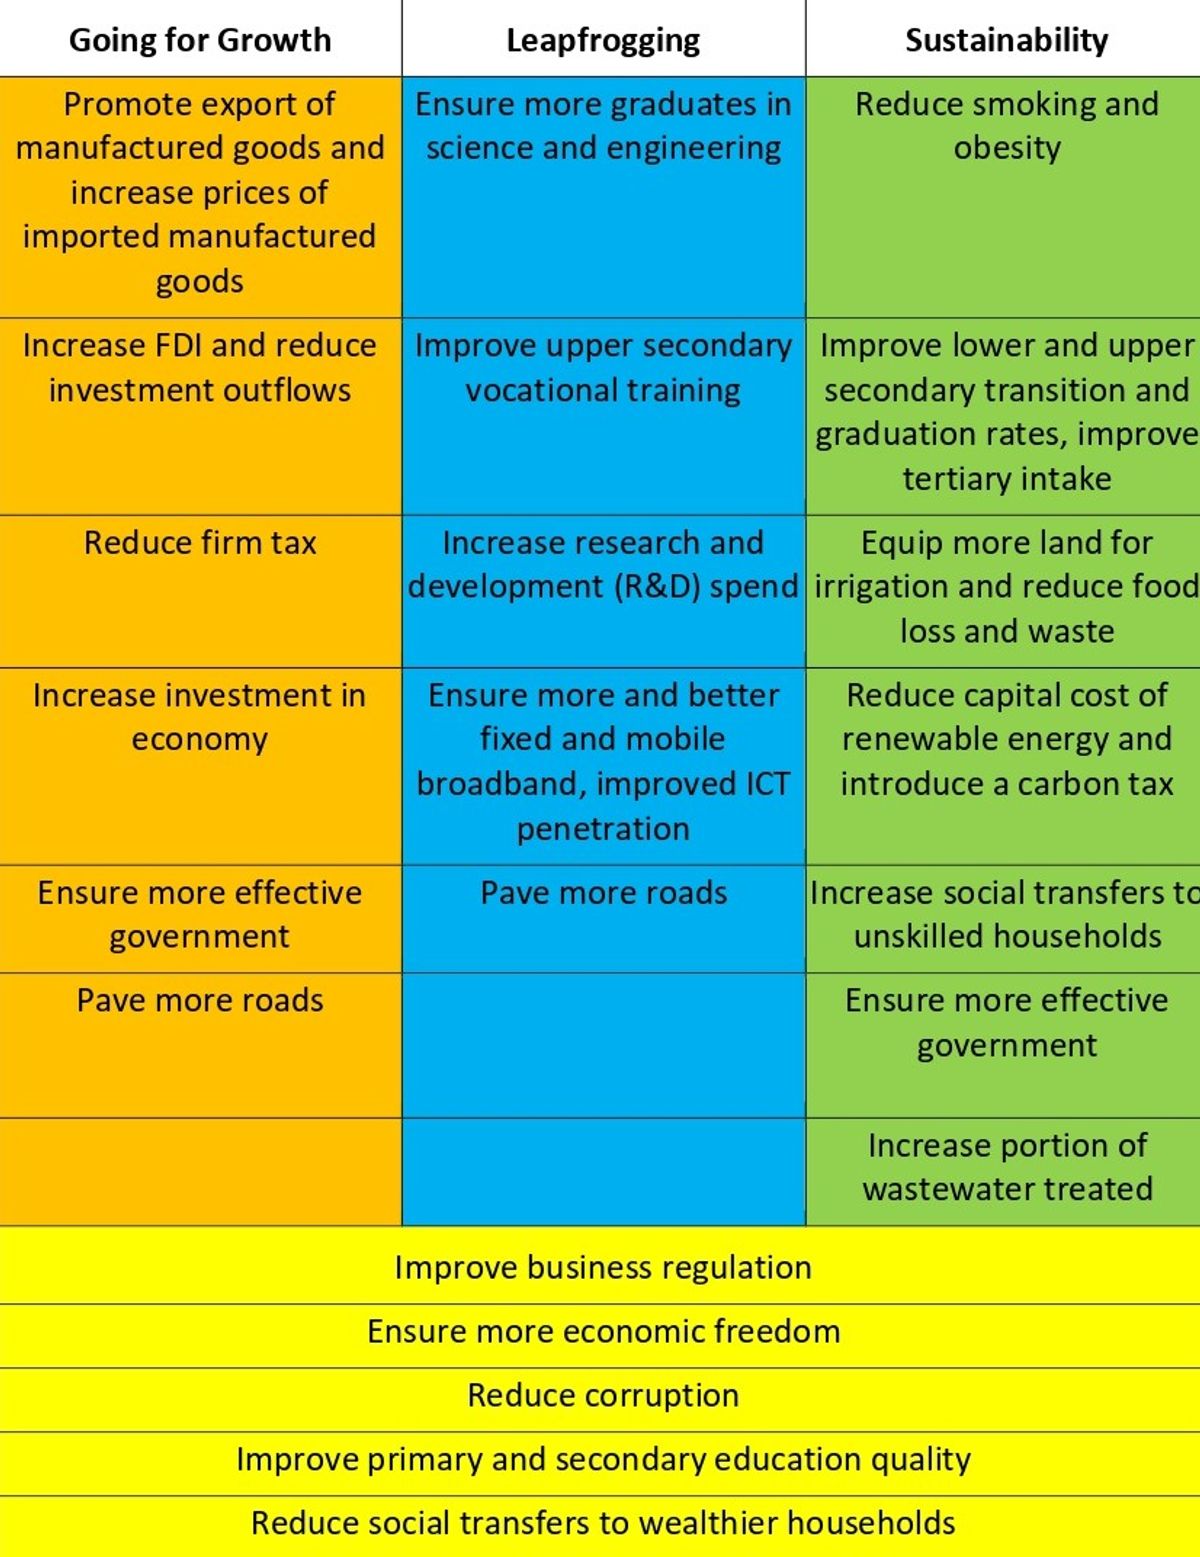
Chart 13 provides a schematic summary of the interventions. More detail of how these were modelled in IFs is given in Annex B. The yellow interventions at the bottom of Chart 13 are common to all three scenarios. The orange, blue and green cells represent the summary interventions included in Going for Growth, Leapfrogging and Sustainability & Equality.
Based on the Current Path analysis and feedback from our workshops in Tunis, the governance interventions represent a successful five-year push; education represents a ten-year sustained push, given the slow-moving nature of education outcomes; and subsidy reform is gradually implemented to 2040. All interventions begin in 2020 and are benchmarked to improvements achieved in other countries and regions.
Going for Growth
The Going for Growth scenario simulates a future in which Tunisia prioritises economic growth with limited regard to consequences like environmental degradation and implications for inequality and inclusivity.
In this scenario, Tunisia increases investments through savings and policies that attract FDI. It also improves infrastructure such as roads and enhances the quality of education to boost educational outcomes and provide learners with skills relevant to the labour market. More importantly, the government of Tunisia becomes more effective. Because energy subsidies have been a key pillar of the industrial policy and social contract in Tunisia and other MENA countries [89The Oxford Institute for Energy Studies, The Political Economy of Energy Subsidies in North Africa: The Untold Story, August 2017, ], greater economic freedom and related reforms can act to offset the rollback in the current subsidy policy.
In the Going for Growth scenario, economic growth is achieved through high levels of investments, supported by incentives to promote industrial production (manufacturing) and export-led trade. These will address distortions caused by monopolies and state-owned enterprises and promote competition and innovation.
The reforms simulate the state’s redefining its role in the economy, encouraging greater private sector competition in manufacturing, health, education and finance, and identifying protected assets such as land and basic services such as energy and water supply. These assets and basic activities have for a long time been implicitly the exclusive preserve of state-owned enterprises.
The governance interventions are particularly powerful in this scenario. By 2040, if implemented, the governance interventions alone increase the size of the economy by nearly 67% (€18 billion) relative to the Current Path forecast for that year.
Meanwhile, the total impact of the Going for Growth scenario — i.e. the four governance interventions in addition to the scenario’s other interventions (listed in the annex) — increases GDP by €27 billion in 2040 relative to the Current Path forecast for that year. This translates into a cumulative total increase of roughly €201 billion relative to the Current Path. This is an improvement of nearly 12% in cumulative GDP relative to the Current Path in 2040.
The Going for Growth scenario also increases per capita income by roughly €2 630 by 2040.
Leapfrogging
In the Leapfrogging scenario, Tunisia takes full advantage of its considerable human capital and ICT potential in the adoption of modern systems in finance, education, health and the telecommunications industry. This is a future that is primarily private sector driven with substantive liberalisation of the sector and the introduction of competition. [90UNCTAD, Leapfrogging: look before you leap, Policy Brief 7, December 2018]
Technology and innovation is already transforming Africa, and Tunisia is no exception. The proliferation of mobile phones in particular has been revolutionary. Through the use of mobile phones, citizens can buy electricity with the touch of a button, farmers are more connected with market information and doctors can remotely consult with patients. [91UNCTAD, Leapfrogging: look before you leap, Policy Brief 7, December 2018]
However, for a Leapfrogging scenario to be achieved in Tunisia, the country needs to invest in basic physical infrastructure such as roads and ICT infrastructure. It also needs to make substantial investments in research and development (R&D), with a particular focus on science and technology, and create a regulatory climate that encourages new business models to take off and survive.
This scenario makes a targeted push for improvements in ICT infrastructure, Internet access and infiltration, and the ability of the government and citizens to extend the benefits of the Internet beyond calling, messaging and accessing social media. This means integrating technology into business and government activities, thereby improving efficiency in the day-to-day operations of the Tunisian economy.
The Leapfrogging scenario also improves education, as it is challenging to achieve innovation and technological advancement without a well-trained population. This scenario envisions a quality education system that is up to date and relevant to the Tunisian context. The education system promotes science and technology and improves outcomes in science and engineering subjects. A substantial push for R&D is also included in this scenario to augment the drive towards innovation.
Furthermore, the Leapfrogging scenario envisions technical skills acquisition by increasing vocational training. Vocational training is particularly important to boost technology adoption so that no one is left behind by the rapidly and ever-evolving technological advances.
Additionally, the Leapfrogging scenario simulates a more conducive regulatory environment through policies that promote government effectiveness, which would improve entrepreneurship, regulation and registration of start-ups, and access to finance.
This scenario also takes into account the role and ability of renewables to bypass the need for traditional investment in energy infrastructure. It simulates an improved regulatory environment where, together with various innovations, a small capital investment is required to gain entry to this sector.
The Leapfrogging scenario would improve economic development by significant margins. The governance interventions alone account for over 98% of the boost in GDP, and the combined impact of the Leapfrogging scenario improves GDP by a cumulative total of about €79 billion relative to the Current Path by 2040. By mid-century the Leapfrogging scenario would contribute a cumulative total of over €259 billion.
Additionally, in the next 20 years, Tunisians could expect to have roughly US$1 000 more in per capita income relative to the Current Path.
The Leapfrogging scenario embodies the use of frontier technology, particularly in digital technology and innovation, which can facilitate Tunisia’s development process and obviate the traditional catch-up process that requires process technology, design and development. [92UNCTAD, Leapfrogging: look before you leap, Policy Brief 7, December 2018]
Tunisia therefore achieves progress by boosting its technological development, changing its economic structure, strengthening its education system and supporting public institutions through R&D while promoting partnerships with the private sector.
Sustainability & Equality
This scenario envisions a future in which Tunisia moves towards economic and human development without compromising the long-term ability of future generations to meet their needs. It simulates a development paradigm that promotes environmental stability, better access to basic infrastructure and offers more opportunities to all segments of the population.
The Sustainability & Equality scenario improves agricultural yields by increasing the land area equipped for irrigation while reducing agricultural and food loss. In this scenario, Tunisia increases the portion of treated waste water, promoting the reuse and better management of water in a country that is projected to face a water crisis well into the future.
Additionally, Tunisia promotes the adoption of renewables by adopting technologies that reduce the level of capital investment needed to gain entry in this sector. To enable greater viability and uptake of renewables, the country gradually reduces energy subsidies that largely accrue to middle- and upper-class Tunisians while reasonably increasing targeted social protection programmes for vulnerable populations.
Tunisia also reduces the rate of smoking and obesity to promote human development and a healthier population. Moreover, the country promotes quality education to develop a skilled workforce.
This scenario makes an aggressive push for better and effective governance, including reducing corruption levels and allowing greater economic freedom.
The Sustainability & Equality scenario reduces agricultural import dependence along the Current Path from about 22% of net demand to roughly 3% in 2040, protecting Tunisia against shocks in international food prices.
The governance interventions in this scenario account for about 97% (€10 billion) of the boost in GDP that the entire scenario generates.
In 2040, the size of the economy by roughly €13 billion relative to the Current Path and cumulatively it would have achieved a total increase of €23 billion against the Current Path from 2020 to 2040. The GDP per capita will have improved by €233 in 2040, showing that policies that protect the environment and encourage the sustainable use of resources can promote innovation and long-term development.
It is clear that each of these scenarios has a positive impact on the size of the economy compared to the Current Path in 2040. Improving the governance indicators are particularly powerful drivers of economic growth in each scenario, showing the significance of the governance deficit, in both economic and political terms, as discussed throughout the report, and the extent to which poor governance undermines development. Chart 14 illustrates the impact of the scenarios on GDP.
In 2040, relative to the Current Path forecast for that year, the Going for Growth scenario improves GDP by 30% (€27 billion) while the Leapfrogging and the Sustainability & Equality scenarios boost GDP by 11% (€10 billion) and 14% (€13 billion), respectively.
Moreover, all three scenarios significantly reduce extreme poverty (using the US$3.20 threshold). The Sustainability & Equality scenario achieves the most significant reduction in extreme poverty compared to the Current Path (6.6%) in 2040, with only about 2.8% of the population still living in extreme poverty. The Going for Growth scenario follows closely with nearly 3% and the Leapfrogging scenario records about 4% of the population living in extreme poverty.
Extreme poverty at US$3.20 is more than halved by 2040 from 2020 levels in the Going for Growth and Sustainability & Equality scenarios. The per cent of people surviving on US$2.60 per day (national poverty line) declines to under 1% in all three scenarios.
The Going for Growth scenario will increase poverty above the Current Path forecast until 2026, owing to the diversion of funds to investments made in the economy. However, from 2030 Going for Growth reduces the per cent of Tunisians living below the US$3.20 income threshold to below that in the Leapfrogging scenario and, by 2040, approaches the levels of poverty in the Sustainability & Equality scenario.
When looking at the cumulative number of people who escape extreme poverty over the forecast horizon, the Sustainability & Equality scenario does significantly better than any other. The Leapfrogging and Going for Growth scenarios have roughly similar cumulative impacts. All do significantly better than the Current Path forecast, which would see close to 7 million Tunisians living in extreme poverty (using US$3.20) in 2040.
Relative to the Current Path, in 2040 inequality as measured by the Gini index reduces by approximately 8.4% in the Sustainability & Equality scenario, while the Going for Growth and Leapfrogging scenarios achieve a 7.7% and 5.8% reduction, respectively. The IFs system does not, however, fully account for the impact of increased employment in the formal sector on reductions in inequality. It is therefore likely that these impacts are understated.
Although all three scenario approaches boost GDP and other human development indices relative to the Current Path, there are trade-offs associated with pursuing one or the other. From a food security perspective, only the Sustainability & Equality scenario achieves a significant reduction in food imports. The risk of shocks in international food prices is thus an issue Tunisia will need to address in the Going for Growth and Leapfrogging scenarios.
From an environmental perspective, the Going for Growth and Leapfrogging scenarios increase Tunisia’s carbon emissions by over 16% and 4% by 2040 relative to the Current Path forecast for that year. The Sustainability & Equality scenario reduces carbon emissions by almost 8% relative to the Current Path in 2040.
Given the global challenge of climate change, the country has to consider both the implicit and explicit trade-offs of its approach to achieving its development goals. Moreover, by 2040 the three scenarios will also affect Tunisia’s industrial, municipal and agricultural water demand. The country is already experiencing water stress and the implication of greater water consumption is a policy choice that decision makers have to grapple with.
The new administration tasked with redefining Tunisia’s future trajectory faces numerous challenges, not least crafting a coherent development vision among the fragmented parties represented in Parliament. Tackling the macroeconomic challenges faced in the country will require great understanding, sacrifices and tough decisions by all Tunisians.
Tunisia shares many characteristics of an upper middle-income economy and has the potential for much more rapid economic growth. However, inclusive and sustainable growth has remained elusive in spite of the political gains made with the Freedom and Dignity Revolution.
The country’s enormous potential has stagnated as a result of an opaque political and insider/outsider economic system that constrains opportunity and forces many into the informal and parallel economy. Tunisia lacks a clear development vision and orientation that can drive the allocation of scarce resources for the future. Meanwhile, challenges such as high unemployment rates — especially among university graduates — and regional inequalities persist.
Tunisia’s poor economic performance is deeply rooted in its highly protective regulatory environment, the dominance of state-owned enterprises, outdated regulations and corrupt customs, lack of competition, inefficient agricultural system, problematic labour rules, and its constrained social and political space that promotes exclusion and inequalities. Collectively these impede greater productivity and growth.
With almost one-third of goods traded in the domestic market imported illegally because of high import taxes and poorly designed regulations, only a comprehensive review of regulations and customs practices can draw Tunisians back into the formal economic sector. Regional instability feeds off Tunisia’s large shadow economy and the rampant smuggling in southern border towns such as Ben Guerdane. [93S Quillen, Informal economy presents Tunisia with thorny issue, The Arab Weekly, 30 July 2017, ]
Our analysis indicates that none of the three policy options is available to Tunisia without better business regulation that introduces substantive competition, much more economic freedom, less corruption, improvements in primary and secondary education and an end to the distortions from energy and other subsidies.
Only once these are addressed will Tunisia attract more FDI, reduce poverty and inequality, and unlock its human capital potential for more rapid inclusive growth. To achieve this, the government has to promote more substantive democratic and accountability measures in political governance, as spelled out in the country’s progressive constitution of 2014.
Tunisia finds itself at a crossroad that requires radical but necessary economic and socio-political reforms if it is to achieve inclusive development.
In summary:
Opening the economy: Tunisia needs to open up its economy with a series of policy reforms to level the playing field, improve competition and remove market barriers in the form of restrictive business regulations. This would significantly boost productivity and job creation to reduce unemployment, particularly in sectors such as services, where Tunisia has a comparative advantage. This transformation needs to happen alongside cuts in public spending, including a gradual rollback from the current subsidy system in favour of a more targeted social safety net programme for the most vulnerable and poor.
Formulating a labour policy and addressing inequality: The government of Tunisia needs to formulate a more coherent labour policy to address gender bias and other social and economic inequalities in the country. In addition, a progressive labour policy augmented by a much less restrictive business environment, greater economic competition and an end to the multitude of state-owned enterprises would reduce the size of the informal sector and boost income tax revenues.
Improving the quality of education: Although educational attainment levels are relatively high, the country needs to ensure that gains made in the education system are not eroded. Apart from maintaining high enrolment levels, the quality and relevance of education from primary throughout the education pipeline is key to sustaining a robust economy.
Managing natural resources and adapting to climate change: Tunisia is already under water stress and will likely suffer water-related challenges in the future given the projected impacts of climate change. Proper and efficient use of water at the industry and household level is critical to mitigate these impacts.
Improving food security: Tunisia needs a food security policy that does not undermine development of the agricultural sector. Moreover, it has the potential to improve agricultural yields and overall productivity through greater efficiency in the agricultural system. This can be achieved by strengthening institutional aspects such as investing in both soft and hard infrastructure (like land ownership, access to finance and transport systems).
Tunisia has the structural foundations needed to facilitate sustained and robust growth. It now needs to undertake comprehensive and deliberate reform to unlock economic growth and ensure the equitable distribution of opportunity for all Tunisians.
In addition to extensive desktop research, the project team undertook two expert consultation workshops in Tunis during 2019. We would like to extend our appreciation to the staff of UNICEF in Tunis, particularly Lila Pieters (Resident Coordinator), Silvia Chiarucci (Deputy Country Representative) and Samir Bouzekri (Social Policy Specialist), as well as numerous partners and experts who participated at these workshops, for their valuable contribution to our analysis. The final report also benefited from extensive comments from Prof Jelel Ezzine, Former Director General of International Cooperation at the Ministry of Higher Education and Scientific Research, and Taylor Hanna at the Frederick S Pardee Center in Denver, CO.
For this report, we used a Project Data file to replace certain data in IFs with either more recent data or data from an alternative source, for example, the National Statistics Bureau. Some of the following series may not have been updated in IFs from international sources. We were able to get recent data for certain series from the Multiple Indicator Cluster Survey (MICS) of 2018 conducted by the United Nations Children’s Fund (UNICEF) and Institut national de la statistique (INS) in Tunisia.
Chart A1: Project data file
|
Series |
Alternative source/reasoning |
|
EdPriCompletionFemale%/Male%/Total |
Survey from UNICEF’s MICS survey data |
|
EdSecAdultGrads15Female%/Male%/Total% |
Survey from UNICEF’s MICS survey data |
|
EdSecLowerGradRateAllFem/Mal/Tot |
Survey from UNICEF’s MICS survey data |
|
IncBelow1D90c%WDI |
WDI latest data update |
|
InfMortRateIHME |
Survey from UNICEF’s MICS survey data |
|
LandCrop |
Tunisia Institute of Statistics (INS) |
|
LandIRArea |
Tunisia Institute of Statistics (INS) |
|
PolityDemoc |
Center for Systemic Peace data |
|
PovertyGap$1c90perday |
WDI latest data update |
|
WSSJMPSanitationTotal%Improved |
Survey from UNICEF’s MICS survey data |
|
WSSJMPWaterTotal%Improved |
Survey from UNICEF’s MICS survey data |
Chart A2: Current Path adjustments
|
Series |
Adjustment in IFs |
Reasoning/justification |
|
gdpadjsw |
Set to 1. |
Turns on the exogenous specification for GDP. |
|
gdprext, GDP growth rate, exogenous target (%) |
Set to 1.5 in 2019, before returning to -100 (which returns it to the IFs forecast) in 2020. |
IFs imposes the IMF’s five-year GDP growth projections exogenously. The forecast was too aggressive. We overrode 2019 data with IMF’s latest projection, which is more reasonable. |
Annex B: Scenarios
All interventions start in 2020 unless otherwise specified.
Chart B1: Common interventions to all three scenarios
|
Parameter |
Definition |
Adjustment in IFs |
Magnitude of change (CP and intervention) |
Reasoning/Benchmark |
|
Econfreem (economic freedom multiplier) |
Improve economic freedom |
Interpolate to 1.2 by 2025 and hold to 2040 |
2025-from 6.3 to 7.6 2030-from 6.4 to 7.7 2040-from 6.4 to 7.8 |
Improves freedom on the Fraser Index by roughly 21% between 2020 and 2025. Zambia improved economic freedom by 53.5% between 1990 and 1995 and has sustained that growth for over 15 years. |
|
Govcorruptm (government corruption multiplier) |
Reduce government corruption |
Interpolate to 1.3 by 2025 and hold to 2040 |
2025-from 3.8 to 5.2 2030-from 3.9 to 5.3 2040-from 4.1 to 5.7 |
Reduces corruption by nearly 37% between 2020 and 2025. Nigeria improved its corruption perception index by 58.3% between 2000 and 2005. It has sustained improvements for over 6 years. |
|
Govregbusindm (business regulation index multiplier) |
Improve business regulation index |
Interpolate to 0.85 by 2025 and hold to 2040 |
2025-from 2.2 to 2.3 2030-from 2.3 to 2.4 2040-from 2.4 to 2.5 |
Improves regulatory quality by almost 5% in 2025. Côte d’Ivoire reduced its regulatory index by 51.4% between 1997 and 2002. |
|
Govhhtrnwelm-skilled (government to skilled household welfare transfers) |
Reduce the rate of transfers to skilled (middle and upper class) |
Interpolate to 0.2 by 2040 |
2025-from 10.7% to 9.9% of GDP 2030-from 10.6% to 9.1% of GDP 2040-from 10.7% to 7.4% of GDP |
Among lower middle-income countries in Africa, Tunisia currently has the second highest portion of GDP allocated to household transfers. The country also has very high government subsidies in fuel that mostly accrue to the middle- and upper-class segment of the population. Reduces welfare transfers by 3.7 percentage points between 2020 and 2040. Egypt is cutting fuel subsidies by 40.5% and electricity subsidies by 75% in the 2019/20 financial year. |
|
Edqualpriallm (primary education quality, multiplier) |
Improve the quality of primary education |
Interpolate to 1.1 by 2030 and hold to 2040 |
2025-from 45.5 to 47.8 2030-from 45.9 to 50.7 2040-from 47.5 to 52.3 |
The quality of education is deteriorating in the country because of inadequate infrastructure, human resource and educational supplies. Improves the quality of primary education by 14% in 2030. |
|
Edqualsecallm (secondary education quality, multiplier) |
Improve the quality of secondary education |
Interpolate to 1.1 by 2030 and hold to 2040 |
2030-from 45.9 to 50.7 2040-from 47.5 to 52. |
The quality of education is deteriorating in the country because of a curriculum that is out of step with the labour market, language of instruction and inadequate and unevenly distributed infrastructure and educational supplies. Improves the quality of secondary education by 13% in 2030. |
Going for Growth
|
Parameter |
Definition |
Adjustment in IFs |
Magnitude of change (CP and intervention) |
Reasoning/Benchmark |
|
Goveffectm (governance effectiveness multiplier) |
Improve government effectiveness |
Interpolate to 1.3 by 2025 and hold to 2040 |
2025-from 2.5 to 3.3 2030-from 2.6 to 3.4 2040-from 2.7 to 3.7 |
Tunisia has a very bureaucratic system of government and service delivery. This intervention improves government effectiveness by about 32% between 2020 and 2025. Côte d’Ivoire improved government effectiveness by 49.8% between 2010 and 2015. |
|
Infraroadpavedpcntm (roads % paved, multiplier) |
Increase the per cent of paved roads |
Interpolate to 1.3 by 2040 |
2025-from 78.5% to 84.6% 2030-from 78.7% to 90.8% 2040-from 79.1% to 100% |
Increases the per cent of paved roads to 100% by 2040, a 22 percentage point improvement from 2020 to bring it in line with global average. |
|
Firmtaxrm (firm tax rate multiplier) |
Reduce firm tax |
Interpolate to 0.85 by 2025 and hold to 2040 |
2025-from 2.8b to 2.7b 2030-from 3.2b to 3.1b 2040-from 4.4b to 4.35b |
Tunisia has a complicated tax system associated with ease of doing business in the country, and reducing taxes could attract FDI. This intervention initially reduces the amount of tax but it would attract investments and job creation. Between 2020 and 2025, this intervention increases firm tax by roughly US$300 million. Egypt collects more firm tax among lower middle-income countries than Tunisia. |
|
Invm (investment in the economy multiplier) |
Improve investment |
Interpolate to 1.1 by 2025 and increase to 1.2 by 2040 |
2025-from 18.1% to 21.2% of GDP 2030-from 17.7% to 21.5% of GDP 2040-from 18.7% to 22.8% of GDP |
Improves investments (1.6 percentage points of GDP) and gross capital formation by 8% in 2025, and improves government savings by more than 4 percentage points of GDP in 2040. The ratio of investments relative to GDP in Tunisia is lower than in countries like Djibouti, Comoros, Lesotho, Mauritania, Cape Verde, Cameroon, Senegal, Zambia and Morocco. |
|
Xfdifinm (foreign direct investment, flow of investment from abroad, multiplier) |
Improve FDI inflow |
Interpolate to 1.3 by 2030 and hold to 2040 |
2025-from 3.3 to 4.6 2030-from 3.4 to 4 2040-from 3.6 to 3.9 |
FDI inflows into Tunisia have declined since the revolution. Improves FDI inflows as a per cent of GDP by over 3% in 2030. Zambia improved FDI inflows by 4.25 percentage points between 2005 and 2010. |
|
Xfdioutm (foreign direct investment, flow of investment abroad, multiplier) |
Reduce FDI outflow |
Interpolate to 1.1 by 2025 and to 1.2 and hold to 2040 |
2025 2030 2040 |
Augments improvement in FDI inflows to allow existing businesses to stay and encourage domestic investment. |
|
Xshift (export shift as a result of promotion of exports (manufactures)) |
Improves exports |
Interpolate to 0.02 by 2030 and hold to 2040 |
2025-from 29.7b to 32.2b 2030-from 33.8b to 37.1b 2040-from 42.6b to 50.2b |
Increases export earnings by about 48% from 2020 to 2030. |
|
Edqualsecallm (secondary education quality, multiplier) |
Improve quality of secondary education |
Interpolate to 1.1 by 2030 and hold to 2040 |
2025-from 45.5 to 47.8 2030-from 45.9 to 50.7 2040-from 47.5 to 52.3 |
Improves the quality of primary education by 13% between 2020 and 2030. |
|
Protecm(protectionism in trade, multiplier on import prices (manufactures)) |
Reduces imports |
Interpolate to 1.2 by 2030 and hold to 2040 |
2025-from 29.7b to 30.6b 2030-from 32.9b to 34b 2040-from 43.8b to 42.1b |
Encourages manufacturing by restricting imports. Reduces spending on imports by over US$1.6 billion in 2040 (between CP and scenario). |
Leapfrogging
|
Parameter |
Definition |
Adjustment in IFs |
Magnitude of change (CP and intervention) |
Reasoning/Benchmark |
|
Randdexpm (RD (total) expenditure multiplier) |
Increase spending on research and development (R&D) |
Interpolate to 1.2 by 2030 and hold to 2040 |
2025 2030-from US$0.008 billion to US$0.009 billion 2040 |
Research and development is a key and strategic pillar to promoting science and innovation. Increases R&D spend by over 11% between 2020 and 2030. |
|
Ictbroadm (ICT broadband multiplier) |
Improve broadband rate |
Interpolate to 1.2 by 2025 and hold to 2040 |
2025-from 13.2 to 16.1 2030-from 18.2 to 22.2 2040-from 31 to 37.7 |
Tunisia already has a relatively good ICT infrastructure. Creating greater access to the Internet will help to scale use of technology. Increases subscriptions per 100 people by nearly 138% from 2020 to 2025. Cape Verde increased fixed broadband per 100 subscriptions by 390% between 2007 and 2012. |
|
Ictbroadmobilm (ICT mobile broadband multiplier) |
Improve mobile broadband rate |
Interpolate to 1.2 by 2025 and hold to 2040 |
2025-from 128.7 to 129.5 2030-from 147.4 to 148.2 2040-from 153.6 to 153.7
|
Allows greater Internet access on mobile phones. Increases subscriptions per 100 people by roughly 48% between 2020 and 2025. Ghana increased fixed broadband per 100 subscriptions by over 850% between 2010 and 2015. Tunisia has achieved even greater progress in that time horizon. |
|
Ictintnetbwpum (Multiplier on Internet bandwidth per user) |
Improve Internet bandwidth rate per user |
Interpolate to 1.3 by 2025 and hold to 2040 |
No specific series for this intervention |
|
|
Ictindexm (Multiplier on ICT index) |
Improve ICT pervasiveness |
Interpolate to 1.2 by 2025 and hold to 2040 |
See above |
Scales up the use of the Internet and technology to other productive sectors of the Tunisian economy. |
|
Ictcybbenefitm (ICT cyber benefit multiplier) |
Improve the benefit of ICT |
Interpolate to 1.3 by 2025 and hold to 2040 |
See above |
See above |
|
Edsecupprvocadd (upper secondary vocational share additive factor) |
Improve upper secondary vocational training |
Interpolate to 3 by 2030 and hold to 2040 |
2025-from 2030-from 2040-from |
To create important technical skills that are in short supply in the country. |
|
Edterscieshradd (Tertiary science-engineering share of graduates, additive factor) |
Improve the rate of graduates in science and engineering subjects |
Interpolate to 3 by 2025 and hold to 2040 |
2025-from 26.2 to 29.4 2030-from 25.9 to 29.2 2040-from 25.7 to 28.8 |
Improves the share of learners proceeding on to study science and technical studies like engineering by 8.5% from 2020 to 2025. |
Sustainability & Equality
|
Parameter |
Definition |
Adjustment in IFs |
Magnitude of change (CP and intervention) |
Reasoning/Benchmark |
|
Goveffectm (governance effectiveness multiplier) |
Improve government effectiveness |
Interpolate to 1.2 by 2025 and hold to 2040 |
2025-from 2.5 to 3.1 2030-from 2.6 to 3.2 2040-from 2.7 to 3.4 |
Increases government effectiveness by 24% in 2025.
|
|
Govhhtrnwelm-unskilled (government to unskilled household welfare transfers) |
Increase transfers to unskilled (poor and vulnerable) |
Interpolate to 1.1 by 2030 and hold to 2040 |
2025-from 10.7% to 11.1% of GDP 2030-from 10.6% to 11.3% of GDP 2040-from 10.7% to 11.2% of GDP |
Reduces welfare transfers by 3.7 percentage points between 2020 and 2040. |
|
Qem-Q (Capital costs-to- output ratio) in energy multiplier (OthRenew) |
Reduce capital cost of renewable energy |
Interpolate to 0.85 by 2030 and hold to 2040 |
2025-from 13.2 to 17.1 2030-from 25.2 to 41.6 2040-from 59.8 to 77.1 |
Because of high subsidies in energy and electricity prices, the cost of investing in renewables is still high in Tunisia. Increases renewable energy production as a per cent of total by over 36 percentage points between 2020 and 2030. |
|
Carbtax (Carbon tax-dollars/ton) |
Increase carbon tax |
Interpolate to 400 by 2030 and hold to 2040 |
2025-from 0.0092 to 0.0096 2030-from 0.0095 to 0.0097 2040-from 0.0103 to 0.0104 |
Reduces carbon emissions by roughly 11.5% between 2020 and 2030. |
|
Landirareaequipm (multiplier on land area equipped for irrigation) |
Increase land area equipped for irrigation |
Interpolate to 1.2 by 2025 and hold to 2040 |
2025-from 436.5 to 461.8 2030-from 436.4 to 473.4 2040-from 439.7 to 483.8 |
Increases land area in hectares under irrigation by 4.8% between 2020 and 2025. |
|
Aglosstransm (loss rate of agriculture as moves from producer to consumer multiplier) |
Reduce agricultural losses from producer to consumer |
Interpolate to 0.8 by 2025 and hold to 2040 |
2025-from 21.2% to 20.9% 2030-from 20.9% to 20.6% 2040-from 19.3% to 18.9% |
Tunisia has the most food wastage compared to OLMICs and other MENA countries. Reduces waste from production to consumption.
|
|
Aglossconsm (waste rate of agricultural consumption multiplier) |
Reduce food waste at consumption level |
Interpolate to 0.8 by 2025 and hold to 2040 |
See above |
Tunisia wastes over US$100 million worth of food, the majority of which is bread (also Tunisia’s staple). |
|
Edsecupprtranm (upper secondary transition rate multiplier) |
Improve transition rate to upper secondary |
Interpolate to 1.2 by 2030 and hold to 2040 |
2025-from 99.8% to 100% 2030-from 99.9% to 100%
|
Increases upper secondary transition to 100% by 2030. |
|
Edseclowrgram (lower secondary graduation rate multiplier) |
Improve lower secondary graduation rate |
Interpolate to 1.2 by 2030 and hold to 2040 |
2025-from 74.8% to 84.3% 2030-from 75.8% to 93.8% 2040-from 98.8% to 81% |
Increases lower secondary graduation by over 19 percentage points (26%) between 2020 and 2030. |
|
Edsecupprgram (upper secondary graduation rate multiplier) |
Improve upper secondary graduation rate |
Interpolate to 1.2 by 2030 and hold to 2040 |
2025-from 54.4% to 61.8% 2030-from 57.5% to 71.6% 2040-from 66.8% to 81.7% |
Increases upper secondary graduation by over 20 percentage points (40%) between 2020 and 2030. |
|
Edsterintm (tertiary intake rate multiplier) |
Improve tertiary intake rate |
Interpolate to 1.3 by 2040 |
2025-from 35.2% to 35.3% 2030-from 36.9% to 40.6% 2040-from 41.5% to 46.5% |
Improves tertiary enrolment by 5.3 percentage points (15%) between 2020 and 2030. |
|
Wastewatertreatedm (Treated wastewater multiplier-Cubic Km) |
Increase the rate of wastewater treated |
Interpolate to 1.3 by 2040 |
2030-from 0.25 to 0.31 2040-from 0.28 to 0.39 |
Increases wastewater treated by roughly 39% in 2040.
|
|
Hlsmokingm (Smoking rate multiplier) |
Reduce smoking rate |
Interpolate to 0.8 by 2025 and hold to 2040 |
Many effects of smoking |
Reduces smoking. |
|
Hlobesitym (Obesity rate multiplier) |
Reduce obesity rate |
Interpolate to 0.8 by 2025 and hold to 2040 |
Reduces prevalence of non-communicable diseases |
Reduces the prevalence of obesity. |
Endnotes
See World Bank, New country classifications by income level: 2019–2020, 1 July 2019, Because the IFs system does not calculate gross national income (GNI), we use GDP per capita in purchasing power parity as a proxy.
R Khedher, Tracing the Development of the Tunisian 1956 Code of Personal Status, Journal of International Women's Studies, 18:4, 2017, 30–37.
Oxford Business Group, Tunisia’s education system to be overhauled
The PSD was the only legal party until 1981 when the ban on opposition parties was lifted. Global Security, Tunisia: politics. By then, Habib Bourguiba was reported to be senile.
R Prince, Tunisia elections: the real thing this time, Institute for Policy Studies, 2 November 2011
R Hamilton, Ben Ali: Tunisia’s ousted ex-president dies in exile aged 83, BBC, 19 September 2019.
African Development Bank (AfDB), The revolution in Tunisia: economic challenges and prospects, Economic Brief, 11 March 2011,
Murilo Portugal at the conclusion of his visit to Tunisia, April 6, 2007, Press Release 07/65; IMF, Statement by the IMF Mission on the 2007 Article IV consultation with Tunisia, 6 June 2007, Press Release 07/121. International Monetary Fund (IMF), Statement by IMF Deputy Managing Director
E Tran, Tunisian success: an economic analysis, International Review, 28 September 2018
RH Curtiss, Tunisia: ‘A country that works’ – Tunisia’s family planning success underlies its economic progress, Washington Report on Middle East Affairs, November–December 1996
I Nazer, The Tunisian experience in legal abortion, International Journal of Gynecology & Obstetrics, 17:5, Mar–Apr 1980, 488–92.
World Bank, Tunisia Country Strategy 2016–2020, Washington DC: World Bank, April 2016.
A McDowall, Explainer: Tunisia grapples with post revolution economic slide, Reuters, 3 December 2019,
IMF, Frequently asked questions on Tunisia, 18 July 2019
IMF, Frequently asked questions on Tunisia, 18 July 2019
IMF, Tunisia
AfDB, African Economic Outlook 2019, 2019
ICT is not part of services but is recorded separately within IFs.
The IFs forecast shows that services make the largest contribution to GDP at just over 50%. Other sources indicate that the sector is well over 60% of total value added. The difference is likely due to different methodologies and classifications. For example, some definitions of services include ICT while in IFs ICT is considered as a standalone sector. European Commission, The EU text proposal on trade in services and investment liberalisation, Factsheet, European Commission, January 2019
Nordea Trade, Tunisia profile: economic and political overview; Al Arabiya, Tunisia’s tourism revenues jump 42.5 percent in the first half of 2019, 8 July 2019,
Organisation for Economic Co-operation and Development (OECD), Tunisia economic snapshot: economic forecast summary, November 2019
I Diwan, Tunisia’s upcoming challenge: Fixing the economy before it’s too late, Arab Reform Initiative, 23 September 2019,
H Morsy, A Giamouridis and R Selim, Rethinking the role of the state in Tunisia, European Bank, 12 September 2017,
Currency code for the Tunisian dinar.
Statistiques Tunisie, Foreign trade: data
The DCFTA will build on the EU–Tunisia Association Agreement, which entered into force in 1998 and created a free trade area between the EU and Tunisia. See European Commission, Tunisia,
European Commission, Tunisia
World Bank, The Unfinished Revolution: Bringing Opportunity, Good Jobs and Greater Wealth to All Tunisians, May 2014,
Expert consultation workshop in Tunis, 9–11 September 2019.
Expert consultation workshop in Tunis, 9–11 September 2019.
L Ayadi et al, Estimating Informal Trade across Tunisia's Land Borders, World Bank Policy Research Working Paper WPS 6731, 2013, Informal economy presents Tunisia with thorny issue, The Arab Weekly, 30 June 2017
S Quillen, Informal economy presents Tunisia with thorny issue, The Arab Weekly, 30 June 2017
Initiative Tunisienne Pour L’emploi Inclusif, Toward economic inclusion: transitioning Tunisia’s informal workers into the formal economy
UNCTAD, World Investment Report, 2019 Country Fact sheet, Tunisia
Giambrone Law, Tunisia’s radical strategy to encourage foreign investment, 13 September 2018,
M Kouni, Remittances and Growth in Tunisia: A Dynamic Panel Analysis from a Sectoral Database, Journal of Emerging Trends in Economics and Management Sciences (JETEMS), 7:5, 2016, 342–51. The remittance figures are likely underestimated because of the presence of a significant black market and other informal ways through which people send and receive money.
It is made up of five indicators: the probability of survival to age five, a child’s expected years of schooling, harmonised test scores as a measure of quality of learning, adult survival rate (fraction of 15-year-olds who will survive to 60), and the proportion of children who are not stunted. See World Bank, Human Capital Project
World Bank, The World Bank in Tunisia: Overview, 9 October 2018
Expert workshop, Tunisia, November 2019.
IMF, Tunisia’s economic outlook in 4 charts, 22 October 2018
I Diwan, Tunisia’s upcoming challenge: Fixing the economy before it's too late, Arab Reform Initiative, 23 September 2019
International Trade Administration (ITA), Tunisia: Agricultural sector, February 2019
Food and Agriculture Organization (FAO), Tunisia
ITA, Tunisia: Agricultural sector, February 2019
A Horchani, Water in Tunisia: A national perspective, in National Research Council, Agricultural water management: Proceedings of a workshop in Tunisia, Washington DC: The National Academies Press, 2007
FAO, Country fact sheet on food and agriculture policy trends: Tunisia, August 2017
FAO, FAO hosts National Workshop for Reducing Loss and Waste in the Grain Value Chain in Tunisia, 6 December 2017
L'Observatoire de la Souveraineté Alimentaire et de l'Environnement (OSAE), Building food sovereignty in Tunisia, February 2019
L'Observatoire de la Souveraineté Alimentaire et de l'Environnement (OSAE), Building food sovereignty in Tunisia, February 2019
World Bank, The Unfinished Revolution: Bringing Opportunity, Good Jobs and Greater Wealth to All Tunisians, May 2014
FAO, GIEWS – Global Information and Early Warning System, Tunisia, Country Brief, December 2018,
Observatory of Economic Complexity (OEC), Tunisia
OSAE, Building food sovereignty in Tunisia, February 2019
United Nations Development Programme (UNDP), Climate change focus: Tunisia coastline in need of climate cash boost, Africa Renewal, December 2019–March 2020
USAID, Climate risk profile: Tunisia
USAID, Climate risk profile: Tunisia,
USAID, Climate risk profile: Tunisia,
USAID, Climate risk profile: Tunisia
According to the World Bank, ‘subsidies can also introduce relative price distortions that typically provoke: overconsumption and underinvestment in subsidized sectors; the crowding out of more productive investments; delays in economic diversification; weaker current accounts and increasing budget deficits; and adverse effects on health and the environment’. See C Leiva et al, The Socioeconomic Impacts of Energy Reform in Tunisia: A Simulation Approach, World Bank, Policy Research Working Paper WPS 7312, 2015
The National Institute of Statistics designs and applies the poverty measurement methodology in Tunisia. Three poverty lines in dinars (TND) per person per year are estimated and used to calculate the official poverty rates: metropolitan areas (TND 1 878), communal (TND 1 703) and non-communal (TND 1 501). On average, the poverty line is TND 1 706, which roughly translates into US$2.60 per person per day. See World Bank, Poverty and Equity Brief: Tunisia, October 2019
Reading on MPI: see Oxford Poverty and Human Development Initiative (OPHI), About
OPHI, Global MPI country briefing of 2019: Tunisia (Arab states), September 2019
UNICEF, Tunisie: analyse de la pauvreté infantile en Tunisie, 2014, Children represent 29% of the population and account for 40% of total poverty. And this is the same for the poverty gap, at 5.1% for children against 2.8% for adults.
UNICEF, Tunisie: analyse de la pauvreté infantile en Tunisie, 2014, www.unicef.org.tn. The World Bank quotes the Tunisian National Statistics Institute estimate of the national poverty rate (US$2.60) in 2015 at 15.2%, having declined from 20.5% in 2010 and 23.1% in 2005. This differs from the estimate in IFs, which is 2.4%. The World Bank’s Poverty & Equity Brief on Tunisia published in April 2019 estimated the poverty rate using the US$3.20 threshold at 3.2% or 380 000 people. The IFs estimate is at 8.6% for 2018 (World Bank, Poverty and Equity Brief: Tunisia, October 2019). The latest data from the World Development Indicators in 2015 estimates that 3.2% of the population is living on less than US$3.20. (The Borgen Project, Causes of poverty in Tunisia, 23 September 2017; The Borgen Project, Why the poverty rate in Tunisia is still high, 29 September 2017; World Bank in Tunisia, Political-economy context).
OECD, Economic policy reform: Going For Growth Note – Tunisia,
A Hodges and A-R el Lahga, Coût, impact et financement de l’allocation pour enfants en Tunisie, Oxford Policy Management and Partnership for Economic Policy, Report for UNICEF and the Ministry of Social Affairs, Tunis, 6 May 2019.
See M Ayedi et al, Food subsidies and direct social assistance: Towards better targeting of monetary poverty and deprivations in Tunisia, AfDB, 30 March 2013
M Györi and F Veras Soares, Universal Social Protection in Tunisia: Comparing the Effectiveness and Cost‐Efficiency of Food and Energy Subsidies with a Proposed
Definitions from UNESCO, Glossary
OECD, PISA 2015 results (Volume V)
A Nagazi, Reading the shortcomings of the Tunisian educational system, World Bank, 30 October 2017,
With the help of the World Bank, Tunisia undertook the Tertiary Education for Employability Project in 2016 to address the disconnect between skills and the needs of the labour market. Oxford Business Group, Tunisia’s education system to be overhauled,
WHO and Regional Health System Observatory, Health system profile: Tunisia, 2006
World Hunger Index, Global Hunger Index 2019: Tunisia,
Portail national de la santé en Tunisie, Rapport de l’enquête national THES-2016
R Ben et al, Health System Challenges of NCDs in Tunisia, International Journal of Public Health, 60:S1, November 2014.
R Fakhfakh, M Hsairi and N Achour, Epidemiology and Prevention of Tobacco Use in Tunisia: A Review, US National Library of Medicine, 40:6, 2005.
World, ‘The accident rate is simply terrifying’: Tunisia sees deadly spikes on roads, 1 September 2016
Atlas Magazine, Decrease in the number of accidents in Tunisia in 2018, 15 January 2019
‘Improved drinking water sources are those which, by nature of their design and construction, have the potential to deliver safe water. The Joint Monitoring Program (JMP) subdivides the population using improved sources into three groups according to the level of service provided. In order to meet the criteria for a safely managed drinking water service, people must use an improved source meeting three criteria: it should be accessible on premises, water should be available when needed, and the water supplied should be free from contamination.’ WHO/UNICEF JMP, Drinking water,
WHO/UNICEF JMP, Drinking water,
UNICEF, MICs survey, 2019
World Bank, Water: Tunisia’s other development challenge, 4 September 2014
Energypedia, Tunisia energy situation
Energypedia, Tunisia energy situation; IMF, Frequently asked questions on Tunisia, 18 July 2019
International Energy Agency (IEA), Renewable Energy Law for Electricity Production (No. 74/2013)
Tunisia Live, Tunisia and Ghana Lead Africa’s Telecom Growth, June 2019
World Bank, The Unfinished Revolution: Bringing Opportunity, Good Jobs and Greater Wealth to All Tunisians, May 2014,
The Oxford Institute for Energy Studies, The Political Economy of Energy Subsidies in North Africa: The Untold Story, August 2017,
UNCTAD, Leapfrogging: look before you leap, Policy Brief 7, December 2018
UNCTAD, Leapfrogging: look before you leap, Policy Brief 7, December 2018
UNCTAD, Leapfrogging: look before you leap, Policy Brief 7, December 2018
S Quillen, Informal economy presents Tunisia with thorny issue, The Arab Weekly, 30 July 2017,
Page information
Contact at AFI team is Jakkie Cilliers and Stellah Kwasi
This entry was last updated on 12 May 2023 using IFs v7.45.
Donors and sponsors


Reuse our work
- All visualizations, data, and text produced by African Futures are completely open access under the Creative Commons BY license. You have the permission to use, distribute, and reproduce these in any medium, provided the source and authors are credited.
- The data produced by third parties and made available by African Futures is subject to the license terms from the original third-party authors. We will always indicate the original source of the data in our documentation, so you should always check the license of any such third-party data before use and redistribution.
- All of our charts can be embedded in any site.
Cite this research
Jakkie Cilliers and Stellah Kwasi (2026) The Rebirth: Tunisia’s potential development pathways to 2040. Published online at futures.issafrica.org. Retrieved from https://futures.issafrica.org/special-reports/country/tunisia/ [Online Resource] Updated 12 May 2023.