 EAC
EAC
Feedback welcome
Our aim is to use the best data to inform our analysis. See our Technical page for information on the IFs forecasting platform. We appreciate your help and references for improvements via our feedback form.
This page explores the development future of the East African Community (EAC), a Regional Economic Community (REC) consisting of eight members situated in East and Central Africa. The REC’s member states are all at differing points in their development trajectory and each requires unique interventions to spur on economic and societal growth and development.
The assessment discusses the region's demographics, economic sectors and various development scenarios with a forecast horizon to 2043. The analysis also highlights the importance of governance and infrastructure improvements for economic and social development. It further addresses challenges such as energy demand and poverty, suggesting that strategic initiatives across all sectors could greatly benefit the region's prosperity and stability. It emphasises the potential impacts of these scenarios on GDP, GDP per capita, life expectancy, education, industrialisation, poverty reduction, inequality and carbon emission.
For more information about the International Futures modelling platform that we use for the development of the various scenarios, please see About this Site.
Summary
We begin this page with an introductory assessment of the East African Community’s (EAC) context, looking at its history, current standing, and vision of the future. The EAC has eight members, six of which the World Bank classifies as low-income countries and two as lower-middle-income countries.
This section is followed by an analysis of the Current Path for the EAC which informs the region’s likely current development trajectory to 2050. It is based on current geopolitical trends and assumes that no major shocks would occur in a ‘business as usual’ future.
- The EAC’s total population will rise from 332 million people in 2023 to 647 million people by 2050. The rapidly growing population will stem from one source in particular: DR Congo, who will see its population grow from 103 millio people in 2023 to 225 million people by 2050.
- In 1990, the EAC’s GDP stood at US$87 billion, before expanding by 237% to reach US$293 billion in 2023. On the Current Path, growth will remain high and boost economic output to US$1.5 trillion by 2050.
- The members of the EAC have consistently been amongst the worst-performing countries in Africa in terms of GDP per capita since 1990. In 1990, the EAC’s GDP per capita stood at 46% of Africa’s average, improving slightly to 47% by 2023. By 2050 however, the EAC’s GDP per capita will equate to 64% of Africa’s average income, showing strong growth over the forecast horizon.
- Compared to the average poverty rate in Africa, at the US$2.15 poverty line, the EAC performs poorly. In 2023, the poverty rate of 45% was 15 percentage points above the average for Africa. The EAC will catch up, and by 2050, only 15% of the population will live below the US$2.15 poverty line, compared to 13% for Africa.
- The EAC's overarching development plan is Vision 2050, which is implemented through medium-term development strategies that renew every five years. The current strategy, the sixth of its kind, stretches from 2021/22 to 2025/26 and outlines multiple focus areas and goals that the REC aims to achieve in that time.
The next section compares progress on the Current Path with eight sectoral scenarios. These are Demographics and Health; Agriculture; Education; Manufacturing; the African Continental Free Trade Area (AfCFTA); Large Infrastructure and Leapfrogging; Financial Flows; and Governance. Each scenario is benchmarked to present an ambitious but reasonable aspiration in that sector.
- In 2023, communicable diseases accounted for 53% of all deaths in the EAC, but the EAC will undergo its transition in 2031 when non-communicable diseases overtake communicable diseases as the leading cause of death in the region. Rates of infant mortality in the EAC in 2023 were at 38.5 deaths per 1 000 live births and will reduce to 17.9 in the Current Path by 2050. In the Demographics and Health scenario, the average by 2050 will be 12.7 deaths.
- Since 2000, the EAC has not met agricultural demand and shortages in agricultural production will worsen considerably over the forecast horison: in 2023, there was a deficit of 20 million tons, which will balloon to 223 million tons by 2050. Over the forecast horizon however, the EAC will increasingly depend on agricultural imports, with imports as a % of demand rising to 36.7% by 2050 in the Current Path. The Agriculture scenario lowers exposure to international markets, lowering the import dependence to 21.9% by 2050.
- At the REC level, in 2023 the adult population had 7 years of education, which is set to increase to 7.9 years in 2050 on the Current Path. In the Education scenario, the mean years of education of the EAC would increase to 8.4 years.
- According to the World Bank’s World Development Indicator database, the average size of the manufacturing sector, as a percentage of GDP, has only increased by 1.2 percentage points between 2004 and 2022, from 10.6 to 11.8%. Uganda is the only bright spot over this period, with the manufacturing sector growing from 6.4 to 16.4% as a % of GDP. The EAC will see steady but unspectacular growth in the Manufacturing scenario, as the manufacturing sector will be 4.2 percentage points larger by 2050 compared to the Current Path.
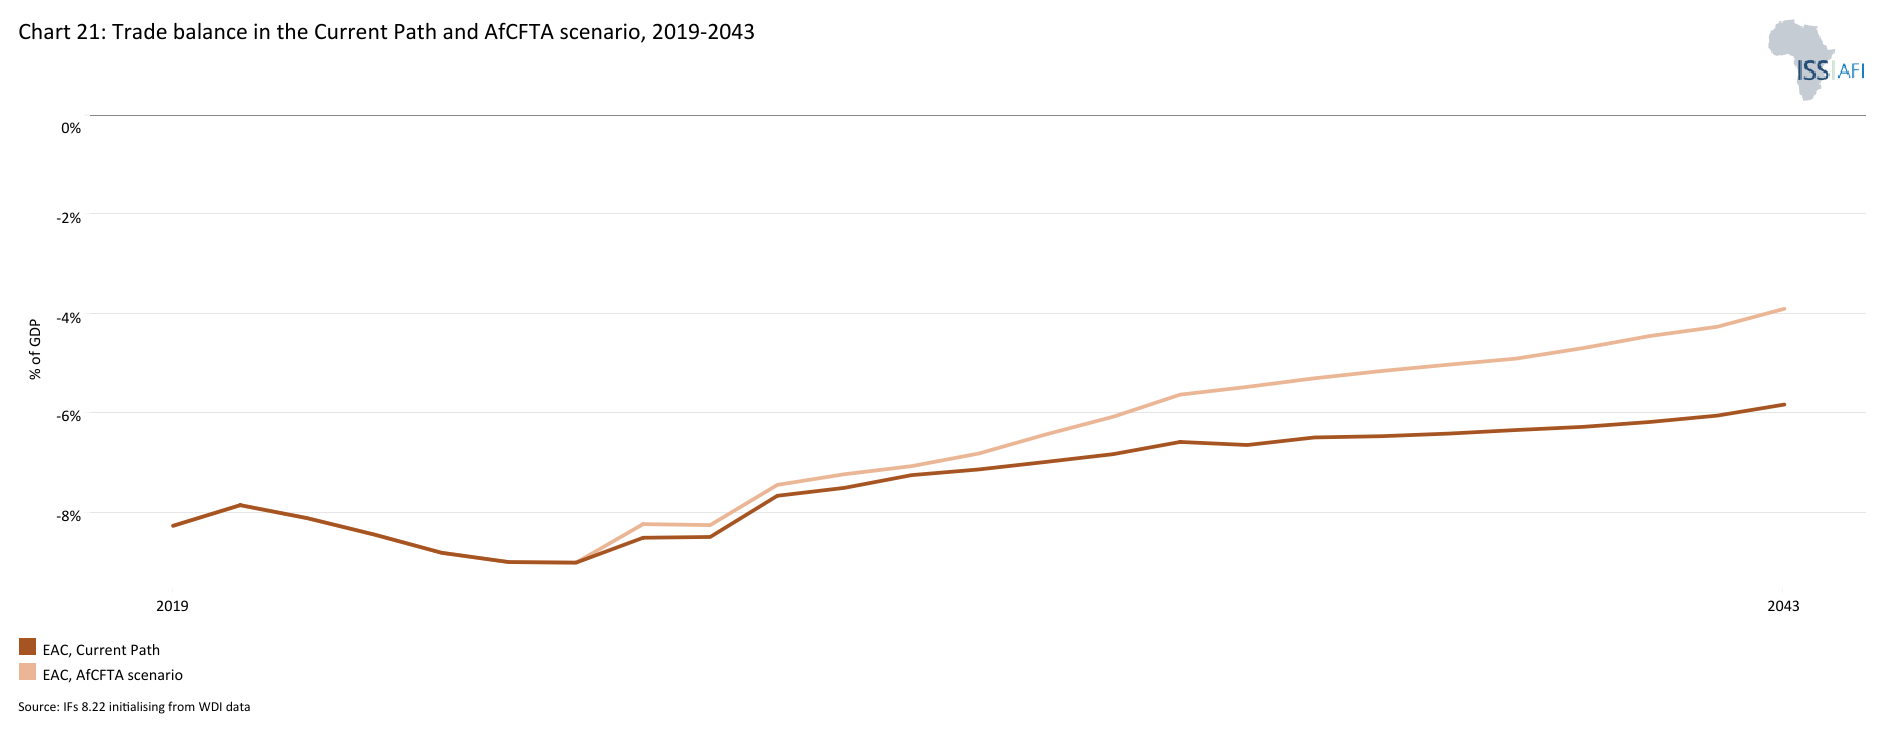
- In 2023, the EAC’s trade openness equated to 43% of GDP, trailing sub-Saharan Africa by 1.6 percentage points and North Africa by 9.7 percentage points, respectively. The region will see a steady increase, reaching 66% by 2050. In 2023, the EAC had a trade deficit of 8.7% of GDP, which will improve to 4.3% by 2050. In the AfCFTA scenario, the REC will improve its position, reaching a trade deficit of 3.1% by 2050.
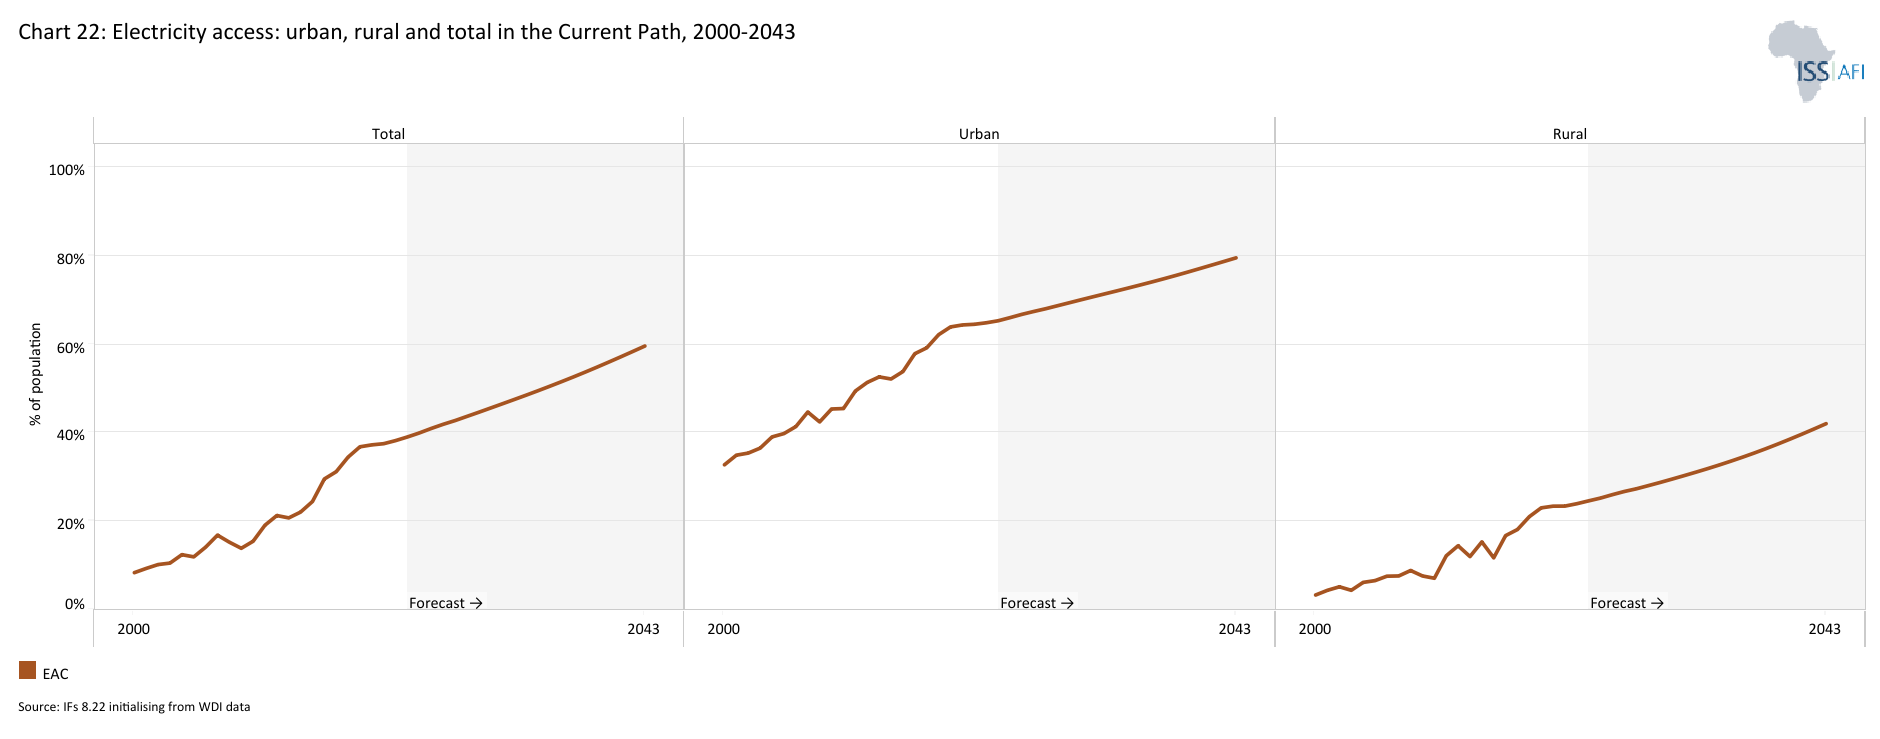
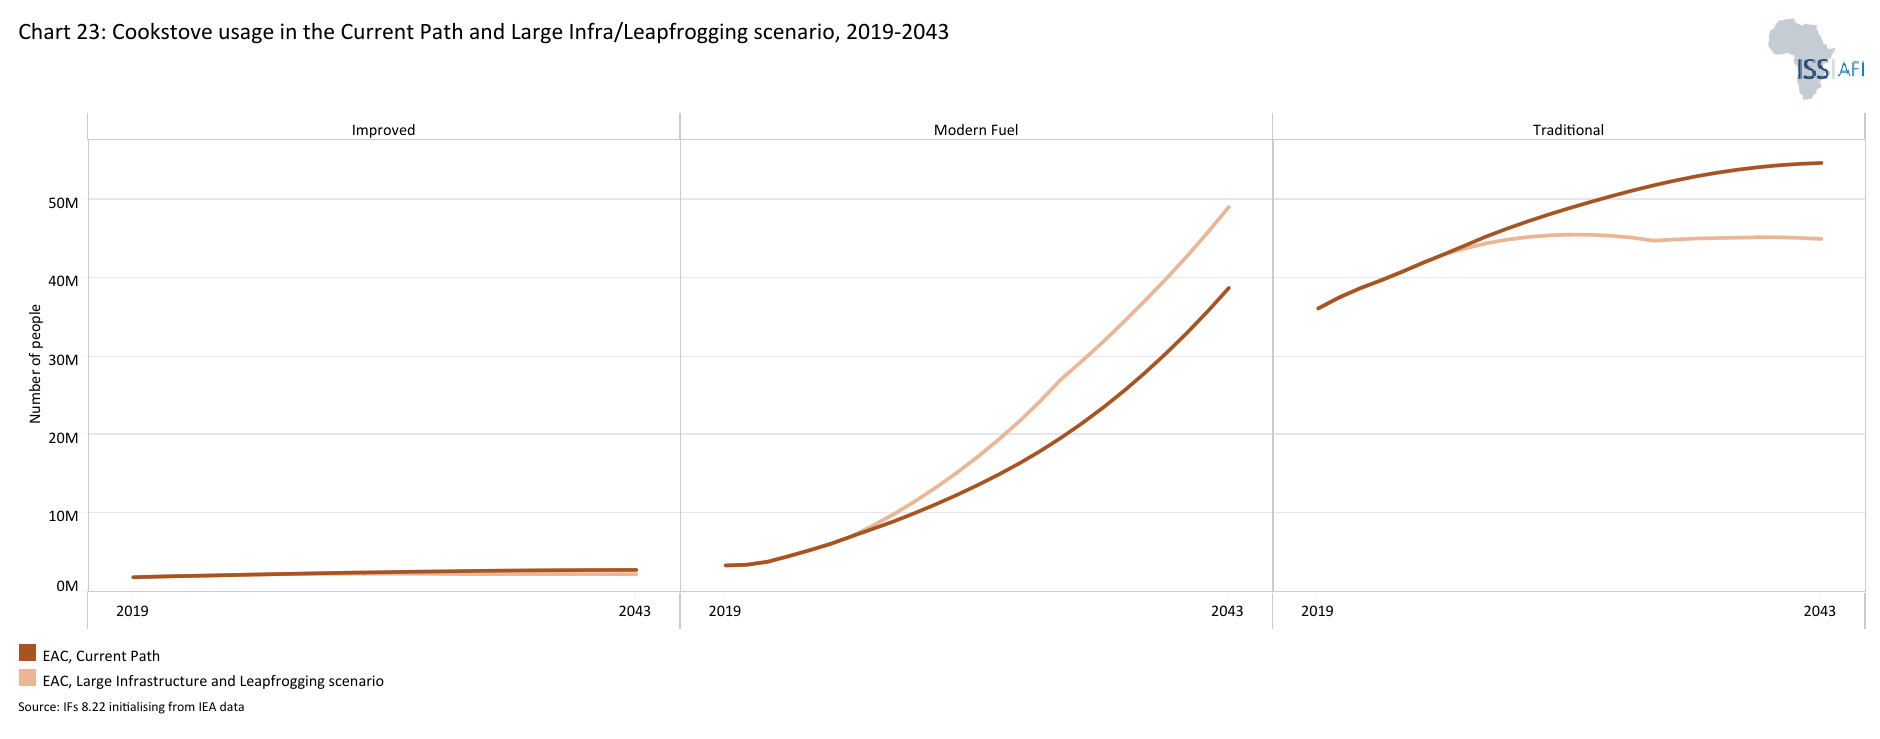
- As of 2023, total electricity access in the EAC stood at 39%, compared to 50% in sub-Saharan Africa. By 2050, the access rate will have increased to 68%, while sub-Saharan Africa’s will reach 75%, thus reducing the gap to 7 percentage points. The EAC will stand to benefit from a transition to clean cooking, as modern fuel cookstoves will be used by 53% of households by 2050, compared to 45% for traditional cookstoves. The Large Infrastructure and Leapfrogging scenario increases the speed of this transition and by 2050 the use of modern fuel cookstoves will reach 63%, 10 percentage points higher than in the Current Path.
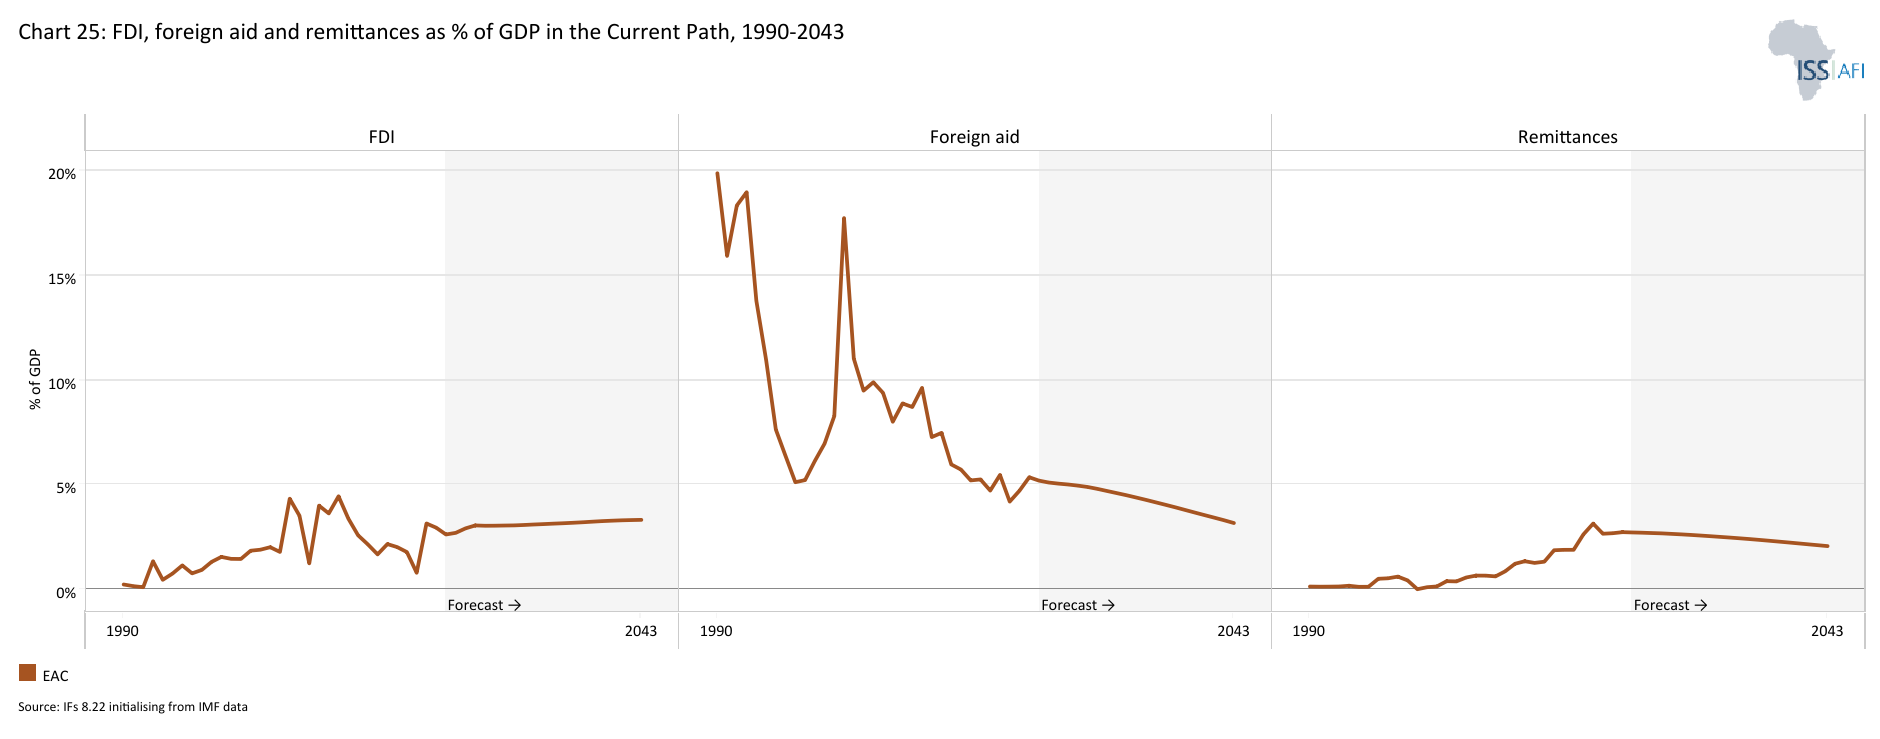
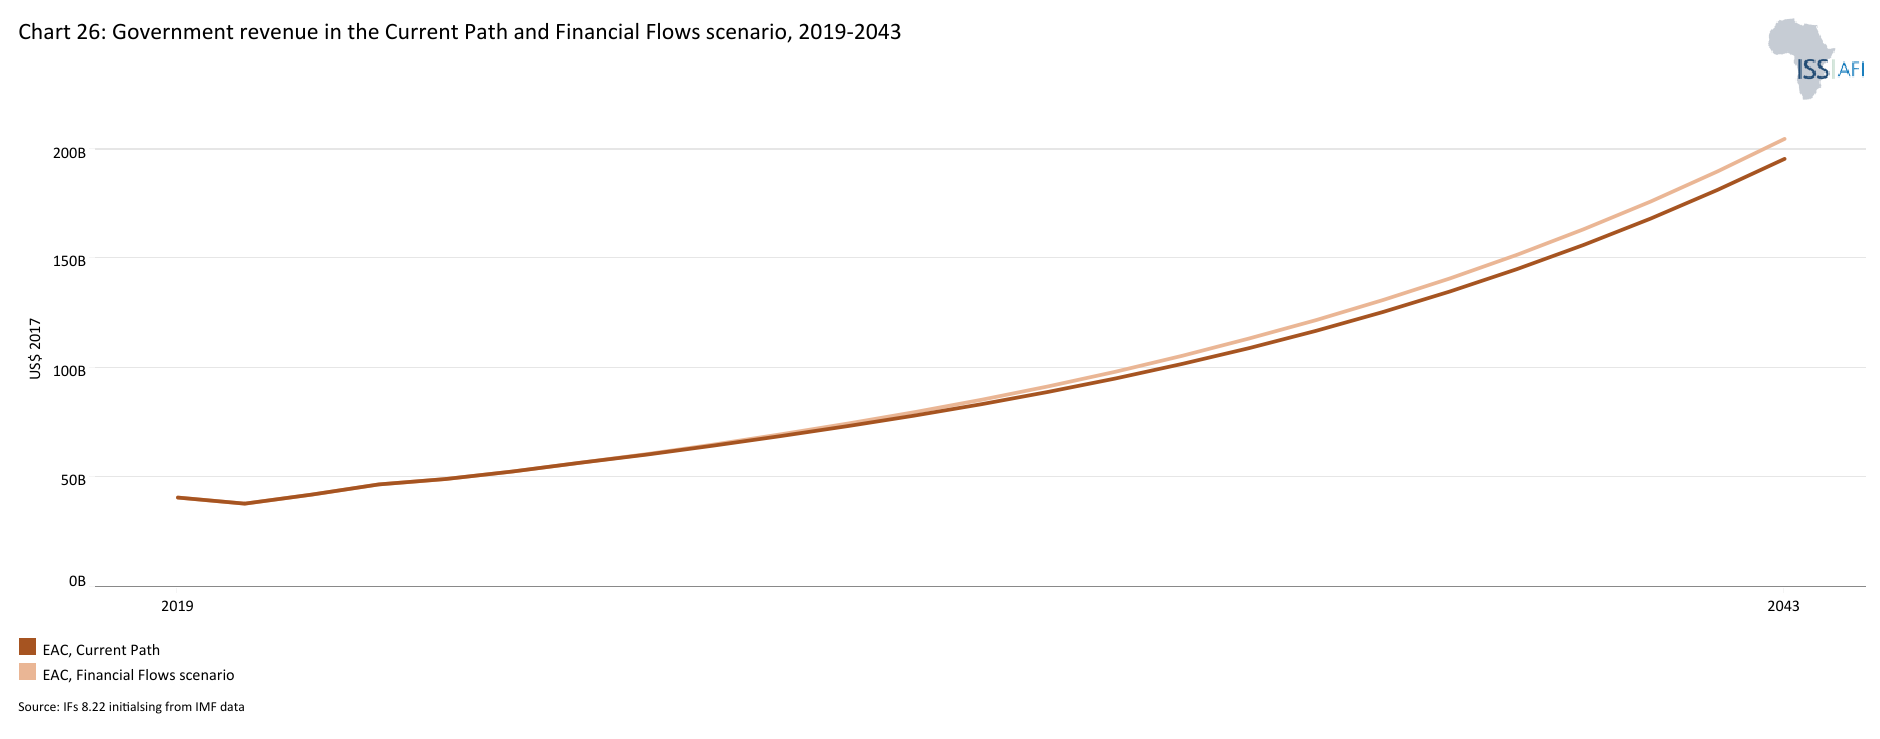
- In 2023, the EAC generated revenue equal to 17% of GDP, compared to 17.6% for sub-Saharan Africa and 27.3% in North Africa. Although collection improves over the forecast period, the EAC will continue to lag behind, reaching 21.7% by 2050. North Africa will see government revenue equal to 31% by 2050. The Financial Flows scenario makes a marginal difference, increasing the rate to 22.1% for the EAC by 2050. DR Congo has been the main destination for foreign investment in the EAC and will continue to be so over the forecast horison. Foreign aid has been low on average for the EAC, but Somalia, Burundi and Rwanda still rely significantly on foreign assistance to address development needs.
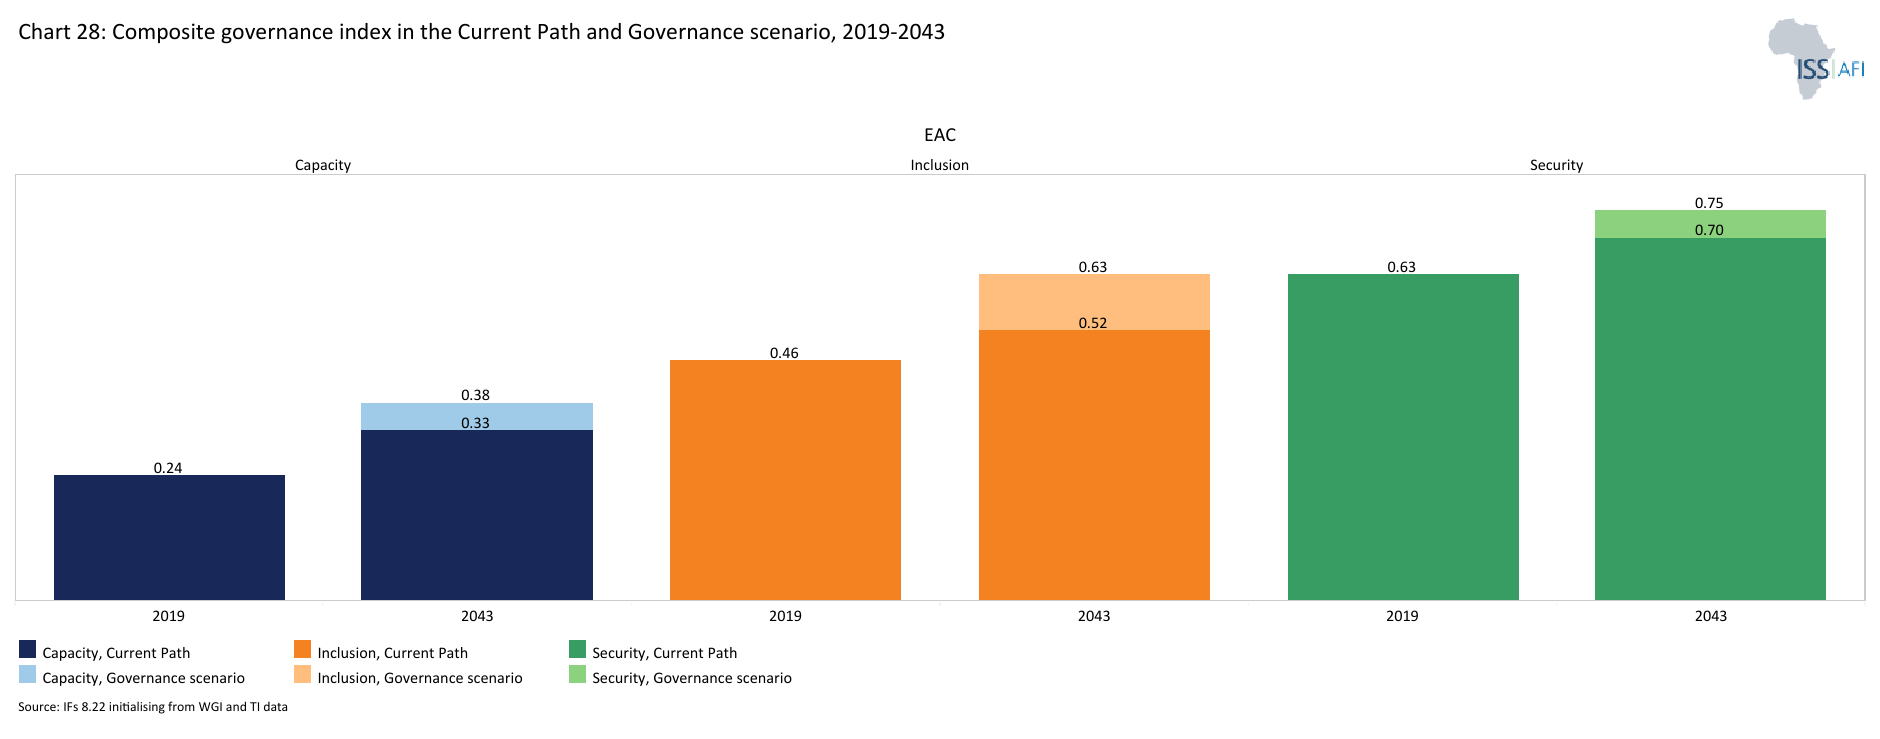
- In the Governance scenario, the EAC’s security increases considerably, so much so that the EAC’s score of 0.77 surpasses sub-Saharan Africa’s of 0.74 by 2050. Similarly, the scores for government capacity and inclusion will rise significantly in the scenario by 2050, compared to the Current Path.
In the third section, we compare the impact of each of these eight sectoral scenarios with one another and subsequently with a Combined scenario (the integrated effect of all eight scenarios). In our forecasts, we measure progress on various dimensions such as economic size (in market exchange rates), gross domestic product per capita (in purchasing power parity), extreme poverty, carbon emissions, the changes in the structure of the economy, and selected sectoral dimensions such as progress with mean years of education, life expectancy, the Gini coefficient or reductions in mortality rates.
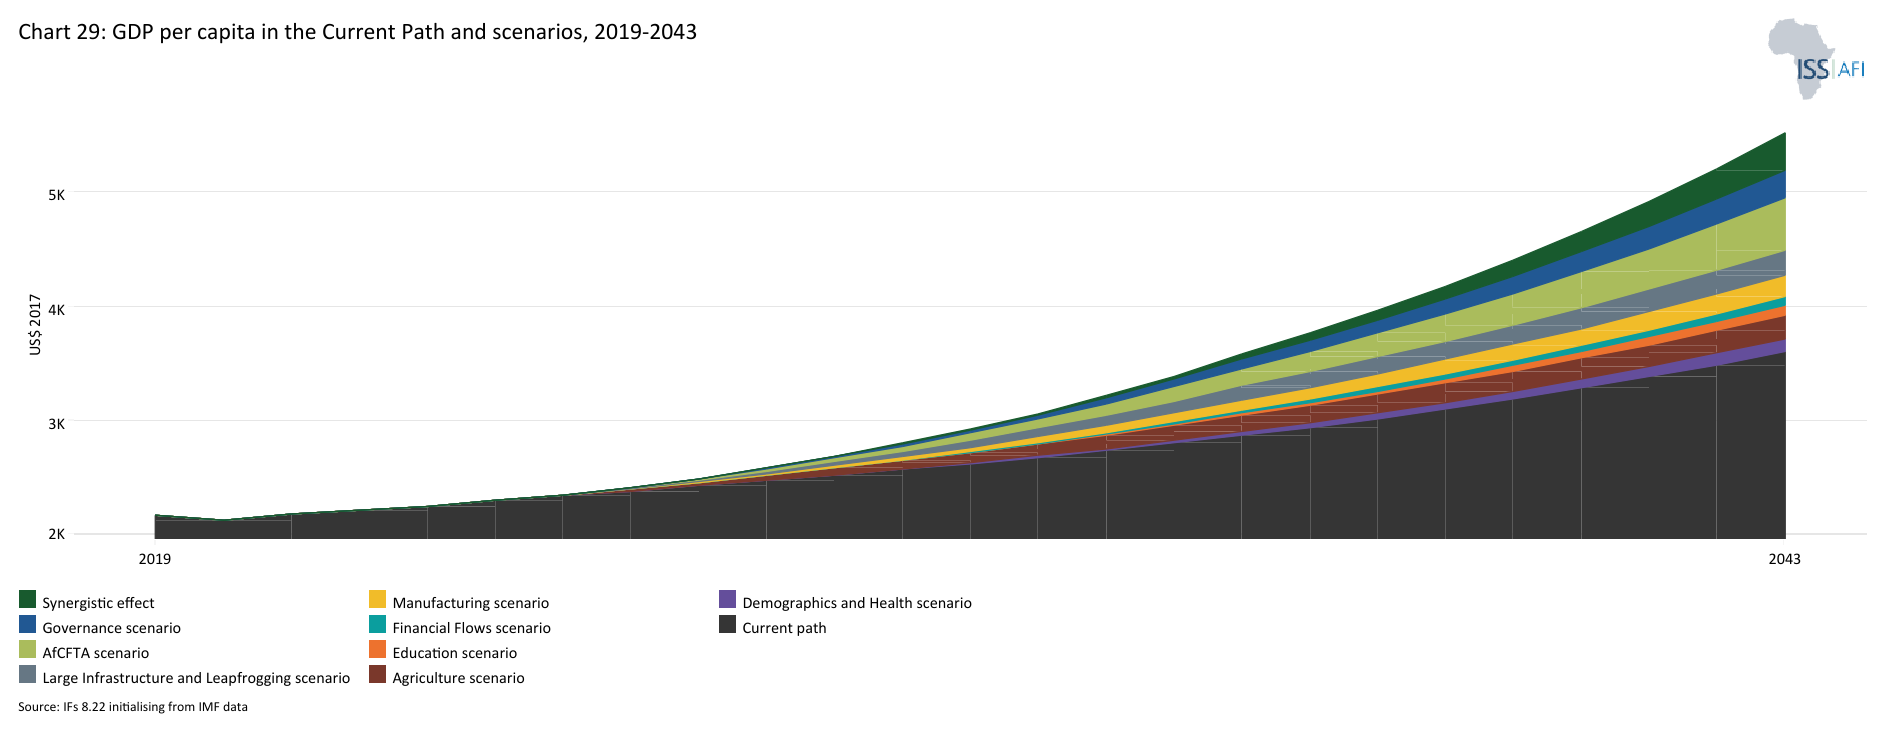
- The scenario with the greatest impact on GDP per capita by 2050 is the AfCFTA scenario, followed by the Governance, Large Infrastructure and Leapfrogging, and Manufacturing scenarios. The AfCFTA scenario will increase GDP per capita to US$5 477, which is an increase of 12% compared to the Current Path for 2050.
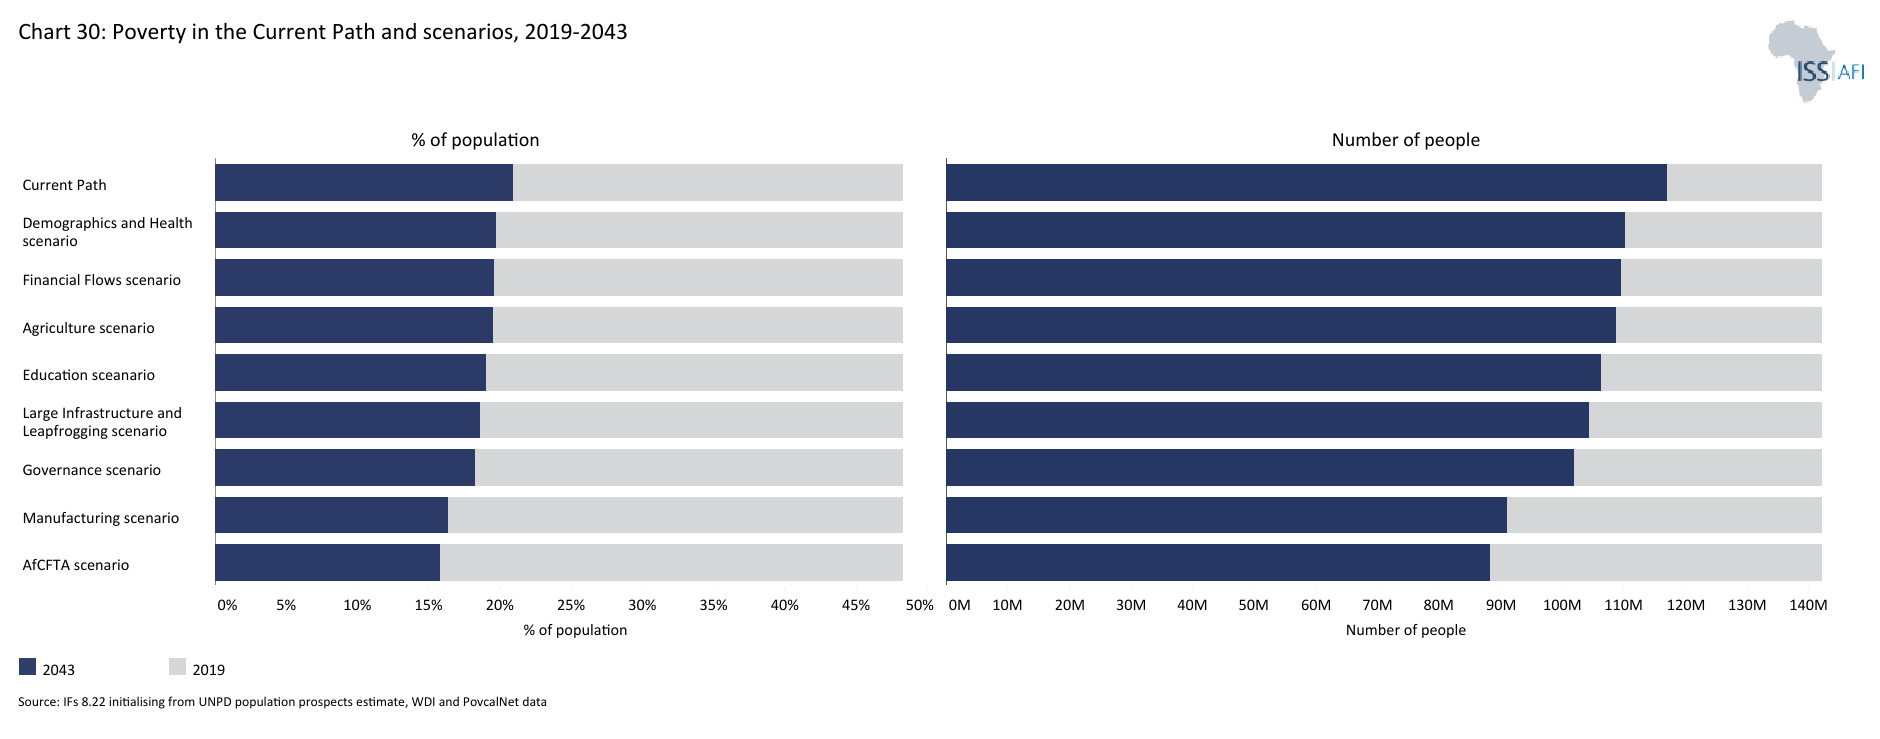
- The EAC will benefit most from the AfCFTA scenario in terms of poverty reduction, followed by the Manufacturing and Governance scenarios. The AfCFTA scenario reduces extreme poverty by 6.7 percentage points reduction, followed by Manufacturing at 4.7 percentage points and Governance at 2.9 percentage points.
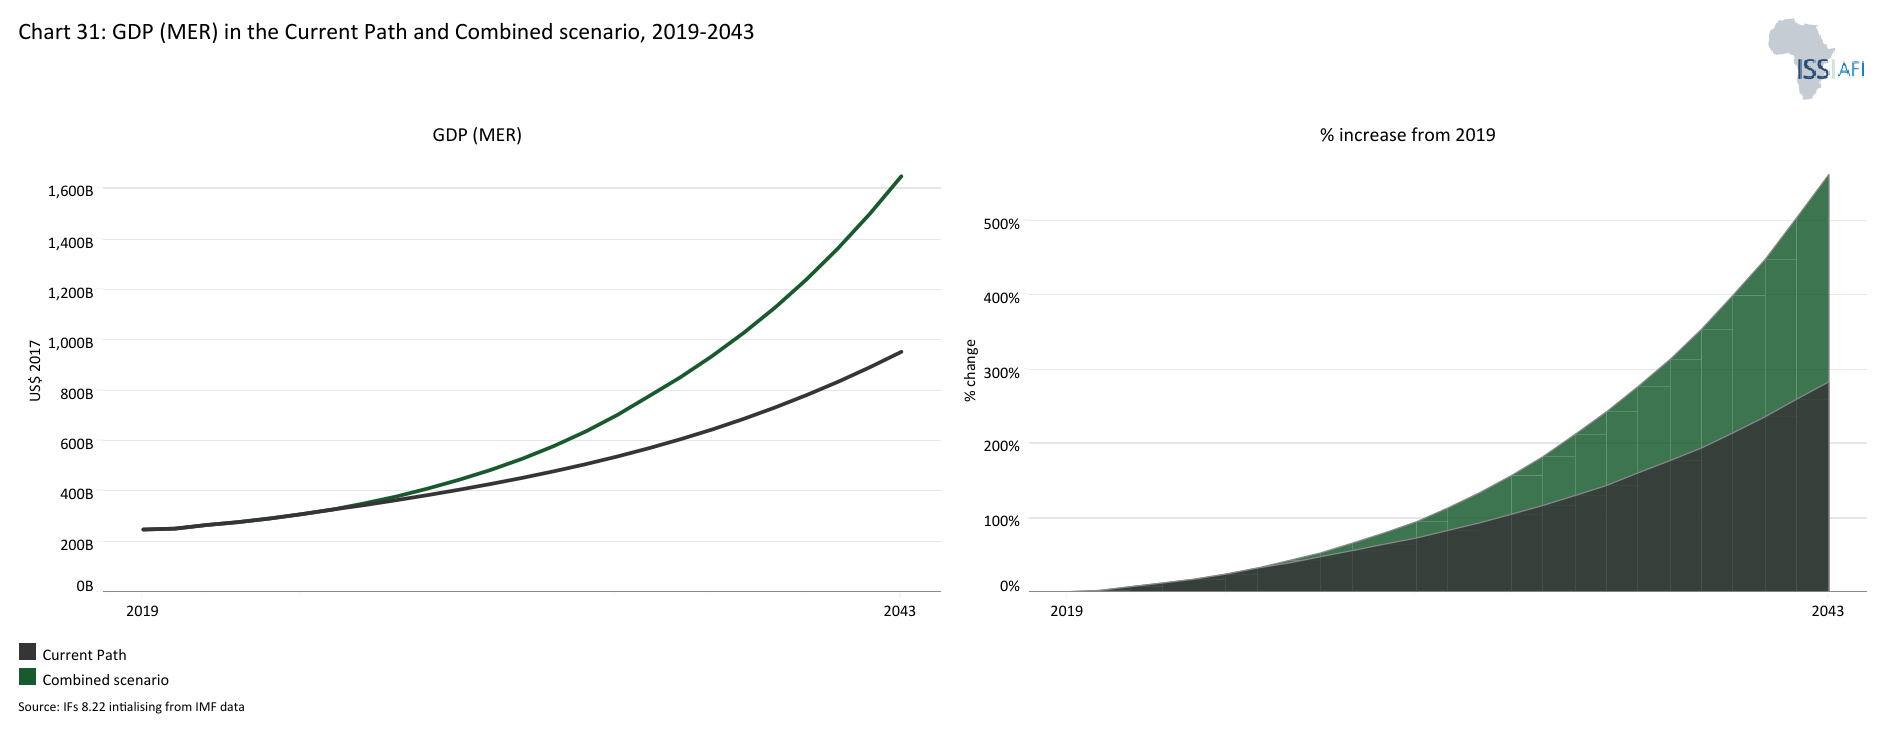
- In the Combined scenario, the EAC’s combined GDP will reach US$3.4 trillion by 2050, a 123% increase over the Current Path of US$1.5 trillion. This impressive performance is driven by substantial increases in DR Congo, Kenya, Tanzania and Uganda.
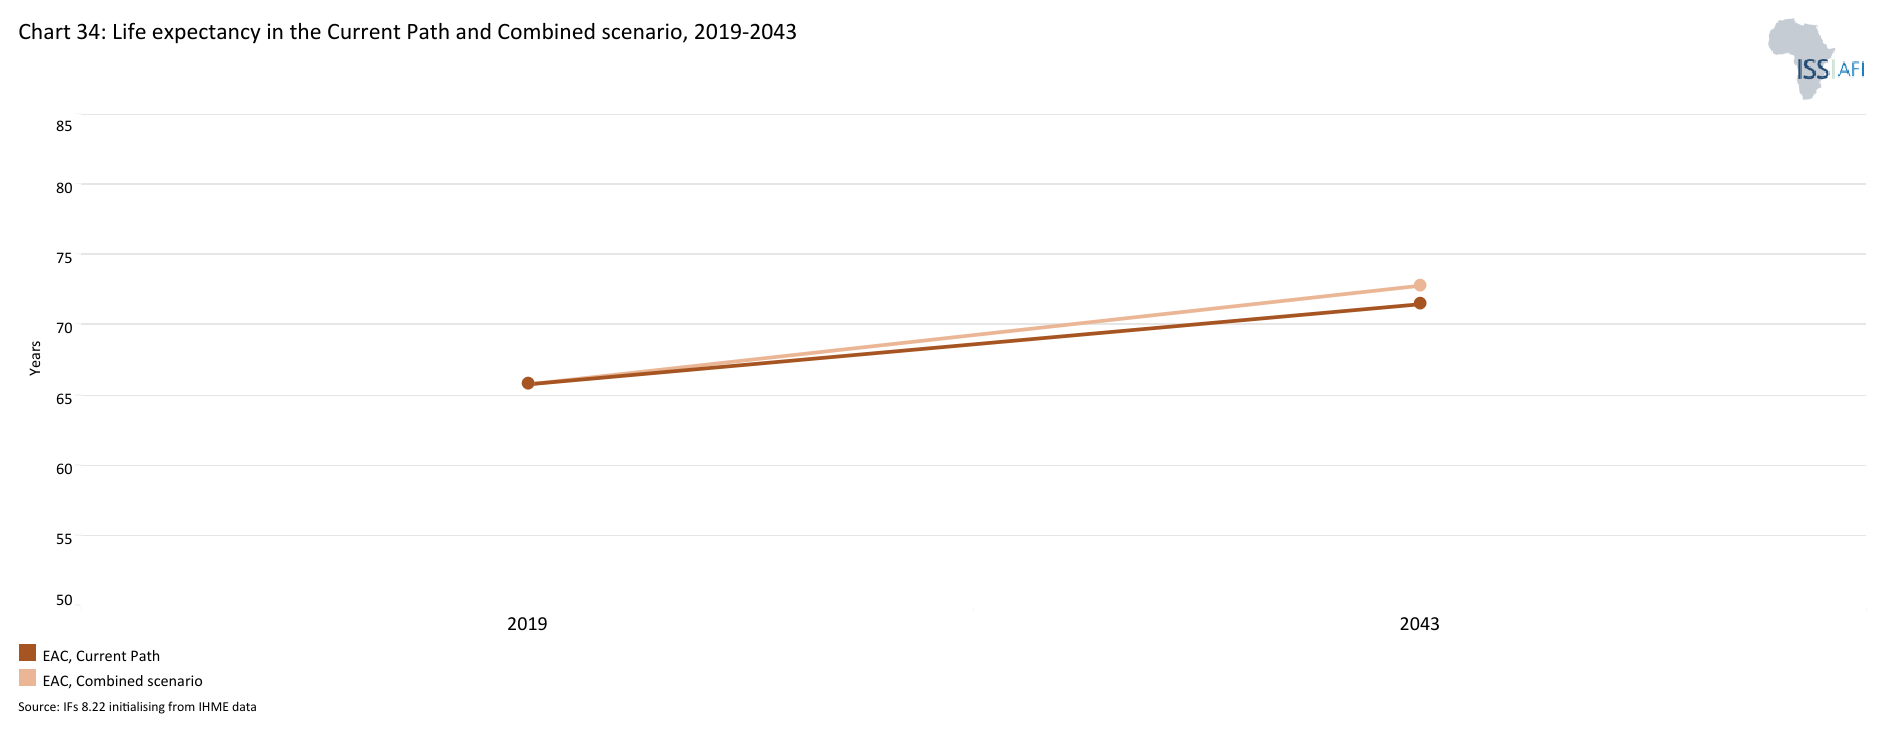
- In the Combined scenario, the EAC’s life expectancy will climb to 74.3 by 2050, which is 1.5 years above the Current Path. The EAC will have surpassed the sub-Saharan African average of 73.3 and closed the gap to North Africa’s 77.1.
We end this page with a summarising conclusion offering key recommendations for decision-making.
The EAC will grow steadily on the Current Path, however, the rate of change will not sufficiently address the needs of a rapidly expanding population, and timely interventions are needed to address extreme poverty, income inequality, insecurity, weak agriculture output and low levels of electricity access. Aligning development plans and trajectories will remain a obstacle to regional growth as countries battle with unique challenges. Nevertheless, the EAC is a useful forum for convening member states to increase coordination, but full buy in from national governments to adopt regional development objectives is crucial, and promises to spur on shared growth.
All charts for EAC
- Chart 1: Political map of EAC
- Chart 2: Population structure in Current Path, 1990–2050
- Chart 3: Population distribution map, 2023
- Chart 4: Urban/rural population, 1990-2050
- Chart 5: GDP in MER and growth rate in the Current Path, 1990–2050
- Chart 6: Size of the informal economy in the Current Path, 2020-2050
- Chart 7: GDP per capita in Current Path, 1990–2050
- Chart 8: Extreme poverty in the Current Path, 2020-2050
- Chart 9: National Development Plan of EAC
- Chart 10: Relationship between Current Path and scenarios
- Chart 11: Mortality distribution in 2020 and 2050
- Chart 12: Infant mortality rate in Current Path and Demographics and Health scenario, 2020–2050
- Chart 13: Demographic dividend in the Current Path and the Demographics and Health scenario, 2020-2050
- Chart 14: Crop production and demand 1990-2050
- Chart 15: Import dependence in the Current Path and Agriculture scenario, 2020–2050
- Chart 16: Progress through the educational funnel in the Current Path, 2020-2050
- Chart 17: Mean years of education in Current Path and Education scenario, 2019–2043
- Chart 18: Value-add by sector as % of GDP in the Current Path, 2020-2050
- Chart 19: Value-add by the manufacturing sector in the Current Path and Manufacturing scenario, 2020-2050
- Chart 20: Exports and imports as a percentage of GDP, 1990 to 2050
- Chart 21: Trade balance in CP and AfCFTA scenario, 2020–2050
- Chart 22: Electricity access: urban, rural and total in the Current Path, 1990-2050
- Chart 23: Cookstove usage in the Current Path and Large Infra/Leapfrogging scenario, 2020-2050
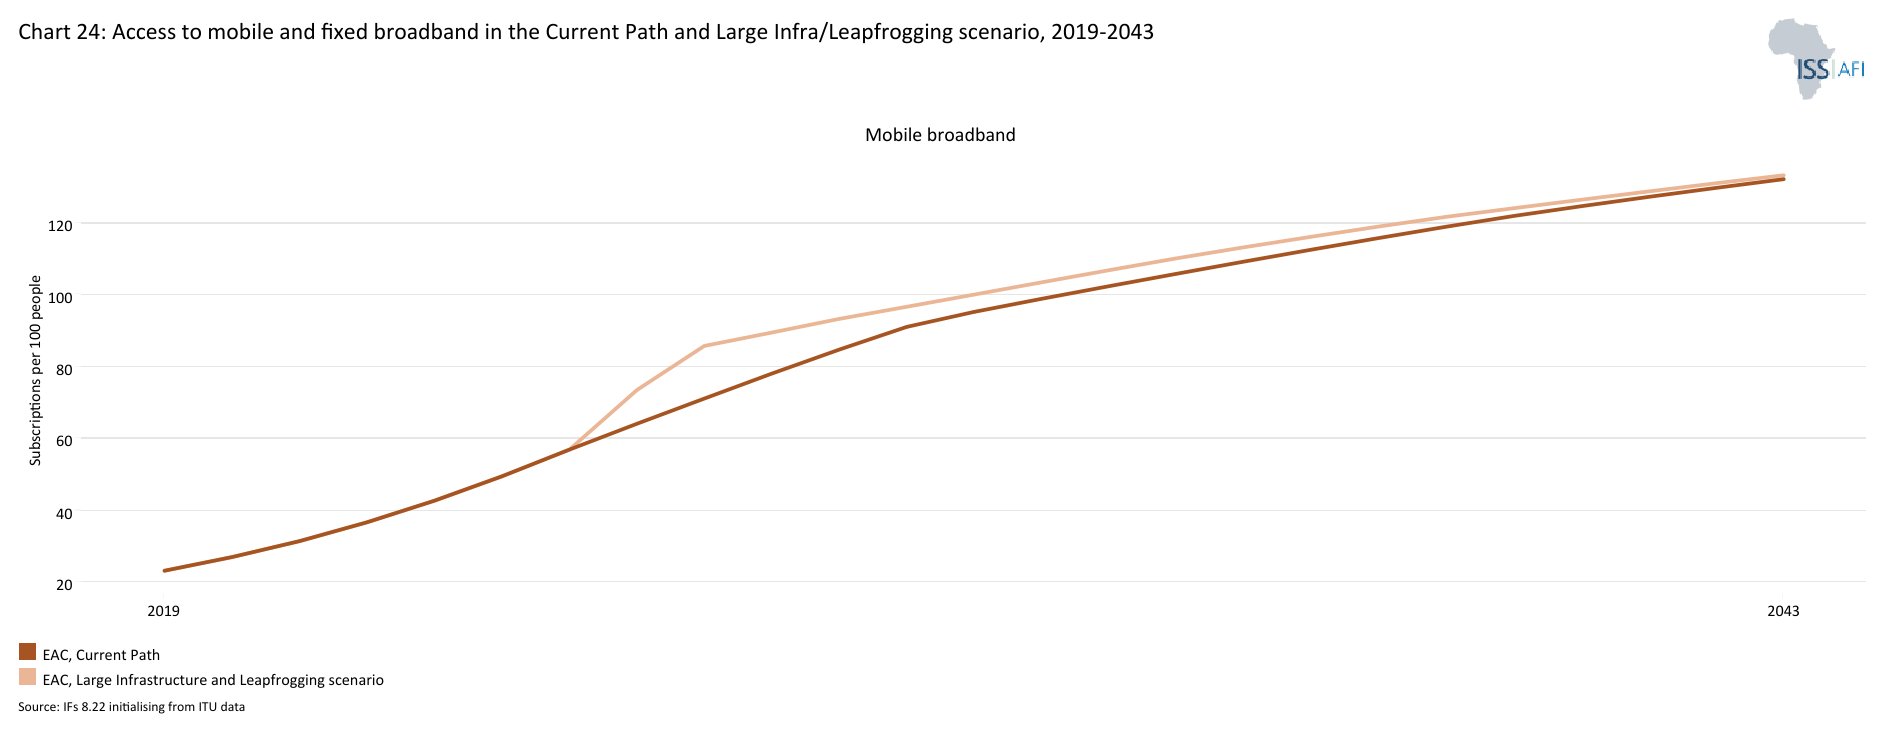
- Chart 24: Access to mobile and fixed broadband in the Current Path and the Large Infra/Leapfrogging scenario, 2020-2050
- Chart 25: Trends in FDI, aid and remittances as a % of GDP, 1990-2050
- Chart 26: Government revenue in Current Path and Financial Flows scenario, 2020-2050
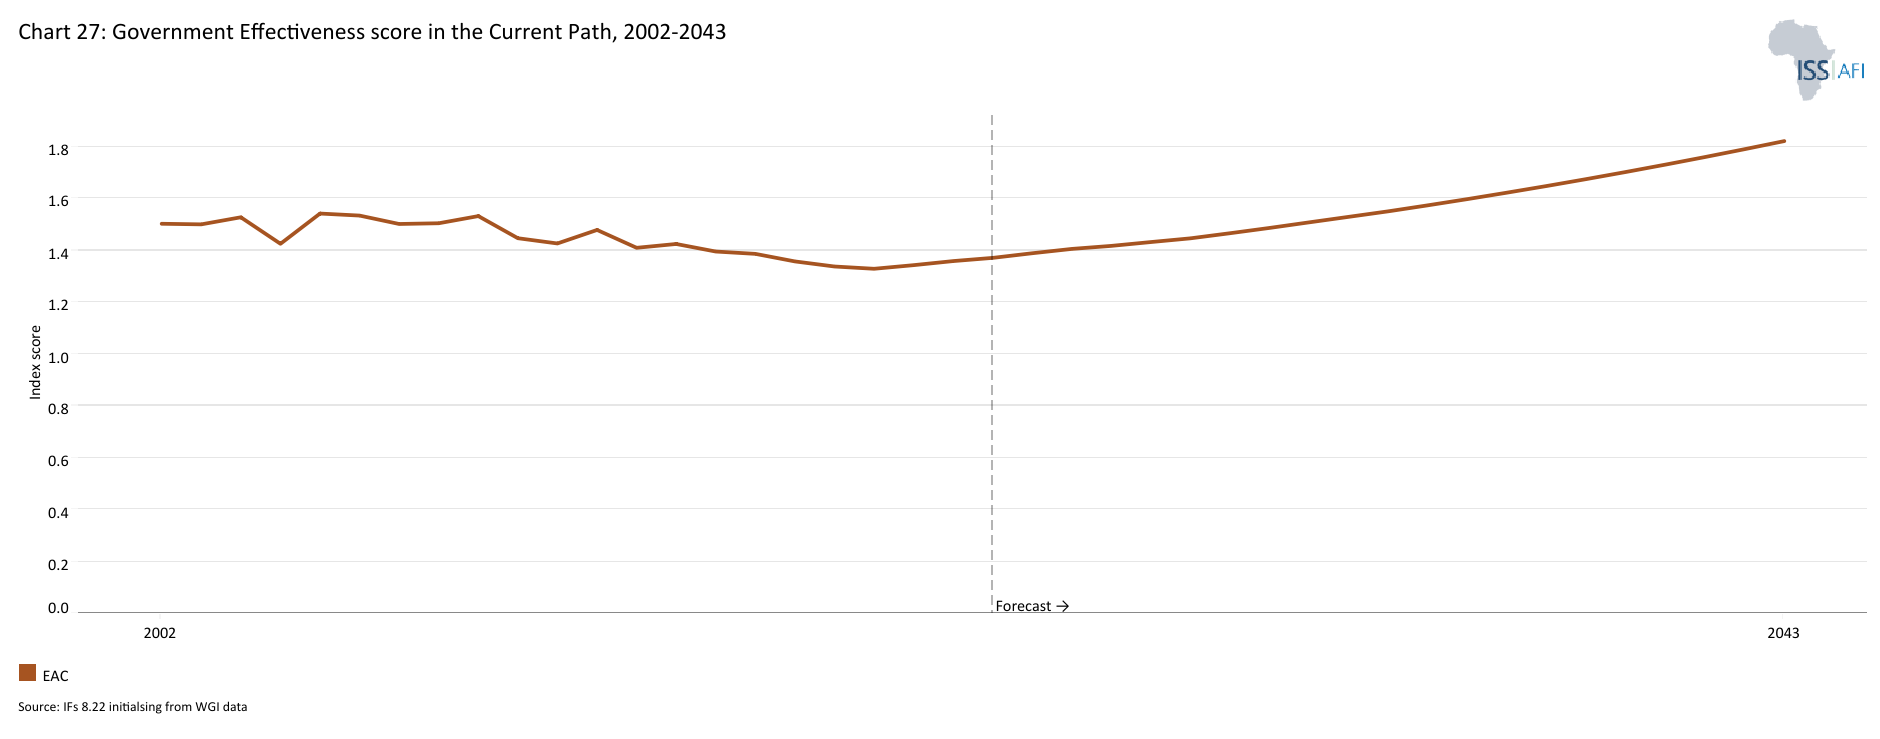
- Chart 27: Government Effectiveness score in the Current Path, 2002-2050
- Chart 28: Composite governance index in the Current Path and Governance scenario, 2020-2050
- Chart 29: GDP per capita in the Current Path and scenarios, 2020-2050
- Chart 30: Poverty in the Current Path and scenarios, 2020-2050
- Chart 31: GDP (MER) in the Current Path and Combined scenario, 2020-2050
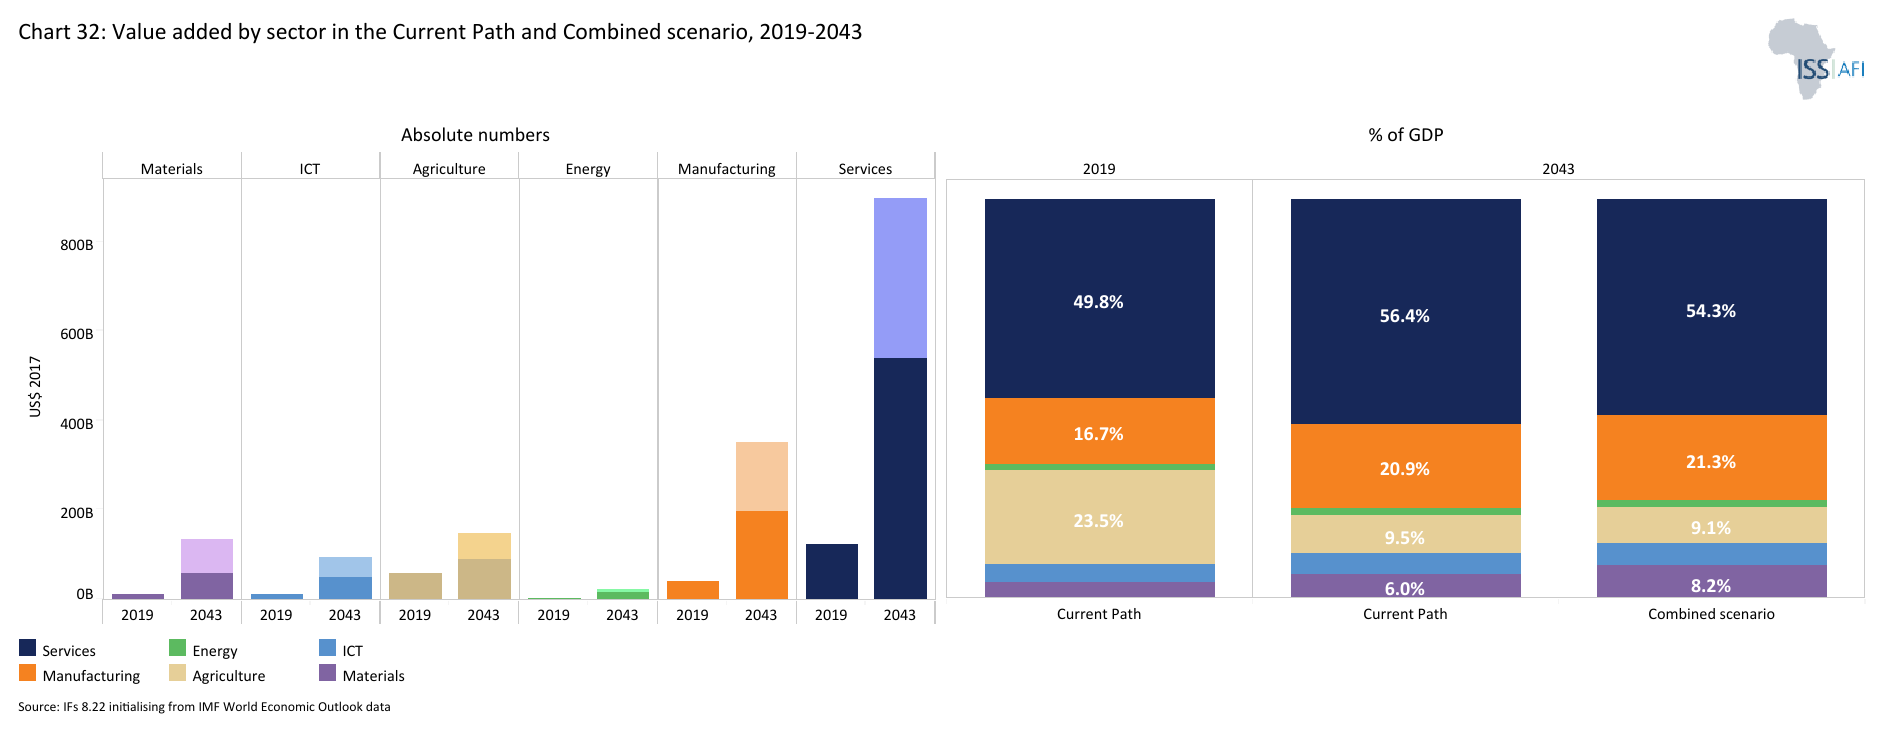
- Chart 32: Value added by sector in the Current Path and Combined scenario, 2020-2050
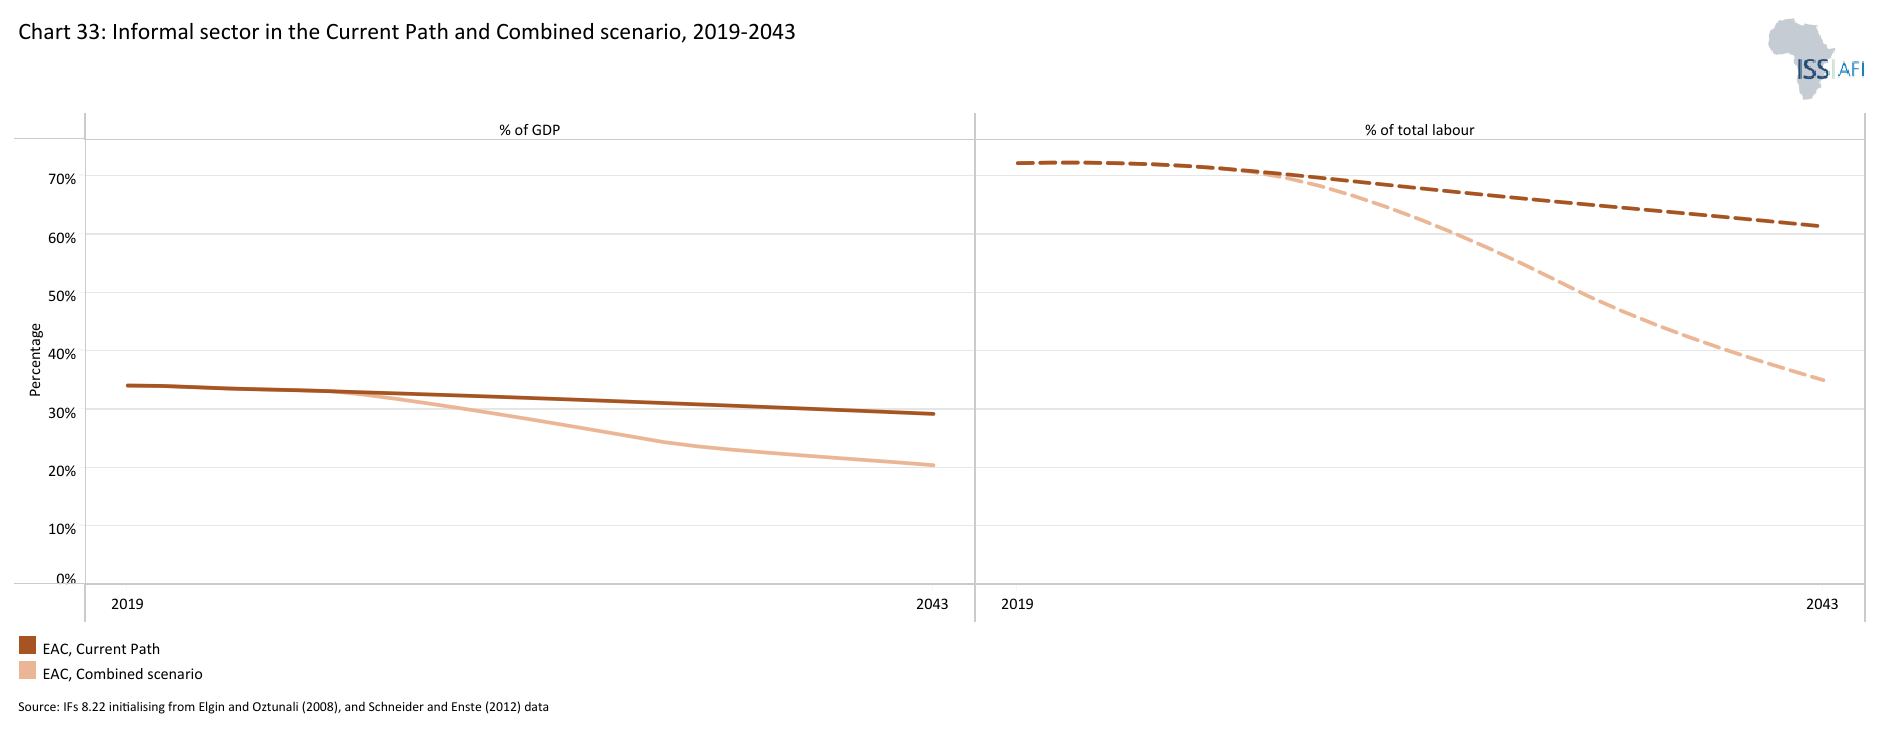
- Chart 33: Informal sector in the Current Path and Combined scenario, 2020-2050
- Chart 34: Life expectancy in the Current Path and Combined scenario, 2020-2050
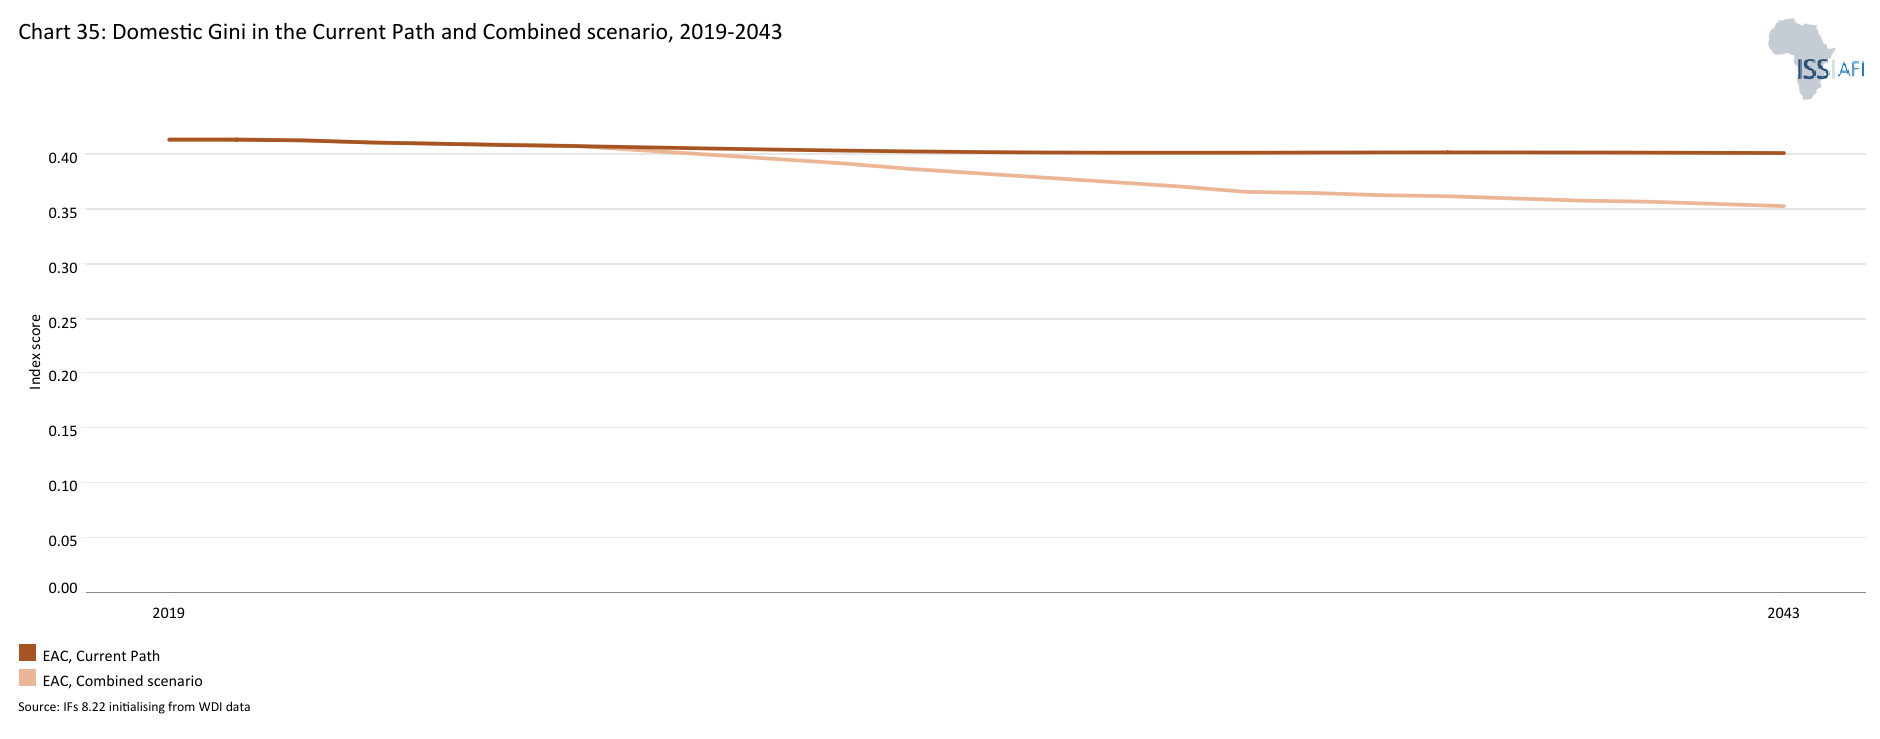
- Chart 35: Domestic Gini in the Current Path and Combined scenario, 2020-2050
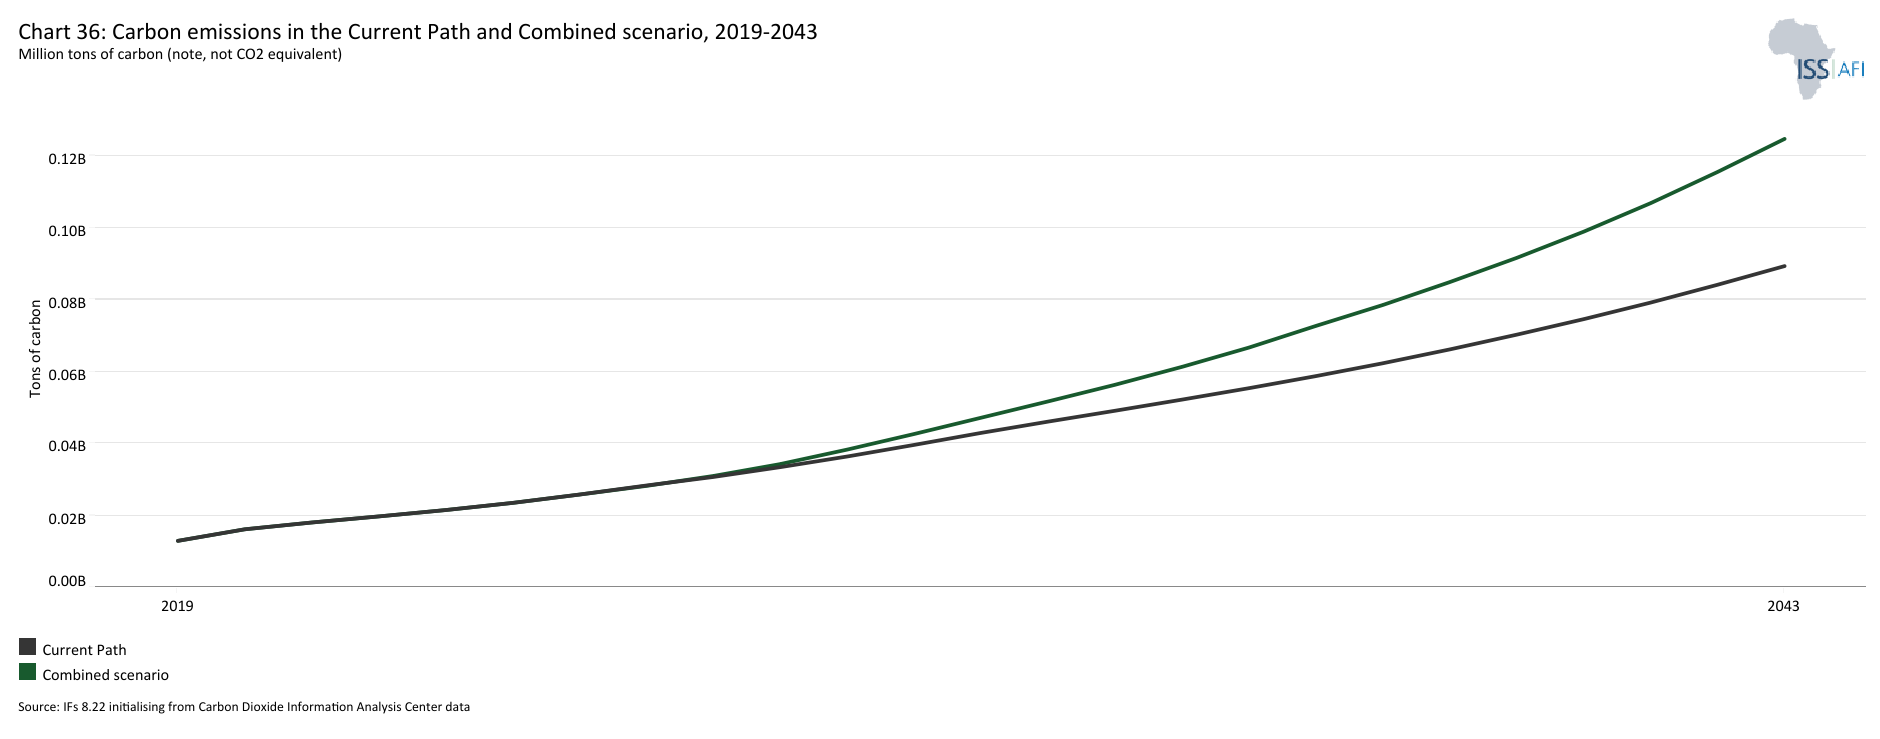
- Chart 36: Carbon emissions in the Current Path and Combined scenario, 2020-2050
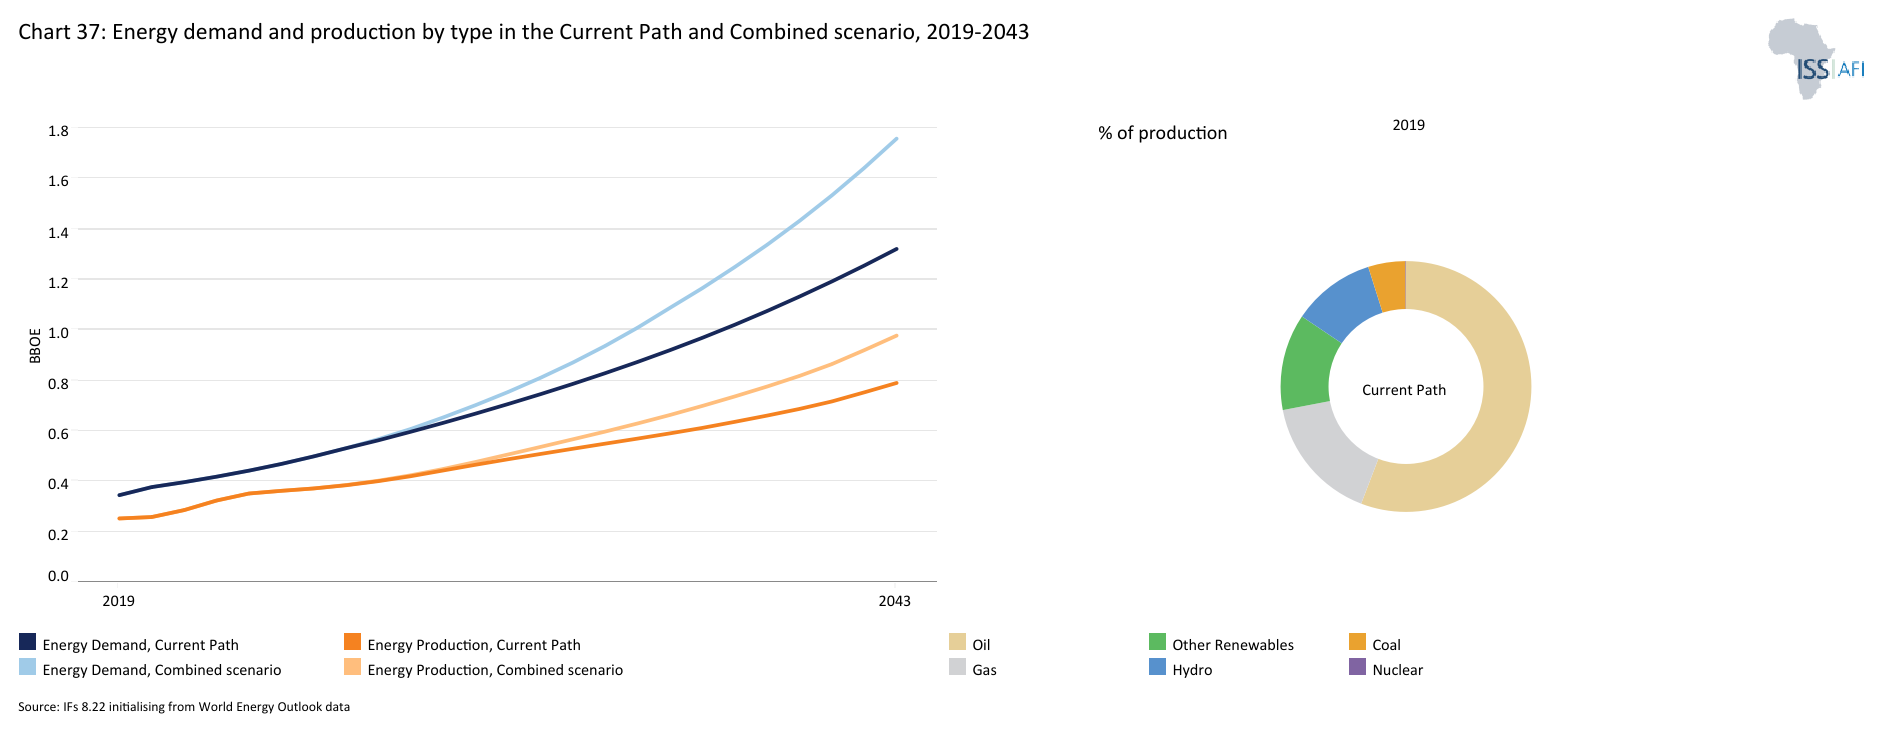
- Chart 37: Energy demand and production by type in the Current Path and Combined scenario, 2020-2050
- Chart 38: Policy recommendations
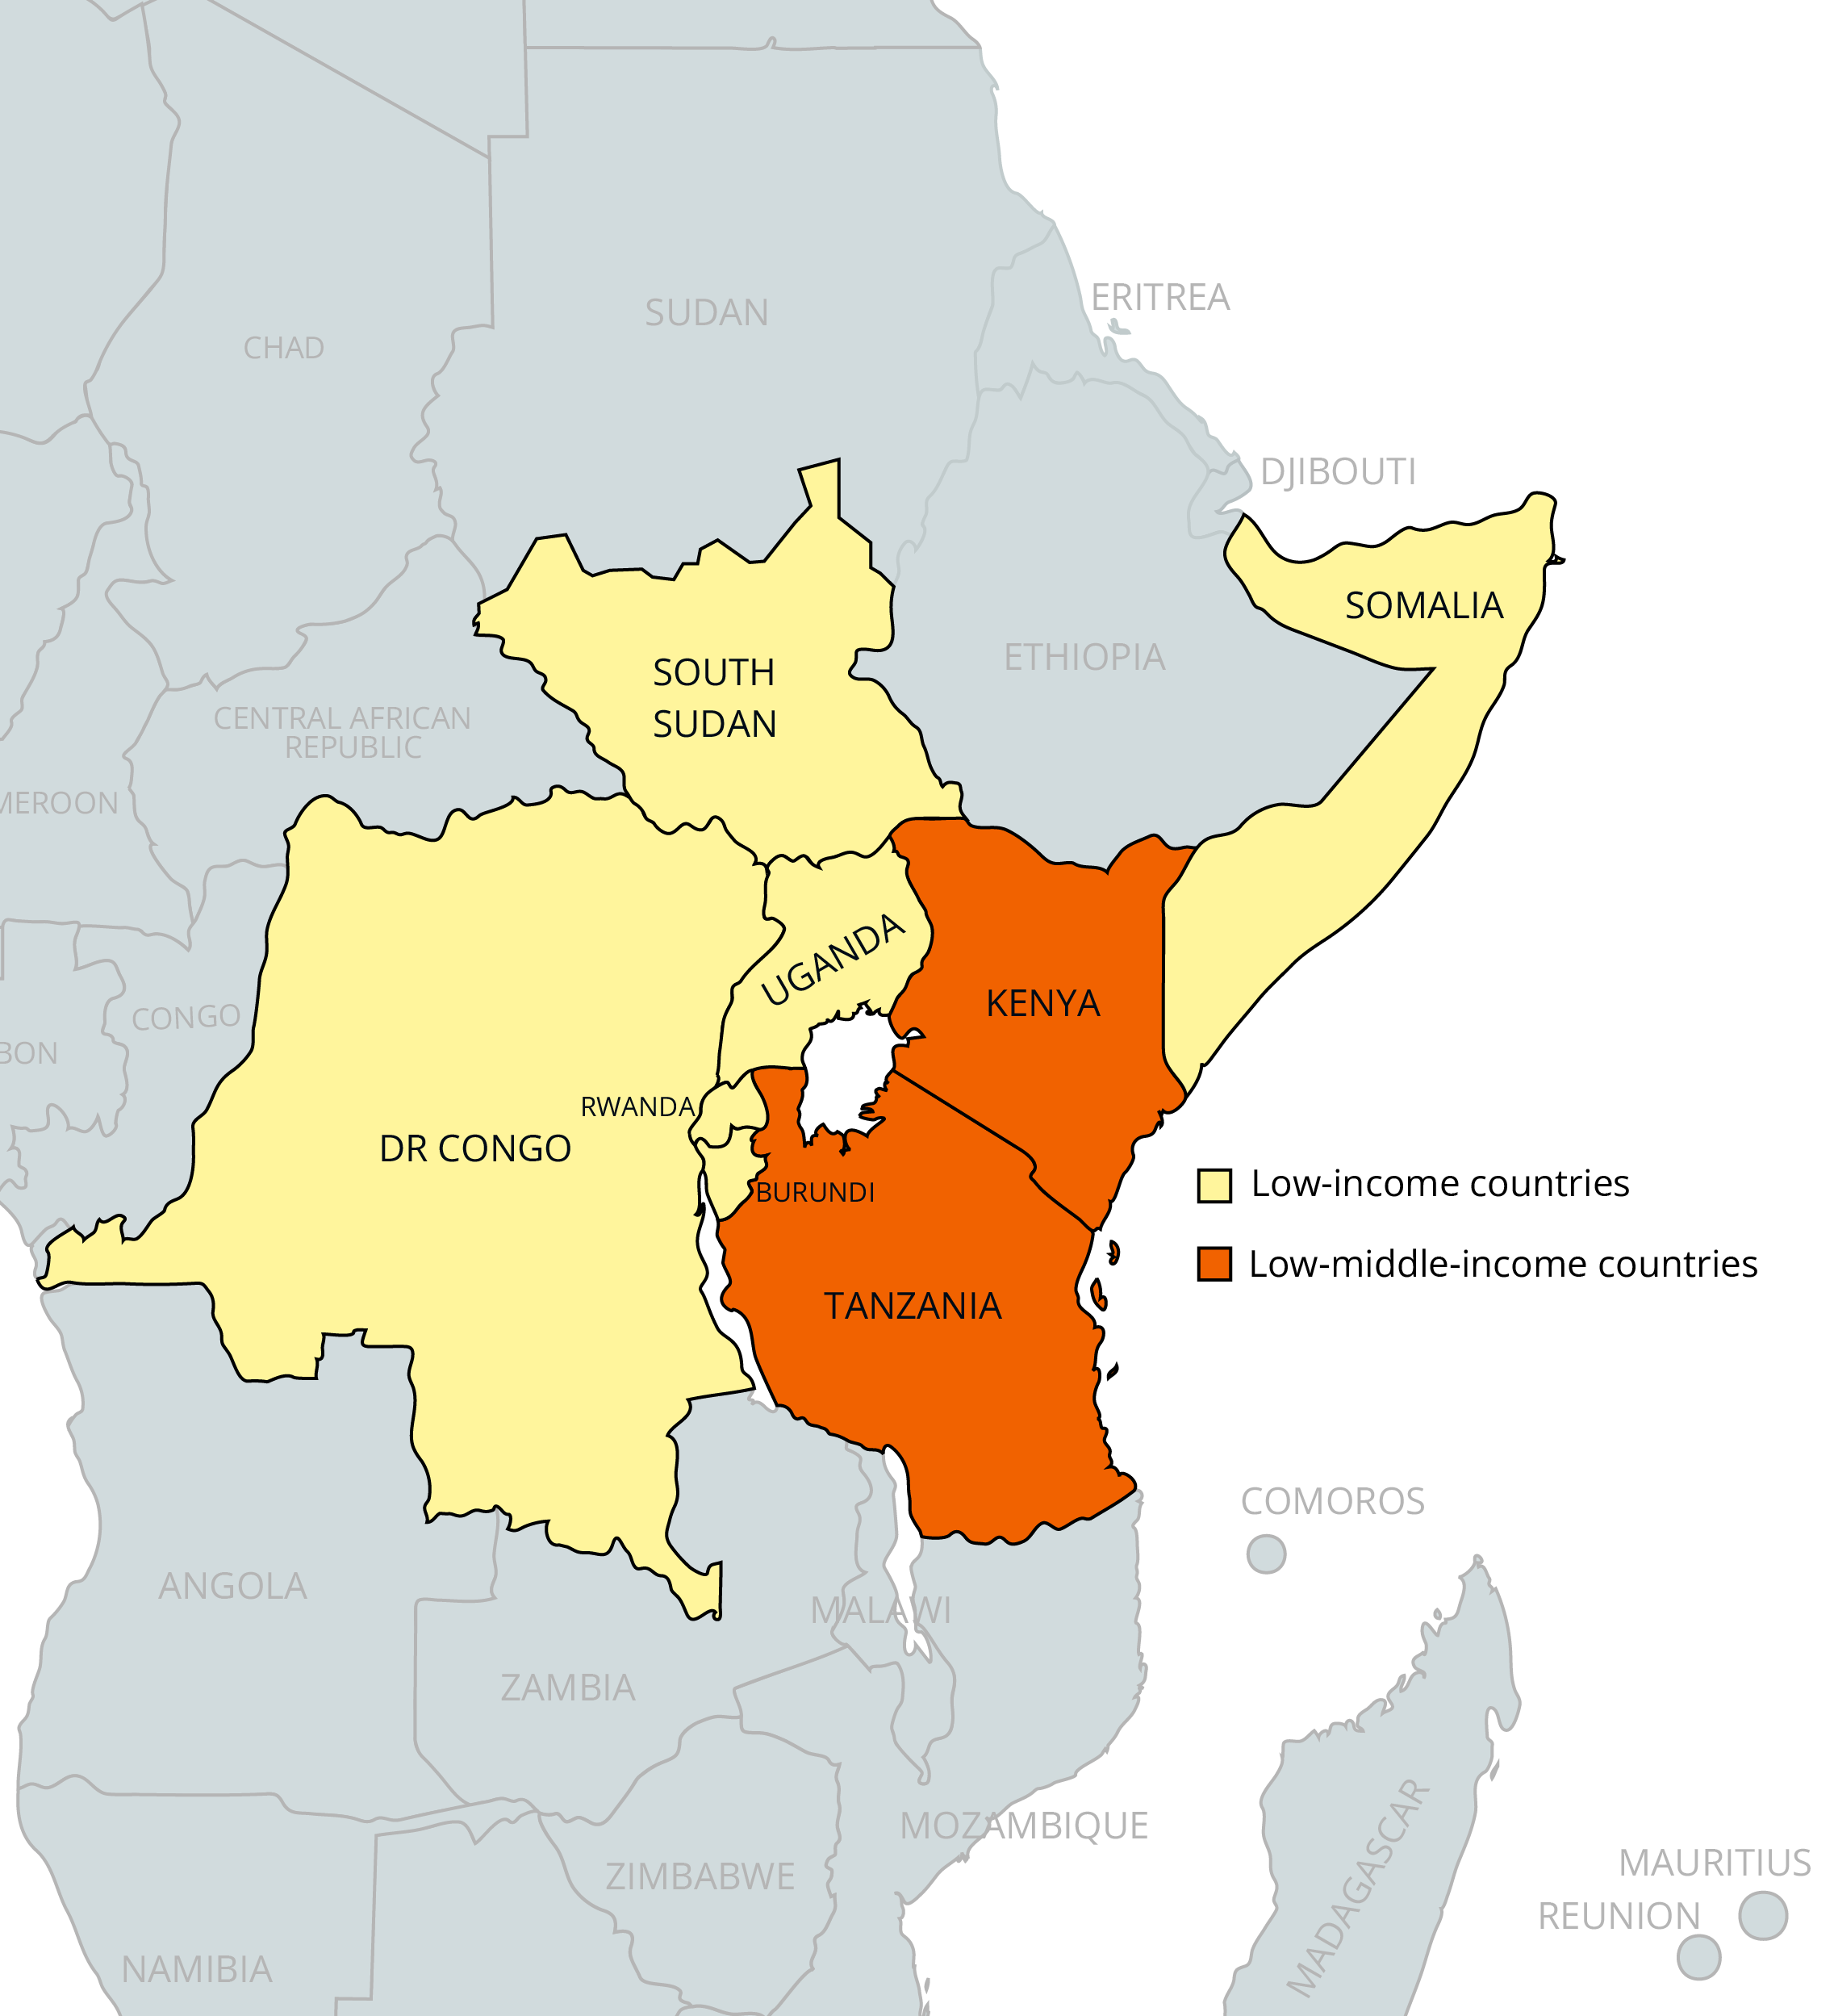
Chart 1 is a political map of the EAC.
The East African Community (EAC) is one of the regional economic community recognised by the African Union comprising eight member states: Burundi, the Democratic Republic of the Congo (DR Congo), Kenya, Rwanda, Somalia, South Sudan, Tanzania and Uganda. The EAC Treaty was signed on 30 November 1999 and came into effect on 7 July 2000 after it was ratified by the three original members: Kenya, Tanzania and Uganda. Rwanda and Burundi acceded to the treaty in June 2007 and became full members in July 2007. South Sudan acceded to the treaty in April 2016 and became a full member in August of the same year. DR Congo acceded to the treaty in April 2022. Somalia is the most recent country to join after depositing its instruments of ratification on the 4 March 2024.
Headquartered in Arusha, Tanzania, the EAC covers a land area of 523 million hectares, has a population of 331 million, and has a combined GDP of US$296 billion in 2023. The region houses a vast amount of minerals, especially in DR Congo, where large deposits of copper and cobalt remain untapped and could be realistic avenues for inward FDI. Furthermore, recent discoveries of natural gas and oil in Kenya, Tanzania and Uganda serve as potential sources of increased energy production and economic development in the region, if managed appropriately.
The EAC’s mission is to ‘widen and deepen economic, political, social and cultural integration in order to improve the quality of life of the people of East Africa through increased competitiveness, value-added production, trade and investments.’ It made significant progress towards regional integration by creating a customs union in 2005, a common market in 2010, and signing a monetary union protocol in 2013. The ultimate aspiration of the REC is to create a political federation, and the first step towards this goal was taken when the EAC Heads of State adopted the political confederation as a transitional model preceding the political federation. Progress towards this goal has stalled, mostly due to the COVID-19 pandemic interrupting the drafting of a constitution for the confederation, a process which only resumed in May 2023. Other problems also restrict progress, with numerous trade disputes leading to repeated border closures between members, while the continuing instability and conflict in the east of DR Congo has caused persistent tension in the REC.
Chart 2 presents the population structure from 1990 to 2050 in the Current Path.
The EAC experienced rapid population growth between 1990 and 2023, as the REC’s population rose from 127.4 million people to 331 million, a 160% increase. The EAC’s total population will rise from 331 million people in 2023 to 647 million people by 2050, which equates to a 69% increase. The rapidly growing population will stem from one source in particular: DR Congo, whose population will grow from 103 million people in 2023 to reach 225 million people by 2050. This is unsurprising, given the country’s high total fertility rate of 5.5 births per woman in 2023. The rate will have decreased by 2050, but will still be high at 4 births per woman, compared to the African average of 2.9 This rapidly growing population in DR Congo will result in a modest increase in income and lead to pressure on social amenities. Somalia had the highest fertility rate in 2023 with 6.7, while Kenya had the lowest rate at 3.4.
Notably, the EAC is expected to have 3 members in the top 20 most populous countries worldwide by 2050: DR Congo at 8th, Tanzania at 14th and Uganda at 20th. Kenya will be close behind in 22nd place.
23% of Africa’s total population resides in the eight member states of the EAC, and this will rise to 25% by 2050. EAC countries will face growing pressure to provide opportunities and services for their ever-expanding populations, which necessitates proactive steps in the short term.
The EAC has a very young population. In 2023, 43% of the population was aged below 15 years, while a further 28% was aged between 15 and 29 years. The large share of young dependents will continue to put pressure on the working-age population throughout the forecast horizon, as those in the youngest age bracket will account for 34% of the population by 2050. Those in the 15 to 29 years age group will keep steady at 28%, but those in the older band, with ages ranging from 30 to 64 years, will take up a larger share, growing from 26% to 34% by 2050. Those aged 65 years and over will constitute nearly 5% of the population by 2050, leading to an increased care burden for younger cohorts past the mid-century point.
When considering the individual population structures of the member states, two countries, Kenya and Rwanda, stand out as being further along their demographic transition towards a more mature population. They were the only countries whose young dependents made up less than 40% of the total population in 2023, and by 2050 will be the only countries whose children will make up less than 30% of their total population. In contrast, DR Congo and Somalia’s populations will remain very youthful, with those aged 15 and younger continuing to make up more than 40% of their total population by 2050.
The age bracket above, those aged between 15 and 29, is another area of interest. As a percentage of the total adult population, all EAC countries had a rate above 25% in 2023. This presents both an opportunity and a problem: on one side, a large share of workers are young and capable of making a significant contribution to the economy, supporting those too young or old to work. On the other, this youth bulge serves as a potential catalyst for instability, should no economic opportunities arise or political exclusion occur for those in this age band. Over the forecast horizon, these rates drop, but not dramatically: again, DR Congo and Somalia face sizeable challenges, with percentages of 29%, while Kenya and South Sudan's rates will be the lowest at 26%.
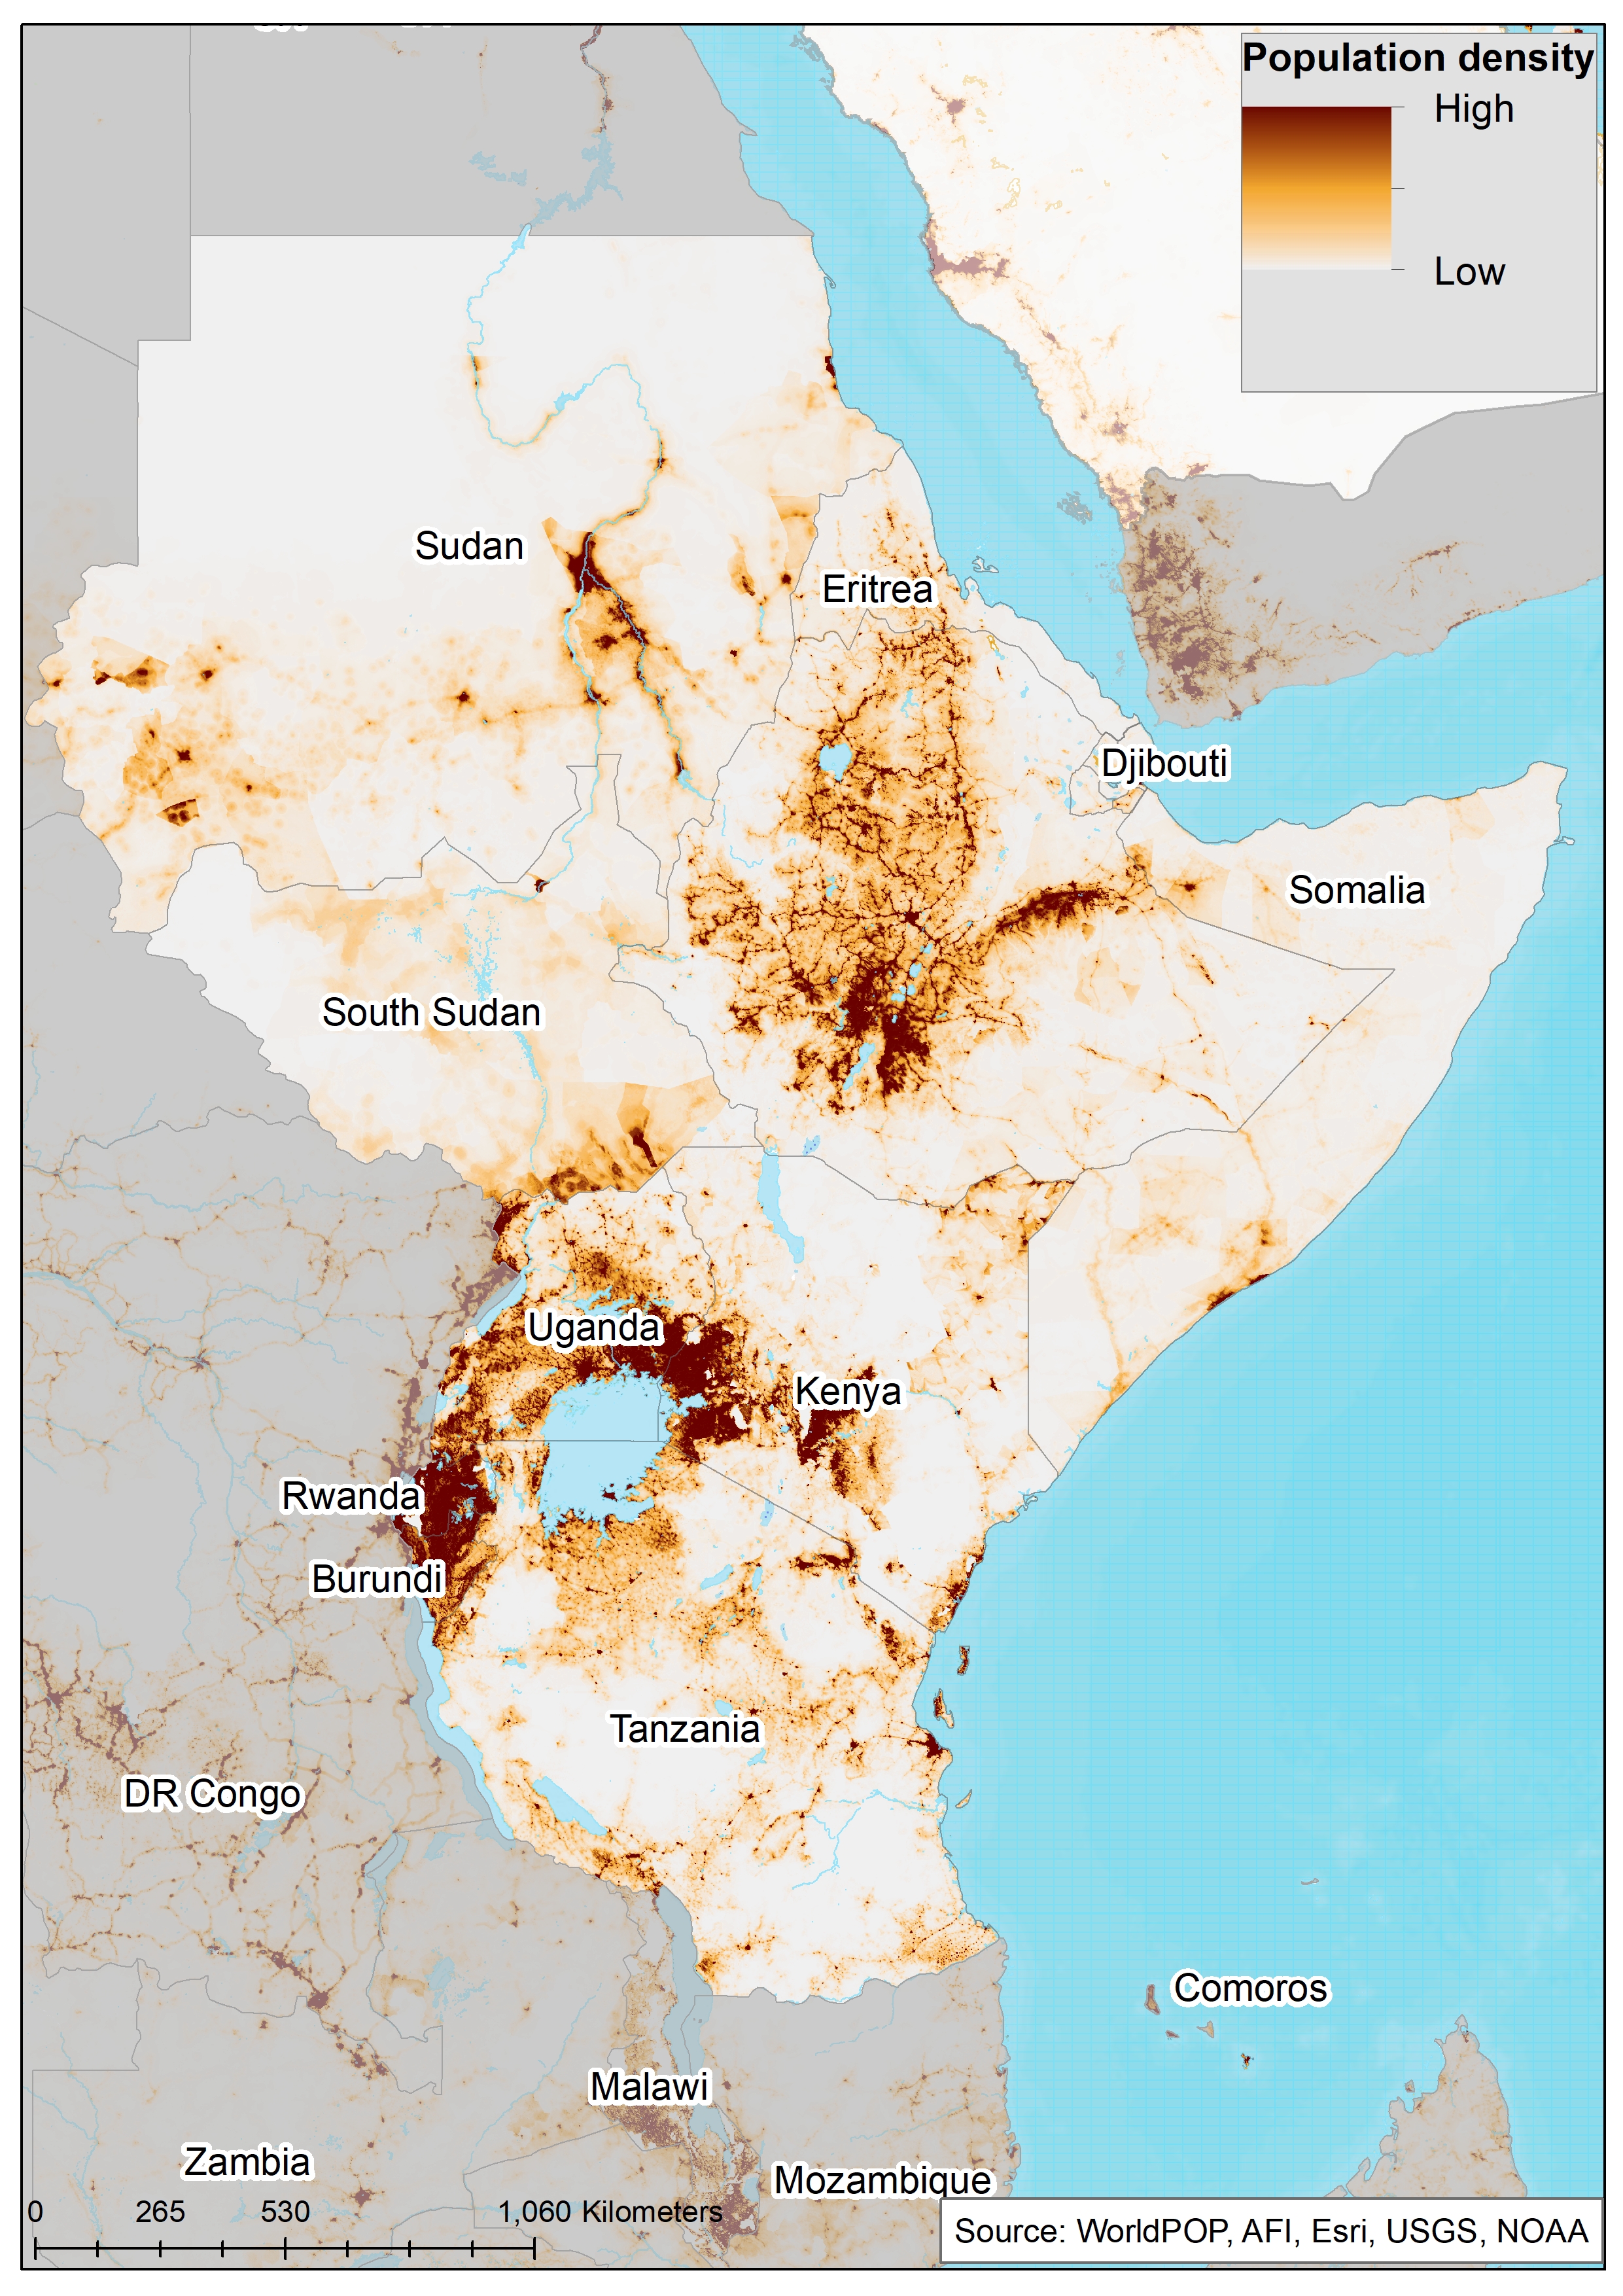
Chart 3 presents a population density map.
The EAC has a mix of heavily and sparsely populated countries. The REC’s average stood at 0.63 people per hectare in 2023, growing to 1.2 by 2050. The group average does however hide the large spread between countries. For instance, Rwanda and Burundi ranked 11th and 14th globally in 2023 for population density and will climb those rankings to 9th and 8th by 2050. South Sudan on the other hand, ranked 167th in 2023, with a population density of 0.17 people per hectare.
The majority of the REC’s population is clustered around and near Lake Victoria, with Uganda, Kenya and Tanzania’s citizens clustering in areas close to the large body of water. DR Congo’s population is also heavily clustered along its eastern border, which it shares with five EAC members, South Sudan, Uganda, Rwanda, Burundi and Tanzania.
The region also plays host to large migration flows: DR Congo, Uganda, Kenya and South Sudan ranked amongst the top 10 migrant destination countries in Africa in 2022, while DR Congo, South Sudan and Somalia were also in the top 10 migrant origin countries. As a result, EAC members play host to a large number of refugees and asylum-seekers, while also serving as the origin of these displaced peoples. Internal displacement, due to disasters or conflict, also fuels the movement of citizens within countries. DR Congo saw over 4 million people displaced internally due to conflict in 2022, while over 5% of South Sudan and Somalia's population was forced to move internally due to a disaster.
The EAC member states have taken a number of steps to align their policies on migration, the most notable being the adoption of the EAC Common Market Protocol, which enables migrants to move freely between member states and face no discrimination as they do so. However, migrants and refugees often face challenges when relocating and settling in their destination country, chiefly due to the lack of resources receiving countries have available to meet their needs. Furthermore, refugees are often placed in camps, which hinder their chances of becoming self-reliant and explore economic and social opportunities which would increase their standard of living and positively contribute to the receiving countries' economy. Increasingly, citizens are driven from their homes due to the effects of climate change, a phenomenon which spurred stats to adopt the Kampala Ministerial Declaration on Migration, Climate Change & Environment. The declaration commits states to strenghten and build systems to counteract the adverse effects of climate change, create urban plans to address population surges due to adverse climate affects and investment in the circular economy and renewable energy, to further mitigate the effects of climate change. Adhering o the provisions of the protocol and further promoting the free movement of people can lead to more jobs, trade and empowerment for those forced to migrate due to climate related disasters, while enabling to also return home and share the knowledge, skills and income they generated.
Contributing to the increasing flow of people between EAC members are the ease with which citizens can gain access to fellow EAC states[1The Visa Openness Index report in 2023 did not include Somalia as a EAC member, as it only joined the REC in early 2024.]. The AFDB’s Visa Openness Index measures the level to which African countries open their border to fellow Africans by granting visa-free, visa-upon-arrival or visa-before-travelling access. Overall, EAC countries perform heterogeneously. In 2023, Rwanda, Burundi, Somalia and Tanzania ranked in the Top 20 for Visa openness, with Rwanda achieving a perfect score due to the country granting visa-free access to all African countries. Conversely, South Sudan and DR Congo score poorly, and rank 50th and 47th, respectively. Free movement within the Community is very high compared to other RECs on the continent. About 71% of citizens of member countries in the community can travel without visa, a reciprocity score that is only behind ECOWAS in Africa.
Chart 4 presents the proportion of the population living in urban and rural areas between 1990 and 2050.
The EAC is predominantly rural, with 64.6% of the total population living in rural areas in 2023.
Rates do however differ enormously between member states, partly down to the various ways in which countries measure what constitutes an urban and rural area. The criteria used to define an urban centre differs widely: some countries use a minimum population threshold, while others have a predefined list of cities and towns. Burundi sees its urban area simply as the “Commune of Bujumbura”.
In 2023, all countries in the Community had more than half of the population residing in rural areas. In fact, five out of eight group members (Burundi, Rwanda, South Sudan, Uganda and Kenya) had more than 70% of their populations living in rural areas. An important factor to consider is the remoteness of the urban centres from the capital city. The more remote, or further away from the capital, these urban centres are, the harder they are to service, requiring more infrastructure and planning by government. DR Congo’s urban population stood at 47% in 2023, but had, on average, the most remote urban centres in Africa, by some distance. This means that majority of its urban and peri-urban centres lack key social amenities and infrastructure that are crucial to modern urban living. Burundi and Rwanda, in contrast, had the highest rural share of the population in 2023, at 86% and 82% respectively, but they ranked 1st and 3rd lowest when considering remoteness of urban centres. In addition, due to their small surface areas, all rural settlements are comparatively closer to more urban settings, potentially helping with service delivery.
Another important phenomenon is the rising informal settlement in urban centres in the region. The EAC houses 2 of the top 3 countries in the world with the highest share of their urban population living in slums.[2UN-Habitat defines living in a slum as lacking access to improved water and improved sanitation, sufficient living area and quality/durability of structure.] South Sudan ranks first in the world, with 94% of urban residents measured as living in slums, while DR Congo ranks third globally with 78%. Uganda and Kenya both rank highly too with more than half of their urban populations living in slums.
On average, urbanisation will increase ove the forecast horizon, but the REC will remain predominantly rural even by 2050, with 51% of the population, 331 million people, projected to live in rural areas. As the REC steadily urbanises, care must be taken to provide for the increasing number of people living in towns and cities. Without adequate housing, sanitation and water infrastructure and access to services such as healthcare, these urban dwellers will live in poor conditions and place strain on urban infrastructure systems. EAC member states must plan for growing urban populations seeking employment and service delivery, and must act proactively to contain increasing levels of people living informally.
The effective provision of security by the state in these new urban areas is also crucial, as non-state armed actors are likely to exploit any deficiencies and promote criminal activity such as drug trading. Ineffective and underresourced governance of informal urban areas can lead to the creation of organised crime networks, which are difficult to identify and remove once established. States must ensure those responsible for governing these constitutenencies are funded in a consistent and sustained manner, and are immune from the turmoil of political changes at higher levels of government. If organized and planned for properly, rapid urbanisation holds multiple benefits for citizens, including better access to services, higher levels of educational attainment, greater wages and overall higher standards of living. National governments can also benefit, as urban centres have lower levels of total fertility, thus leading to a quicker demographic transition and lower levels of dependency. It is thus crucial for states to ensure their cities can accommodate new urban dwellers by providing them with the infrastructure they need and keep them safe too.
Chart 5 presents the size of EAC’s economy (in market exchange rate) from 1990 to 2050 in the Current Path, including the associated growth rate.
The combined economic size of the EAC rose significantly between 1990 and 2023, but will grow even more rapidly until 2050. The region has historically relied on agriculture and mining to drive GDP growth, but the services sector has emerged as the main source of GDP growth and overall GDP amongst EAC members in the last decade or so. Between 2000 and 2010, the shift away from agriculture led to growth in a variety of sectors such as transportation, construction and wholesale trade, all linked to the growing need for services. This demand for services has also been linked to ongoing urbanisation and increasing demand for services linked to the tourism sector such as accommodation, food and entertainment. Natural resources in the form of forests, wildlife, oil, gas and minerals are a cornerstone of the economy, with climate change and rapid population growth severely threatening the region’s natural capital. These challenges threaten the livelihoods of the majority of the region’s inhabitants, as agricultural activities account for 55% of all employment in the REC, with the highest share recorded in Burundi at 85% and the lowest share in Somalia at 27%. Nonetheless, the region has been one of the best performing in Africa, and is forecast to continue on its upwards trajectory in the short term. In 1990, the EAC’s GDP stood at US$87 billion, before expanding by 237% to reach US$293 billion in 2023. On the Current Path, growth will remain high and boost economic output to US$1.5 trillion by 2050.
The EAC is split into two distinct tiers regarding economic size: the first comprises of DR Congo, Kenya, Tanzania and Uganda, while the second includes Burundi, Rwanda, Somalia and South Sudan. The first grouping make up 91% of the total GDP for the EAC, with Kenya having the largest economy in 2023 at US$108 billion. Over the forecast horizon, Kenya will remain the largest economy, but DR Congo, Rwanda and Uganda will grow the quickest. The balance of economic weight in the REC will remain largely unchanged, with Kenya comprising 32% of the EAC’s combined economy in 2050, followed by Tanzania at 24%, DR Congo at 17% and Uganda at 17%. The worst performing country over the forecast horizon will be Somalia, as the country's economy will triple by 2050 to reach US$26 billion.
Chart 6 presents the size of the informal economy as a percentage of GDP and in absolute terms, as well as the per cent of total non-agriculture labour involved in the informal economy, from 2020 to 2050.
The informal economy in the EAC is an important survival mechanism for a large share of the population. Although informal economic activities serve to partially alleviate poverty in a country, the sector remains far less productive than the formal sector and exposes workers to adverse workplace conditions and limited to no benefits. The sector also denies the state of the needed revenue as their activities are hardly taxed due to its unregulated nature Formalising the sector must be the goal for all African economies, notwithstanding the mediating effect it might have on those living in poverty. The EAC has a long way to go to in formalising its informal economy. Informal economic activity in the REC equated to 34% of total GDP in 2023, and will only decline to 27% by 2050. The REC performs considerably worse than Africa, whose average was 26% in 2023, and will decline to 23% by 2050. Another aspect of the informal economy is the size of its labour force, and in this metric the EAC lags behind the continental average too. In 2023, the REC’s informal labour force was equivalent to 72% of the total labour force, while Africa’s was only at 58%. The EAC will see a strong decrease over the forecast horison and reach 58% compared to Africa’s 50% by 2050.
At the country level, three groups emerge within the EAC. The first contains Tanzania and DR Congo, whose informal economies stood at 45% and 42% of GDP in 2023, respectively. The second group contains Burundi, Rwanda, Somalia, South Sudan and Uganda: their values ranged from 37% in Somalia to 32% in Rwanda. The third group is made up of only Kenya, whose informal economy only equated to 22% of GDP in 2023, a significant difference from the rest of its EAC peers[3The figures in IFs uses a method developed by Elgin and Oztunali (2008), and Schneider and Ernste (2012). A more recent study by Murunga et al. (2021), using alternative methods, found the size of the informal economy to be over 32%. Thus, IFs potentially underestimates the size of the sector and its relative importance in Kenya, where 82.9% of total employment occurred in 2022.]. All 8 economies will see their informal sector shrink, but DR Congo will see particularly strong reductions, as its value drops to 35% by 2050, a 9 percentage point reduction. Tanzania’s informal economy will still amount to 36% of total GDP, while Kenya will dip below 18% by 2050.
The informal labour force tells a somewhat different story: Uganda and DR Congo have a large number of informal labourers, equating to 85% and 84% of the total labour force in 2023. Again, DR Congo will see a sharp decline, reaching a a value of 59% by 2050, whereas Uganda will still have an informal labour force equivalent to 73% of the total labour force at that stage.
Chart 7 depicts GDP per capita in the Current Path from 1990 to 2050.
The members of the EAC have consistently been amongst the worst-performing countries in Africa in terms of GDP per capita since 1990. The REC has thus been underperforming compared to Africa’s average but will make gains over the forecast horizon. In 1990, the EAC’s GDP per capita stood at 46% of Africa’s average, improving slightly to 47% by 2023 at US$2 200. By 2050 however, the EAC’s GDP per capita will equate to 64% of Africa’s average income, showing strong growth over the forecast horizon.
The EAC has three levels when comparing GDP per capita between members. The top level is occupied by Kenya, which ranks first with US$4.8K in 2023, 85% higher than Tanzania in second place. The second level is made up of Tanzania, Uganda and Rwanda, whose GDP per capita ranged from US$2.6k for Tanzania to US$2.3k for Uganda in 2023. The lowest level comprises South Sudan, Somalia, DR Congo and Burundi. The lowest GDP per capita in 2023 was that of Burundi at US$0.7K, with South Sudan the highest in that group at US$1.4K. Three of these countries, South Sudan, Somalia and DR Congo, continue to grapple with the adverse effects of internal conflicts, while Burundi has a history of political instability and civil unrest, coupled with widespread corruption, that hinder economic growth. In fact, Burundi had the lowest GDP per capita in Africa in 2023, while DR Congo and Somalia ranked third and fourth from the bottom, respectively. In the case of DR Congo, the country’s large and rapidly growing population acts as a drag on GDP per capita growth, with economic growth translating to smaller gains at per capita levels. The growth prospects of these countries are constrained, as by 2050 Burundi and Somalia will still be ranked second and third worst, while DR Congo will have only climbed to 5th lowest out of 54 African countries.
Chart 8 presents extreme poverty as per cent and total numbers of the population for the Current Path, from 2020 to 2050.
In 2015, the World Bank adopted US$1.90 per person per day (in 2011 prices using GNI), also used to measure progress towards achieving Sustainable Development Goal (SDG) 1 of eradicating extreme poverty. In 2022, the World Bank updated the poverty lines to 2017 constant dollar values as follows:
- The previous US$1.90 extreme poverty line is now set at US$2.15, also for use with low-income countries.
- US$3.20 for lower-middle-income countries, now US$3.65 in 2017 values.
- US$5.50 for upper-middle-income countries, now US$6.85 in 2017 values.
- US$22.70 for high-income countries. The Bank has not yet announced the new poverty line in 2017 US$ prices for high-income countries.
Monetary poverty only tells part of the story, however. In addition, the global Multidimensional Poverty Index (MPI) measures acute multidimensional poverty by measuring each person’s overlapping deprivations across 10 indicators in three equally weighted dimensions: health, education and standard of living. The MPI complements the international $2.15 a day poverty rate by identifying who is multidimensionally poor and also shows the composition of multidimensional poverty. The headcount or incidence of multidimensional poverty is often several percentage points higher than that of monetary poverty. This implies that individuals living above the monetary poverty line may still suffer deprivations in health, education and/or standard of living.
Compared to the average poverty rate in Africa, at the US$2.15 poverty line, the EAC performs poorly. In 2023, the REC’s poverty rate of 45% was 15 percentage points above the average for Africa. The EAC will catch up, and by 2050, only 15% of the population will live below the US$2.15 poverty line, compared to 13% for Africa. The reduction in absolute terms equates to 54 million fewer people living in extreme poverty by 2050, resulting in the extremely poor population falling to 96 million people.
The individual members of the EAC have had divergent patterns of extreme poverty since 1981, driven in large part by persistent conflict in the area, since 1994 when the Rwandan genocide took place. What followed was years of unrest and conflict in the eastern DR Congo, with Rwanda, Burundi, Uganda involved. The effects of the conflict are clear to see when looking at historical poverty rates: between 1987 and 2002, DR Congo’s poverty rate climbed from 55% to 93%, while Rwanda and Burundi also saw large increases during the 1990s as a result of civil war. Both these countries recovered somewhat through the 2000s and early 2010s, but Burundi suffered significant setbacks in 2015, as foreign investors withdrew from the country amid riots and violence brought on by a political crisis.
In some lesser form, the initial conflict of the 1990s still persists to this day, but poverty rates across the REC have been declining since the early 2000’s, coming from a very high base in the late 1990’s. The decline can be largely attributed to greater stability, even with intermittent flare ups in certain areas of the region. South Sudan stands as an obvious contradiction. Due to the civil war, which started two years after it declared independence from Sudan in 2011, extreme poverty rose sharply from 47% in 2011 to 71% in 2020, before again tapering off to 33% by 2023.
All member countries will see their poverty rates decrease considerably over the forecast horizon. The country with the lowest poverty rate in 2023 at the US$2.15 level, Kenya, will still maintain that position by 2050, with a poverty rate of 10%. The country’s relative stability compared to its neighbours, which has been improving since 2009, and position as central trade hub for the region, has led to steady reductions in extreme poverty levels in the last two decades. In contrast, Burundi will remain the most impoverished country in the REC, with a poverty rate of 34% by 2050, coming from the highest rate in the EAC of 72% in 2023. Taking into account different income levels and their corresponding poverty lines, Rwanda will have the lowest povery rate by 2050, with 6.2% at US$2.15. Tanzania, at the US$3.65 poverty line, will have the highest rate at 28.7%.
Chart 9 shows the Regional Development Plan for the EAC.
The EAC overarching development plan is termed Vision 2050, which is implemented through medium term development strategies that renew every 5 years. The Vision 2050 document main aim is to make the EAC an “upper – middle income region within a secure and politically united East Africa based on the principles of inclusiveness and accountability”, and stipulates a host of targets the REC aims to achieve by 2050, ranging from poverty reduction, to economic growth, infant mortality and adult literacy rates. The document was however drawn up before the inclusion of DR Congo, Somalia and South Sudan, so performance measured against these goals will naturally be skewed by the new entrants.
For example, the original five members, Burundi, Rwanda, Uganda, Tanzania and Kenya, are on course to have an average poverty of 14% by 2050, measured at the US$1.25 poverty line mentioned in the Vision 2050 document. The current EAC, with DR Congo, Somalia and South Sudan added in, will reach a rate of 21% by 2050, 7 percentage points worse. The Vision 2050 goal is for poverty to have decreased to 5% by 2050, a mark the EAC is likely to miss.
The current strategy, the 6th of its kind, stretches from 2021/22 to 2025/26 and outlines multiple focus areas and goals the REC aims to achieve in that time. The main points of focus of the strategy are:
- Infrastructure development
- Human capital for long-term skills development
- Consolidation of the EAC Common Market
- Funding of regional initiatives
- Strengthening the financing and banking systems
- Expanding savings and investment
- Research and Development
- Security and governance
The strategy also emphasises the need for member states to adopt the goals of the region into their own Medium Term Plans, together with those captured in the AU Agenda 2063 and UN Sustainable Development Goals documents. A key focus area for this strategy in particular is the promotion of the REC’s COVID-19 recovery plan.
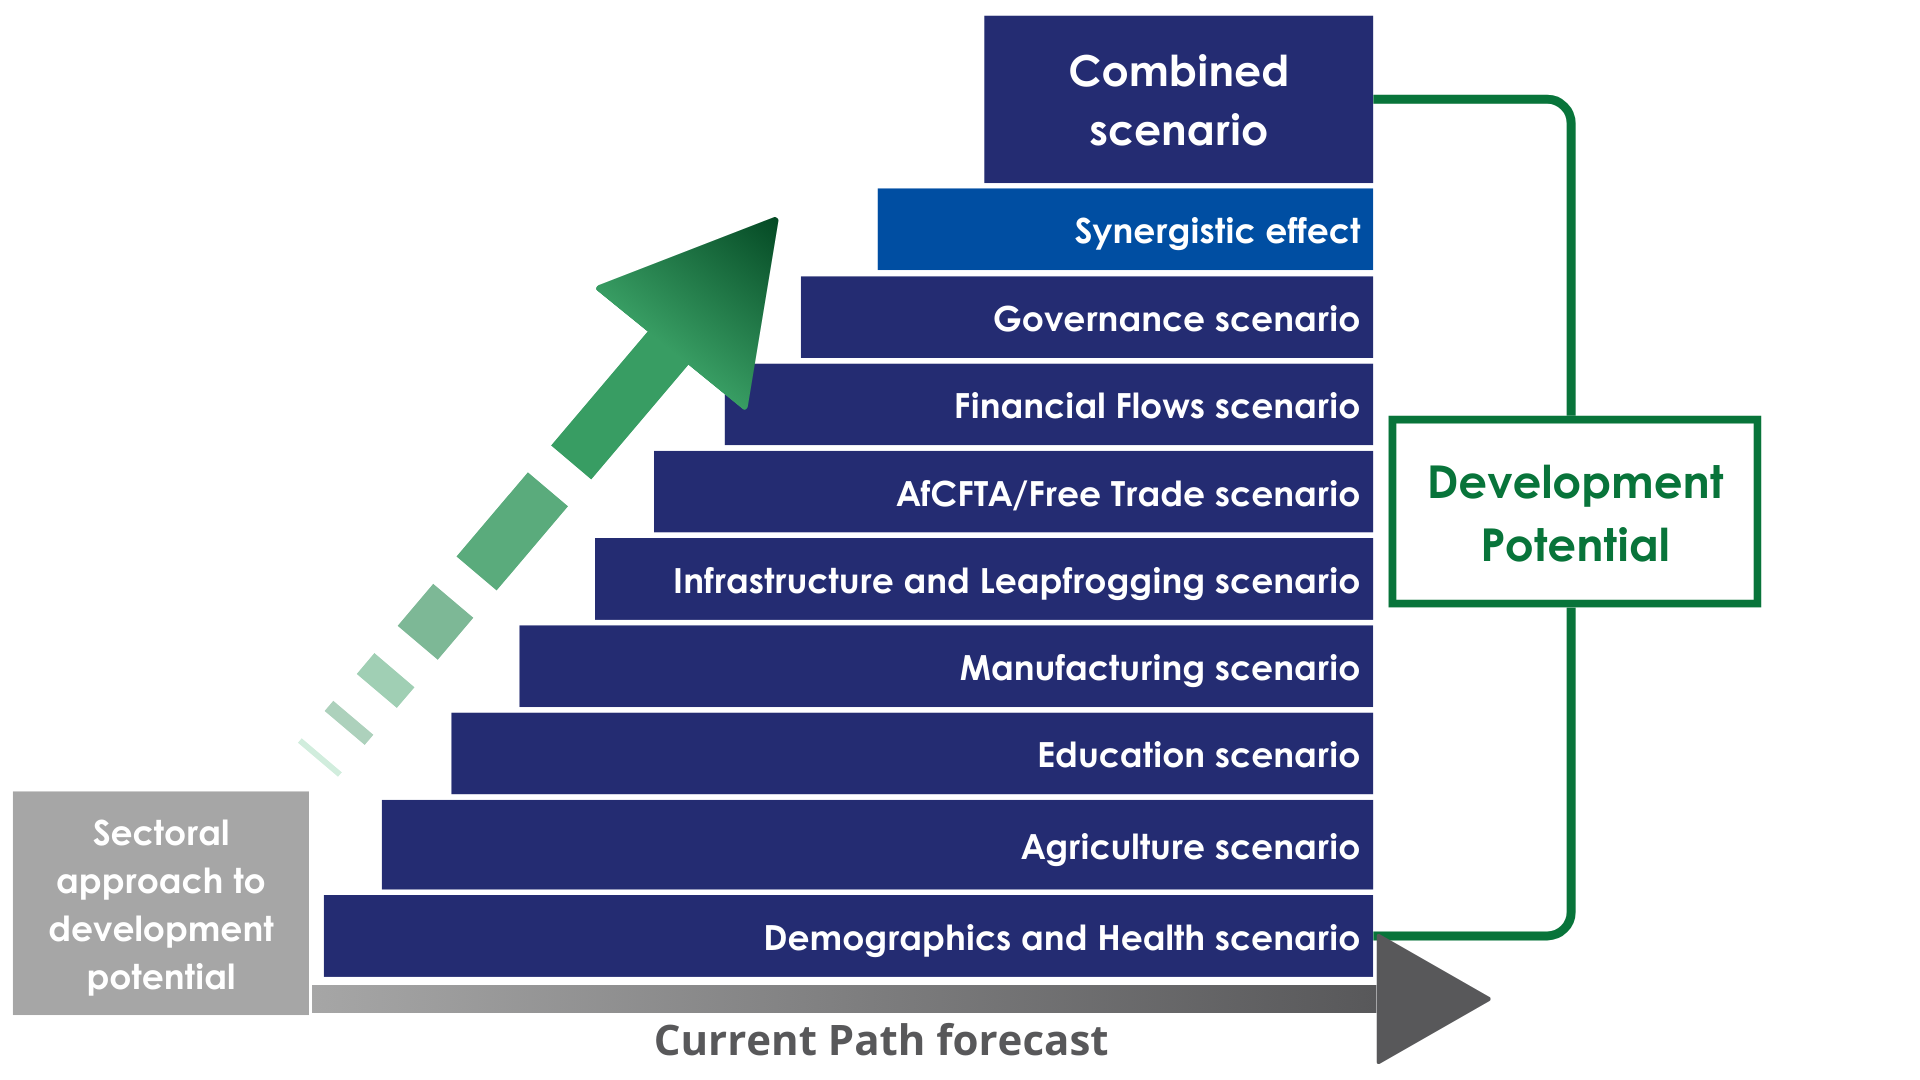
The eight sectoral scenarios as well as their relationship to the Current Path and the Combined scenario are explained in the Technical Page. Chart 10 summarises the approach.
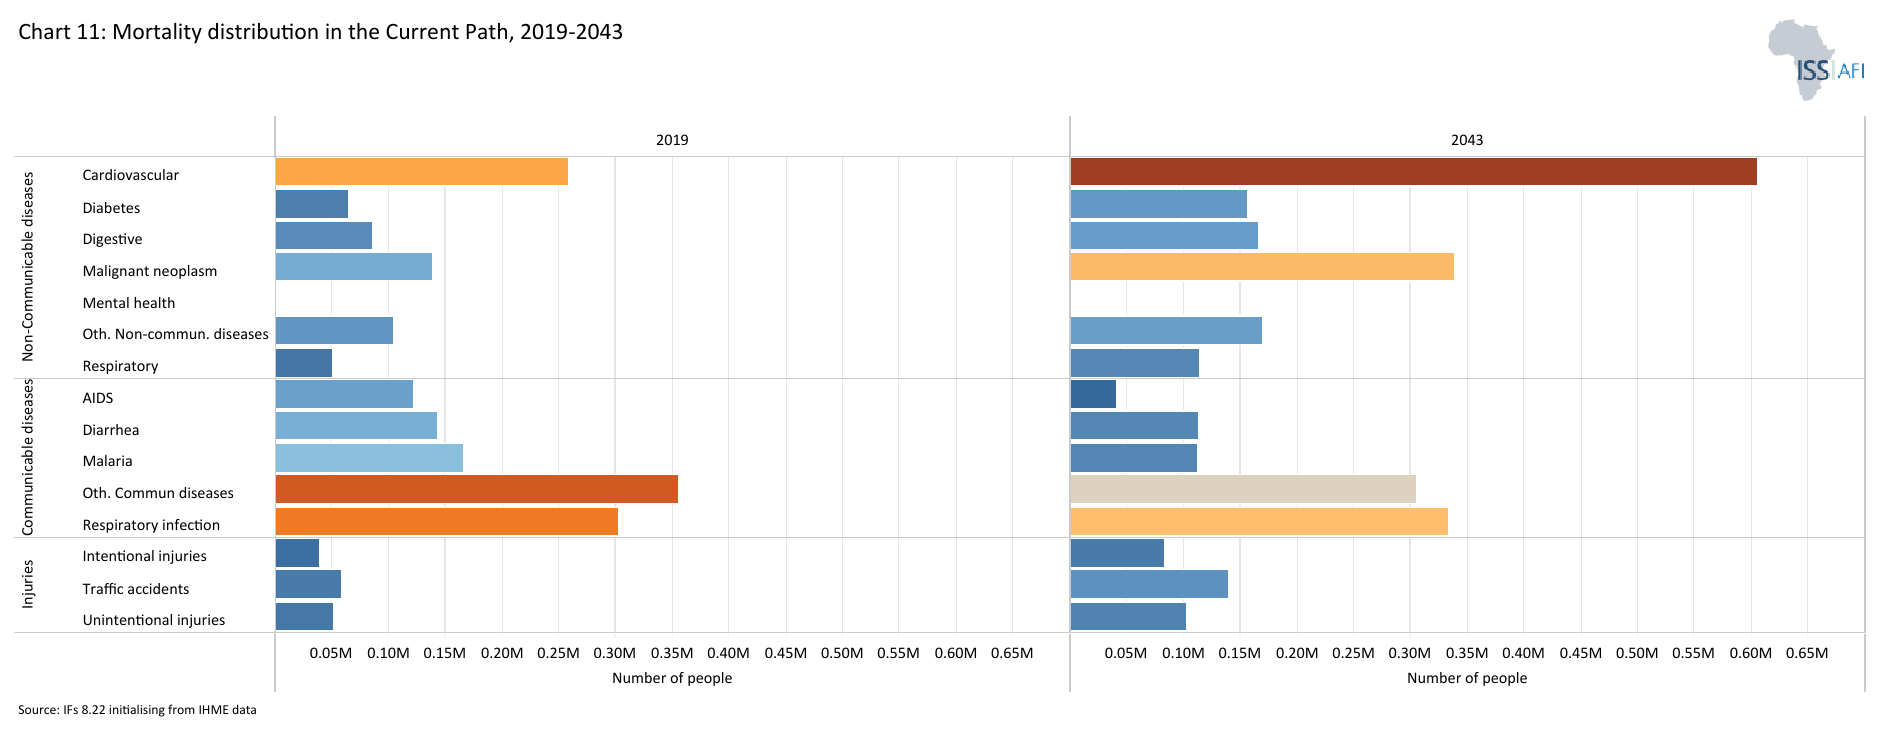
Chart 11 presents the mortality distribution in 2020 and 2050.
The Demographics and Health scenario envisions ambitious improvements in child and maternal mortality rates, enhanced access to modern contraception, and decreased mortality from communicable diseases (e.g., AIDS, diarrhoea, malaria, respiratory infections) and non-communicable diseases (e.g., diabetes), alongside advancements in safe water access and sanitation. This scenario assumes a swift demographic transition supported by heightened investments in health and water, sanitation, and hygiene (WaSH) infrastructure.
Visit the themes on Demographics and Health/WaSH for more detail on the scenario structure and interventions.
Generally, the main causes of death within a country slowly shift in line with its level of expenditure on healthcare, changing age distribution of the population and increased food security, transitioning from those illnesses which more easily affect children to those who plague the elderly. As populations age, the prevalence of communicable diseases, which are relatively cheaper, declines and the burden of non-communicable diseases, often linked to lifestyle choices such as diet or smoking habit, increases. In addition, a lack of basic sanitation and water infrastructure in some member states mean infants and children are more likely to contract communicable diseases. EAC member countries are at different stages of this epidemiological transition, which is also affected by the level of WaSH infrastructure available to the population. African states in general are in the unique position where the non-communicable disease burden is rising at lower levels of income than in other countries globally.
In 2023, communicable diseases accounted for 53% of all deaths in the EAC, but the EAC will undergo its epidemiological transition in 2031 when non-communicable diseases overtake communicable diseases as the leading cause of death in the region. Due to the nature of these diseases, and the high costs involved, countries will struggle to combat the dual burden of communicable and non-communicable diseases. By 2050, non-communicable diseases will account for 61% of all deaths, highlighting the need for immediate investment in healthcare services to be prepared for the coming stress these diseases will have on health systems. The leading causes of death in 2050 will be cardiovascular diseases, malignant neoplasms, respiratory infections and other-communicables diseases (excluding respiratory infections, AIDS, diarrhea and malaria).
Across the EAC, only Rwanda has undergone this transition already. Somalia will be the sole country that does not experience a transition over the forecast horizon at all. Multiple countries in the Horn of Africa region, such as Somalia and Ethiopia, are burdened with severe food insecurity, which leads to large-scale displacement that heightens the risk of infectious diseases spreading through the region. As the population becomes less nourished, they become more susceptible to disease, requiring additional treatments and care, for which governments are ill-prepared. The recent flooding in 2024 also spread water-borne diseases such as cholera and dengue fever in the area, leading to added costs and stress for EAC members’ healthcare systems.
Improved access to water and sanitation is an important way to combat communicable diseases. The EAC lags behind the rest of Africa's access rate to both improved water and sanitation: in 2023, 73% of the REC’s population had access to improved water, 9 percentage points below the African average. Access to improved sanitation was far lower, standing at 30% in 2023 compared to Africa’s rate of 43%. On both measures the EAC narrows the gap to the continental average over the forecast period, but fails to fully catch up. Individual countries perform very differently: Rwanda had the highest rates for access to improved water and sanitation in 2023 at 71% and 84%, respectively. Burundi and Rwanda are the only countries whose rates outperformed Africa’s average in 2023 with access to improved sanitation, while Burundi, Rwanda, Somalia and Uganda scored higher than continental average in access to improved water. Access rates will only improve slowly in the Current Path, especially in access to improved sanitation. By 2050, only Kenya and Rwanda will exceed Africa’s average of 73% in access for improved sanitation. Increased investment in improved sanitation is a clear priority, particularly as better WaSH infrastructure aides in the fight against communicable diseases.
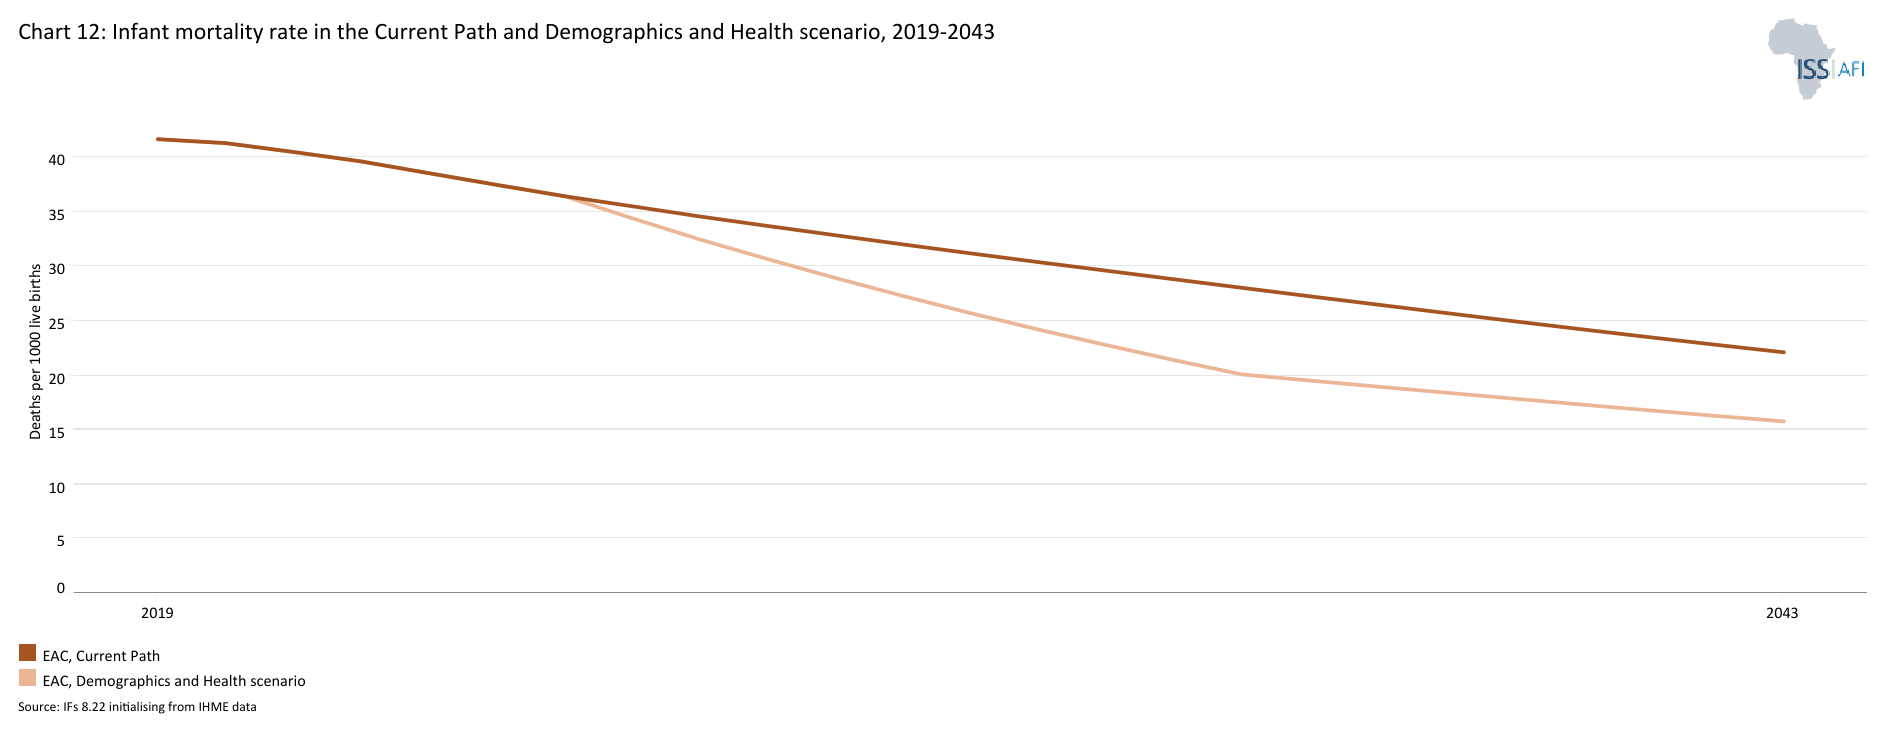
Chart 12 depicts the infant mortality rate in the Current Path versus the Demographics and Health scenario, from 2020-2050.
In this scenario, we assume a more rapid demographic transition and increased investments in better health and water, sanitation and hygiene (WaSH) infrastructure.
The infant mortality rate is the probability of a child born in a specific year dying before reaching the age of one. It measures the child-born survival rate and reflects the social, economic and environmental conditions in which children live, including their health care. It is measured as the number of infant deaths per 1 000 live births and is an important marker of the overall quality of the health system in a country.
Rates of infant mortality in the EAC in 2023 were at 39.5 deaths per 1 000 live births and will reduce to 17.9 in the Current Path by 2050. In the Demographics and Health scenario, the average by 2050 will be 12.7 deaths, 5.2 fewer compared to the Current Path and 9.6 fewer deaths compared to the Current Path average for Africa in the same year. The REC recovers to reach levels akin to the World except Africa grouping in the scenario by 2050, significantly reducing the gap to the Rest of the World from 19.6 in 2023 to 3.2 deaths per 1000 live births by 2050.
South Sudan and Somalia were in much worse positions compared to the rest of the REC’s members. In 2023, they had infant mortality rates of 62.1 and 56.5 respectively, where the next worst country, Burundi, had a rate of 47. Both see significant reductions in the scenario and see reductions of 8 deaths per 1000 live births compared to the Current Path by 2050. In contrast, Kenya and Rwanda see lesser reductions, but they have both seen positive downward trajectories for some time, especially Rwanda. The rapid improvements in Rwanda is mainly due to the drastic change brought about the central government following the genocide in 1994, pivoting to universal health coverage provided by the state and international funders. A much greater emphasis was placed on primary health care and bringing services closer to the largely rural population. From a high of 94.3 in 1996, Rwanda has seen a dramatic drop to 30 by 2023, only 1.4 deaths above Kenya. By 2050 in the scenario, Rwanda will have the lowest rate in the REC, at 7.9, followed by 10.1 for Kenya and 11.7 for DR Congo.
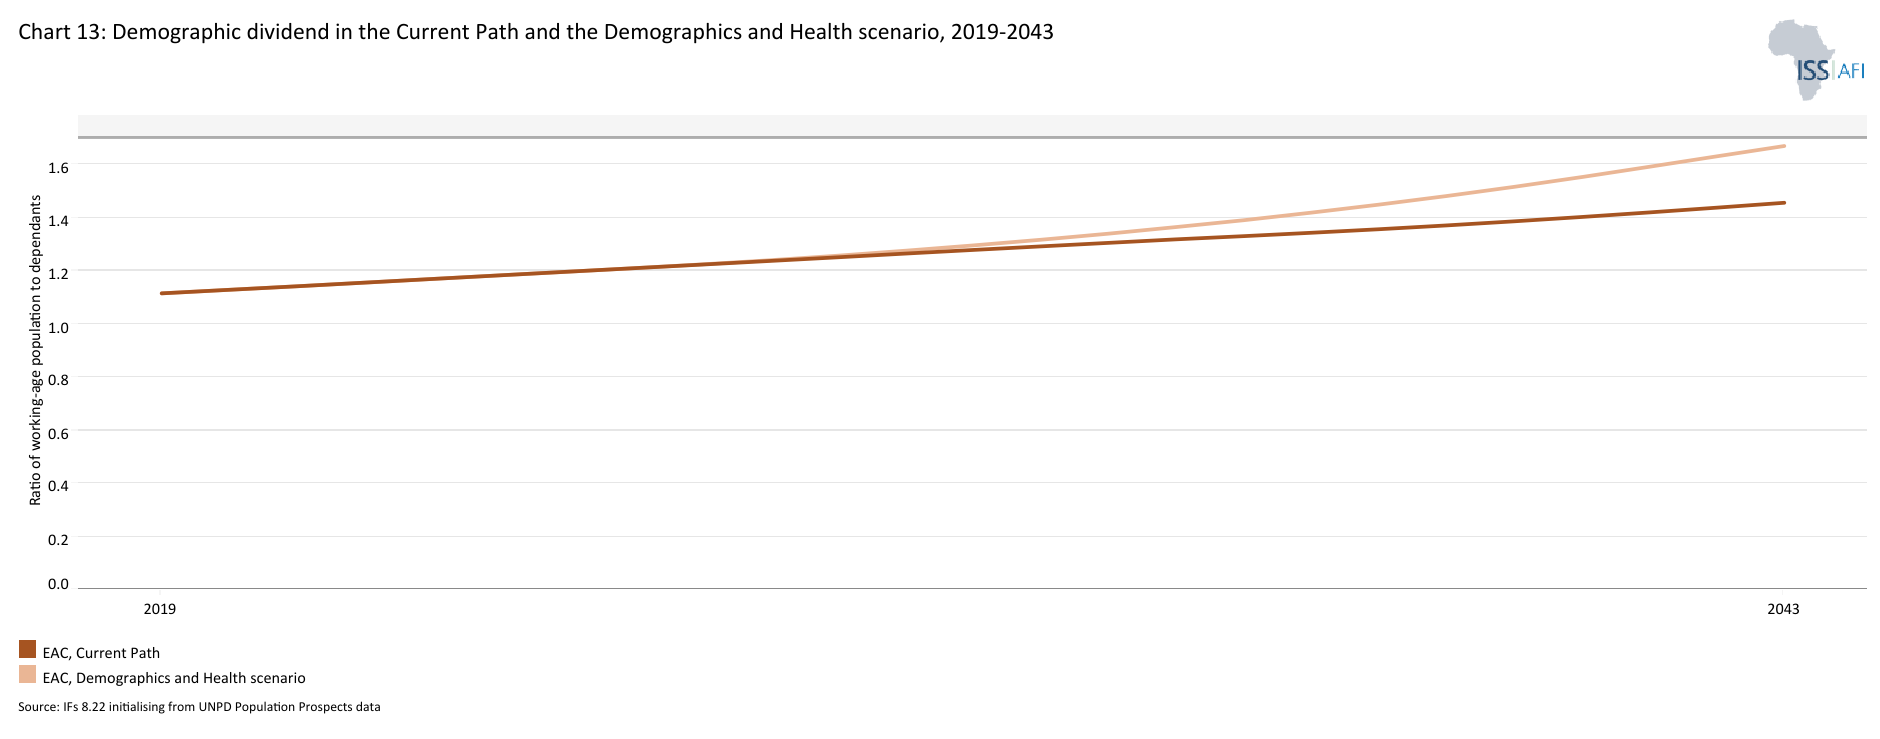
Chart 13 presents the demographic dividend in the Current Path compared to the Demographics and Health scenario, from 2020 to 2050.
Demographers typically differentiate between a first, second and even a third demographic dividend. We focus here on the contribution of the size of the labour force (between 15 and 64 years of age) relative to dependants (children and the elderly) as part of the first dividend. A window of opportunity opens when the ratio of the working-age population to dependents is equal to or surpasses 1.7.
In 2023, the ratio of working-age persons to dependants for the EAC was 1.17 to 1, well below the average of 1.31 to 1 for Africa. It means that for every dependant in the region, there are about 1.2 workers. In the Current Path, the EAC enters the demographic dividend in 2053, given its large population momentum and its high fertility rates, and reflecting the very low median age in the REC. In the Demographics and Health scenario, the EAC reaches a ratio of 1.7 working-age persons to every dependant in 2043, 8 years earlier than Africa on its Current Path.
Kenya (in 2032) and Rwanda (in 2035) are the only countries set to enjoy a demographic dividend in the Current Path before 2043. The scenario has two effects on the demographic dividend: it shortens the amount of time it will take for countries to reach a ratio of 1.7, and heightens the peak of this ratio above the Current Path.
Compared to the Current Path, two countries, Uganda and Tanzania, will reach their demographic dividend within the forecast cast horizon, in 2040 and 2043, respectively. DR Congo will also reach the ratio of 1.7 twelve years earlier, in 2049 instead of 2061. Kenya on the other hand will see its ratio grow the most, reaching a ratio of 2.5 by 2050 compared to 2.1 in the Current Path. Somalia will see the least impact, with its ratio only growing by 0.13 by 2050.
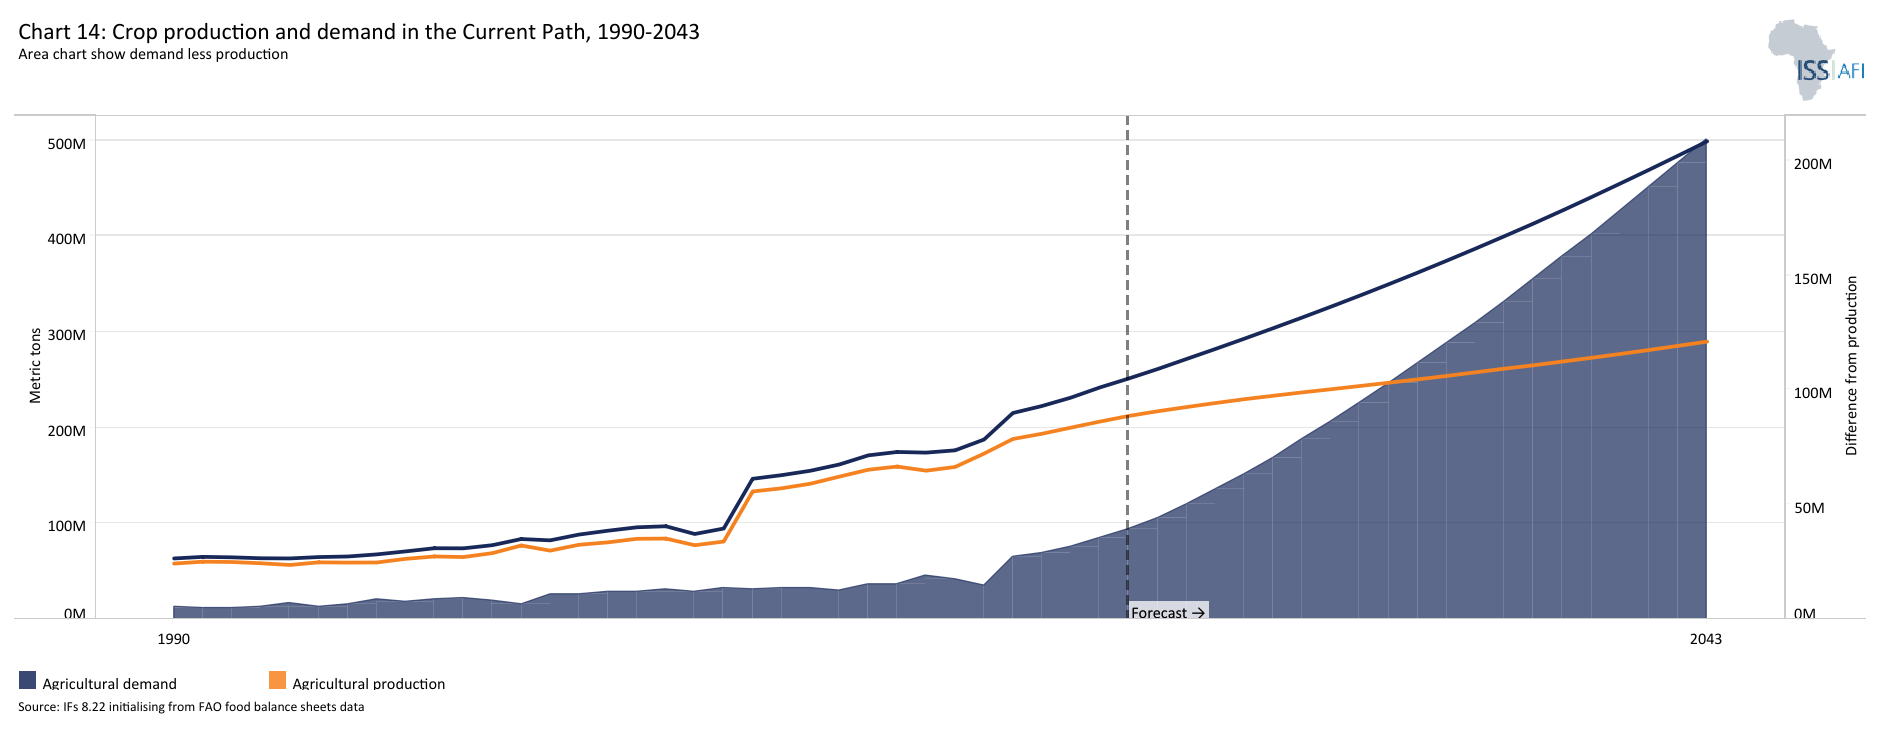
Chart 14 shows the crop production and demand from 1990 to 2050.
The Agriculture scenario envisions an agricultural revolution that ensures food security through ambitious yet feasible increases in yields per hectare, thanks to improved management, seed, fertiliser technology, and expanded irrigation and equipped land. Efforts to reduce food loss and waste are emphasised, with increased calorie consumption as an indicator of self-sufficiency and prioritising it over food exports. Additionally, enhanced forest protection signifies a commitment to sustainable land use practices.
Visit the theme on Agriculture for our conceptualisation and details on the scenario structure and interventions.
The agriculture sector in EAC faces a series of challenges that complicate this situation:
- Technology-related factors
- Inadequate research, extension services and training
- Prevalence of pests and diseases
- Nature-related factors
- Degradation of natural resources
- Climatic and weather unpredictability
- Cross-cutting and cross-sectoral related factors
- High incidence of poverty
- Inadequate social infrastructure
- Gender inequality
EAC member states produce a large variety of crops, the main types being maize, rice, potatoes, bananas, cassava, beans, vegetables, sugar, wheat, sorghum, millet and pulses. The region also produces cash crops which are tea, cotton, coffee, pyrethrum, sugar cane, sisal, horticultural crops, oil-crops, cloves, tobacco, coconut and cashew nuts. However, East Africa, and the Greater Horn of Africa region in particular, has been experiencing a severe drought since 2020, leading to crop losses, livestock deaths, and severe water and food insecurity. The severity of the drought has been amplified by climate change, leading to a much longer dry spell. In a region where most farmers depend on rainfall for their crops, this has been devastating for the local population, causing an estimated 20 million people to be food insecure and the death of at least 8 million farm animals. As of April 2024, 10.8 million children were assessed as being malnourished by the Integrated Food Security Phase Classification (IPC) initiative, while 27.8 million people were assessed as food insecure and in need of assistance in Somalia, South Sudan, Kenya, Uganda and Ethiopia. At the same time, parts of the region experienced unseasonal rainfall, leading to widespread flooding that further hampered agricultural activities as people were forced to leave their homes in search of safe living conditions.
These adverse weather conditions have further entrenched the EAC’s food insecure status. Since 1990, the REC has failed to meet agricultural demand, with the shortfall growing from 5.3 million metric tons in 1990 to 39.1 million metric tons in 2023. These shortages in agricultural production will worsen considerably over the forecast horizon. By 2050, the REC’s deficit will balloon to 223 million tons. At the country level, only South Sudan produced enough food in 2023 for its population, but all 8 member states will have significant shortfalls by 2050. Somalia will fare the worst, with agricultural production falling 66% below demand by 2050, followed by Uganda at 47%. South Sudan will have the smallest shortfall at 26%.
Failing to compensate for the shortfall through increased imports and drastically improved yields per hectare will worsen an already troubling food security situation over the medium term. Furthermore, agricultural activity is a key source of employment for the EAC. In 2022, 56% of the REC’s labour force was employed in the agriculture sector. The worsening weather conditions threaten the livelihoods of these workers and will worsen poverty in the region as smallholder farmers struggle to earn a living. At a country level, Burundi has the highest share of workers working in the sector, at 85%, with the percentage rising to 92% when considering the female labour force only. In all 8 countries, women working in agriculture make up a larger share of the total female labour force than the male equivalent. Thus, underperformance in the agriculture sector is not only a threat to food security but will also worsen gender inequality in the EAC. South Sudan, for example, has a female labour force where 74% of women earn their living in agriculture, whereas male farmers make up only 47% of the total male labour force. At the REC level, 62% of female labourers are employed in agriculture, compared to 50% of male labourers.
Implementing strategies and frameworks developed at the REC level will be key for member states in addressing these issues. One such strategy is the EAC Food and Nutritution Security Action Plan, which emphasises the need for member states to better implement regional objectives at the national level, harmonisation between regional and national development plans and the Action Plan’s goals, better monitoring and evaluation frameworks to track progress, and increasing the capacity of the EAC’s own Department of Agriculture and Food Security to better serves EAC members.
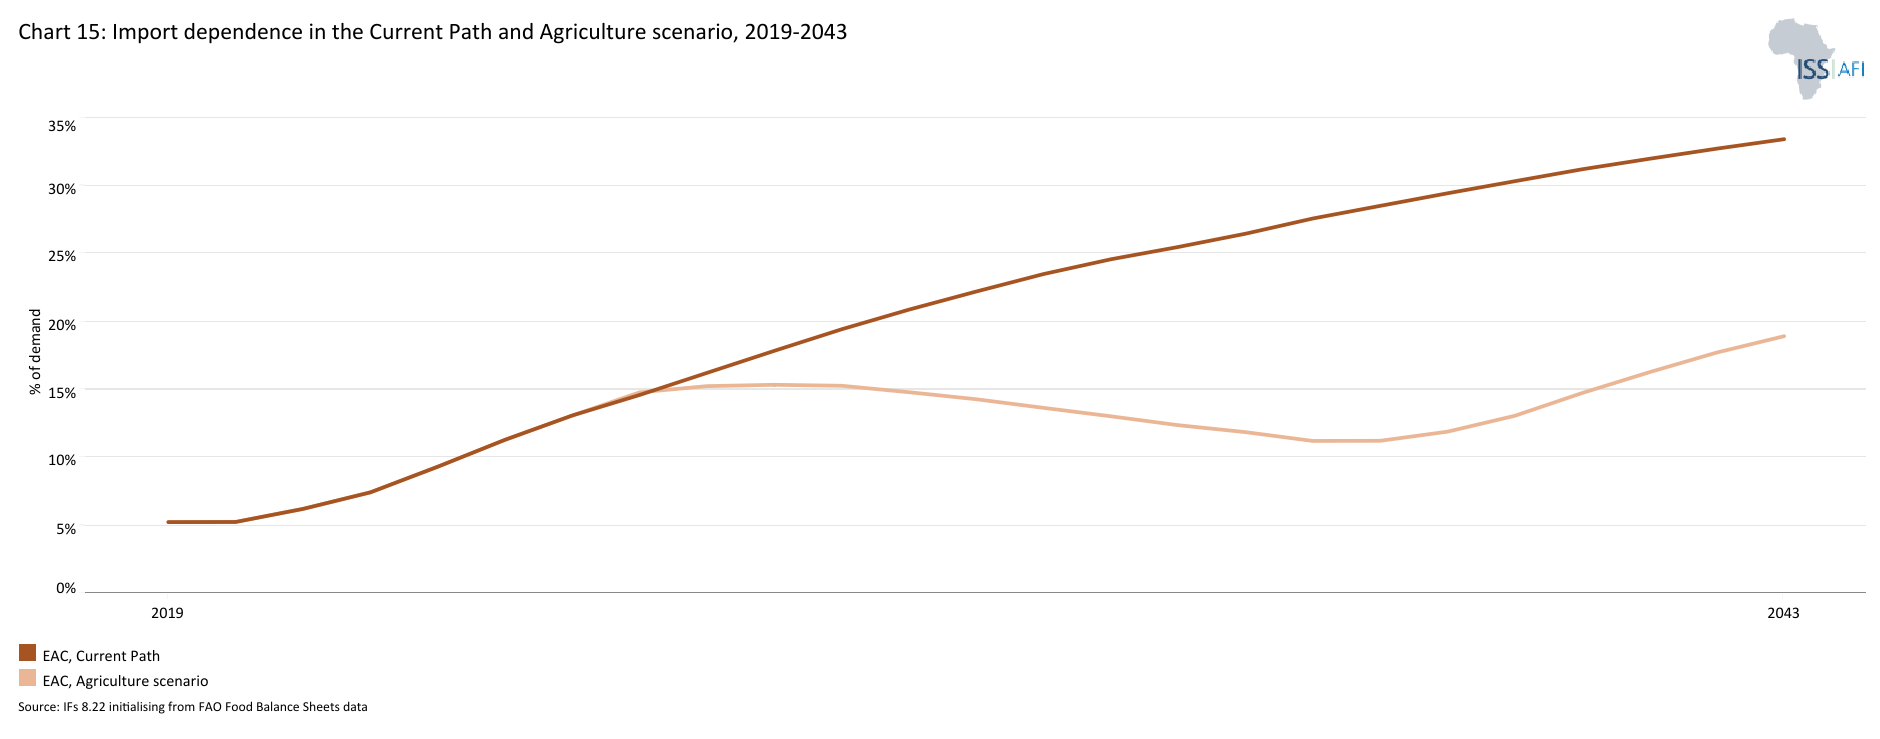
Chart 15 presents the import dependence in the Current Path and the Agriculture scenario from 2020 to 2050.
No country globally is expected or capable of producing all the agricultural products it needs to feed its population, partly due to dietry preferences. All states need to import food to sustain their people, but the more a country relies on others for sustenance, the higher the uncertainty and risks become. The outbreak of war in Ukraine in 2022 serves as a prime example of an external shock which dramatically impacted the food availability and security of African states. Many African states rely on Ukrainian and Russian wheat and grain, and the disruptions in trade due to war severely affected these countries.
On average, the EAC steers clear of these risks as food imports equated to only 9% of agricultural demand, 2 percentage points lower than the average for Africa in 2023. Over the forecast horizon however, the REC will increasingly depend on imports to satisfy growing demand, with import dependence rising to 36.7% by 2050 in the Current Path. The Agriculture scenario will mitigate this situation, lowering the import dependence to 21.9% by 2050, which highlights the potential the REC’s agricultural sector has to provide for its populace should the right interventions be made.
Somalia had the highest level of dependence in 2023, importing the equivalent of 48% of its agricultural demand. The Current Path and Agriculture scenario will both see this rate rise, but in the scenario import dependence only reaches 59%, 6 percentage points lower than in the Current Path. The country will continue to have the lowest agricultural production per capita amongst EAC members, and requires continued external assistance to feed its population. On the other end of the scale, Kenya and Burundi will have the lowest levels of dependence by 2050, at 3 and 0.7%, respectively. Even though most of Burundi’s work force is already employed in the agriculture sector, the scenario’s focus on improving yields through better farming practices unlocks the country’s agriculture potential and increases self sufficiency. Kenya likewise realises the full potential of its agriculture sector, with an emphasis on reduced agricultural losses boosting production.
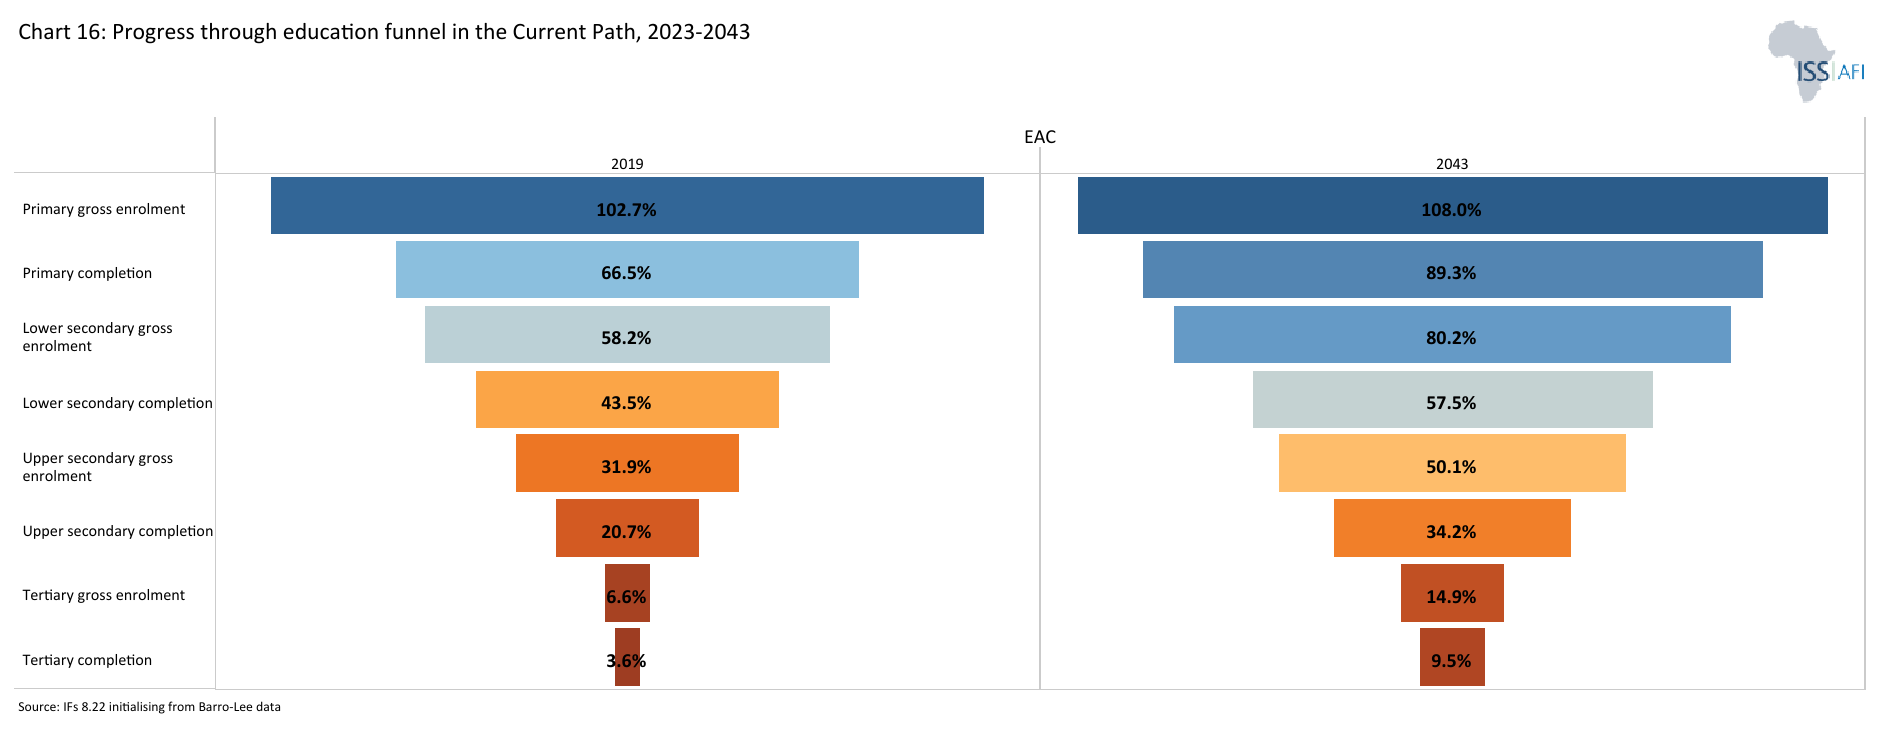
Chart 16 presents the progress through the educational system compared to the Africa income group (primary gross enrolment, primary completion, lower-secondary gross enrolment, lower-secondary completion, upper-secondary enrolment, upper-secondary completion, tertiary enrolment, and tertiary completion (2020-2050)).
The Education scenario represents reasonable but ambitious improved intake, transition and graduation rates from primary to tertiary levels and better quality of education at primary and secondary levels. It also models substantive progress towards gender parity at all levels, additional vocational training at the secondary school level and increases in the share of science and engineering graduates.
Visit the theme on Education for our conceptualisation and details on the scenario structure and interventions.
When considering the success of an education system, several factors need to be considered, two of which is the level of enrolment and completion. The members of the EAC have, like most countries in Africa, reached a level of universal primary school enrolment, making rapid progress in the last few decades. However, as learners progress through the education funnel, moving to secondary and tertiary education, an increasing number drop out and fail to complete their schooling at each level. In 2023, East Africa is the region where the highest share of learners were out-of-school at both the lower- and upper-secondary school levels. High levels of instability, conflict and climate related crises partly account for this as children are often needed to attend to other chores and tasks necessary for survival in difficult living conditions.
The region also faces challenges related to higher education, with funding for universities a particular problem across EAC members. The rapid increase in the amount of students enrolling at universities has placed an added burden on higher education financing and stretched already severe capacity shortages even further. A related area of concern is the quality of higher education, as students who exit university training often struggle to find gainful employment, often due to a mismatch between their learned skills and the needs of the labour market. Strengthening technical and vocational eduaction training (TVET) in the area has been touted as a possible solution to this skills mismatch. Implemented in May 2022, a Regional TVET Qualifications Framework developed under the the Eastern African Skills for Transformation and Regional Integration Project (EASTRIP) aims to promote “regional mobility of students and skilled workers” and help harmonise TVET education across the region.
Gender disparities in educational enrolment and attainment undermine the effectiveness of the region’s education system. In 2020, male students attained higher levels of gross enrolment across all four levels of education in the EAC, ranging from 0.9 percentage points at primary level, to 8.8 percentage points at upper-secondary level. Four countries stand out for their poor performance in the EAC: DR Congo, South Sudan, Somalia and Uganda. DR Congo and South Sudan have not reached parity at any level, while Somalia and Uganda have only reached gender parity at one level each. Furthermore, the disparities are large: at lower-secondary and upper-secondary level, DR Congo’s gender disparity was 30 and 23 percentage points, respectively. The inequality at primary level for South Sudan stood at 25 percentage points in 2020, Somalia’s imbalance equated to 7 percentage points at primary level and 8 percentage points at the lower-secondary level.
These countries struggle with child marriage and violence against women, which negatively affect the ability of girls to attend and complete school. In the latest version of the OECD’s Social Institutions and Gender Index (SIGI), child marriage rates[4The OECD defines child marriage as: “Percentage of girls aged 15-19 years who have been or are still married, divorced, widowed or in an informal union”] for these four countries were high: South Sudan had a rate of 40%, followed by 20% in Uganda, and 18% in Somalia and DR Congo. The global median score stood at 7.5%, while Africa’s median score was considerably higher at 17%.
Furthermore, in DR Congo, Somalia and Uganda, a large share of women aged 20-24 have had children before the age of 18, at 25%, 27% and 28%. Coupled with laws and social norms and attitudes which see women as primarily responsible for household tasks and childrearing, these practices and laws contribute to girls being marginalised and excluded from the education system. These deep seated problems will take time to change and in the 20 years, equality in education will worsen in the EAC: by 2050, gender gaps will have widened or only have narrowed slightly.
The EAC’s gross enrolment rate of 104% in 2020 for primary school is above Africa’s average of 102%, but only 68% of of-age learners complete primary school. Net enrolment, which only accounts for enrolment by children of the appropriate age group, was significantly lower than gross enrolment at 79% and underperformed Africa’s average by nearly 3 percentage points. The trend continues throughout the funnel, as the EAC lags behind the continental average across all four levels. The gap is widest at the upper-secondary level: Africa saw 42% of of-age children enrolled in upper-secondary schooling by 2023, while the EAC’s rate was 8 percentage points lower. Tertiary education gross enrolment in the EAC is also lagging behind the continental average: in 2023, gross enrolment stood at 6.6% in the EAC, 7.4 percentage points below Africa’s average. Over the forecast period, the REC will see significant improvement throughout the funnel: lower- and upper-secondary enrolment will increase by 18 and 16 percentage points respectively, while primary completion will jump by 16 percentage points, too. Tertiary enrolment will increase by 8.3 percentage points, while tertiary completion will rise to 9.5%, 5.9 percentage points higher than in 2023.
Country level performances between EAC members vary significantly: although Kenya does not have the highest primary gross enrolment rate, 105%, it succeeds in keeping children in school for longer, as the primary completion rate only drops to 93%, and lower-secondary gross enrolment rises to 95%. The country outperforms its EAC peers across the pipeline, with its upper-secondary completion rate of 55% considerably higher than DR Congo’s 22%, which ranked second in 2023.
Rwanda, Somalia and Tanzania all attained primary completion rate above 80% in 2023, but saw lower levels of lower-secondary enrolment. Uganda and Burundi had very high primary gross enrolment rate, 110% and 125% respectively, but both countries struggled with low primary completion rates in 2023.
On the other end of the scale, South Sudan performs poorly, having the lowest primary gross enrolment rate amongst the REC's members and also battling to keep children in school, as primary completion lags behind the group average. The country’s struggles stem from a lack of government coordination, low levels of funding, and continous weather and conflict related crises. In 2021, UNESCO found that nearly 60% of primary and secondary school children were not in school. Sizeable differences between rural and urban locations exist, with those living in pastoralist communities disproportionately affected. Orphans and girls in early marriages were two groups also more likely to miss school.
All eight members will see their educational attainment and completion rates increase by 2043, but a few improvements are noteworthy: Somalia, Kenya, Rwanda and Tanzania will have primary completion rate above 95%, while Uganda and Burundi make significant progress to reach rates of 82% and 86%, respectively. South Sudan also catches up to a degree, reaching a primary gross enrolment rate of 99%, while primary completion will stand at 68%, a 37 percentage point rise from 2023.
Education quality is another key consideration, and is as important, if not more important, than access to education. Of key concern to the EAC, and in Africa as a whole, is the low level of proficiency of learners, with the quality of content learnt so low as to be of little to no value for the labour market. One factor which helps explain low levels of educational quality is the lack of qualified teachers, leading to low teacher-to-pupil ratios and necessitating temporary measures such as parents paying teachers to make up the deficit. Lack of infrastructure and sound learning curriculums also play a part. Countries such as Rwanda, DR Congo and Kenya have taken steps to address these issues, focusing on increasing classroom-to-pupil ratios, reducing distances between students and schools, increasing the number of teachers through international funding projects, and including gender-sensitive strategies to ensure girls receive the same quantity and quality of schooling at their male peers.
Although quantifying and comparing the quality of education is difficult, our modelling uses the test performance of students to track progress. In 2023, the average test score for primary learners was 27, which is set to only increase to 31 by 2043. The secondary education test score in the Current Path improves from 37 in 2023 to 40 by 2043. At both levels, the EAC outperforms the African average but will continue to lag behind the rest of the World, with primary test scores 4 points lower and secondary test scores 3 points lower by 2043.
When considering education quality at the member state level, three groupings appear. Kenya, Uganda, DR Congo and Tanzania had similar scores in 2023, ranging between 28 and 30 for primary level test scores, and 38 and 40 for secondary level test scores. Rwanda, Burundi and Somalia were clustered between scores of 18 and 22 for primary level test scores and 30 and 32 for secondary test scores in 2023. South Sudan is an outlier, scoring 8 at primary level, 10 points behind the next best country, and 22 at secondary level, 8 points behind. South Sudan’s poor performance partly stems from ongoing weather and conflict crises, affecting the quality of education substantially. The constant flux of displaced persons leaving and returning to the country puts additional strain on existing educational infrastructure, while a lack of government funding inhibits progress in both enrolment levels and quality of education, as no public-funded schools have been built since 2011 and budget allocation fails to translate into actual expenditure.
On the Current Path, all eight EAC members will see their scores increase between 2 and 5 points, where South Sudan will see a larger rise from their low base by 2043. Kenya’s increase of 5 points in primary scores is notable, as it comes from a high base in 2023 and outperforms others in the REC. However, South Sudan will fail to surpass the next best country’s, Somalia, score in 2023 at both the primary and secondary level.
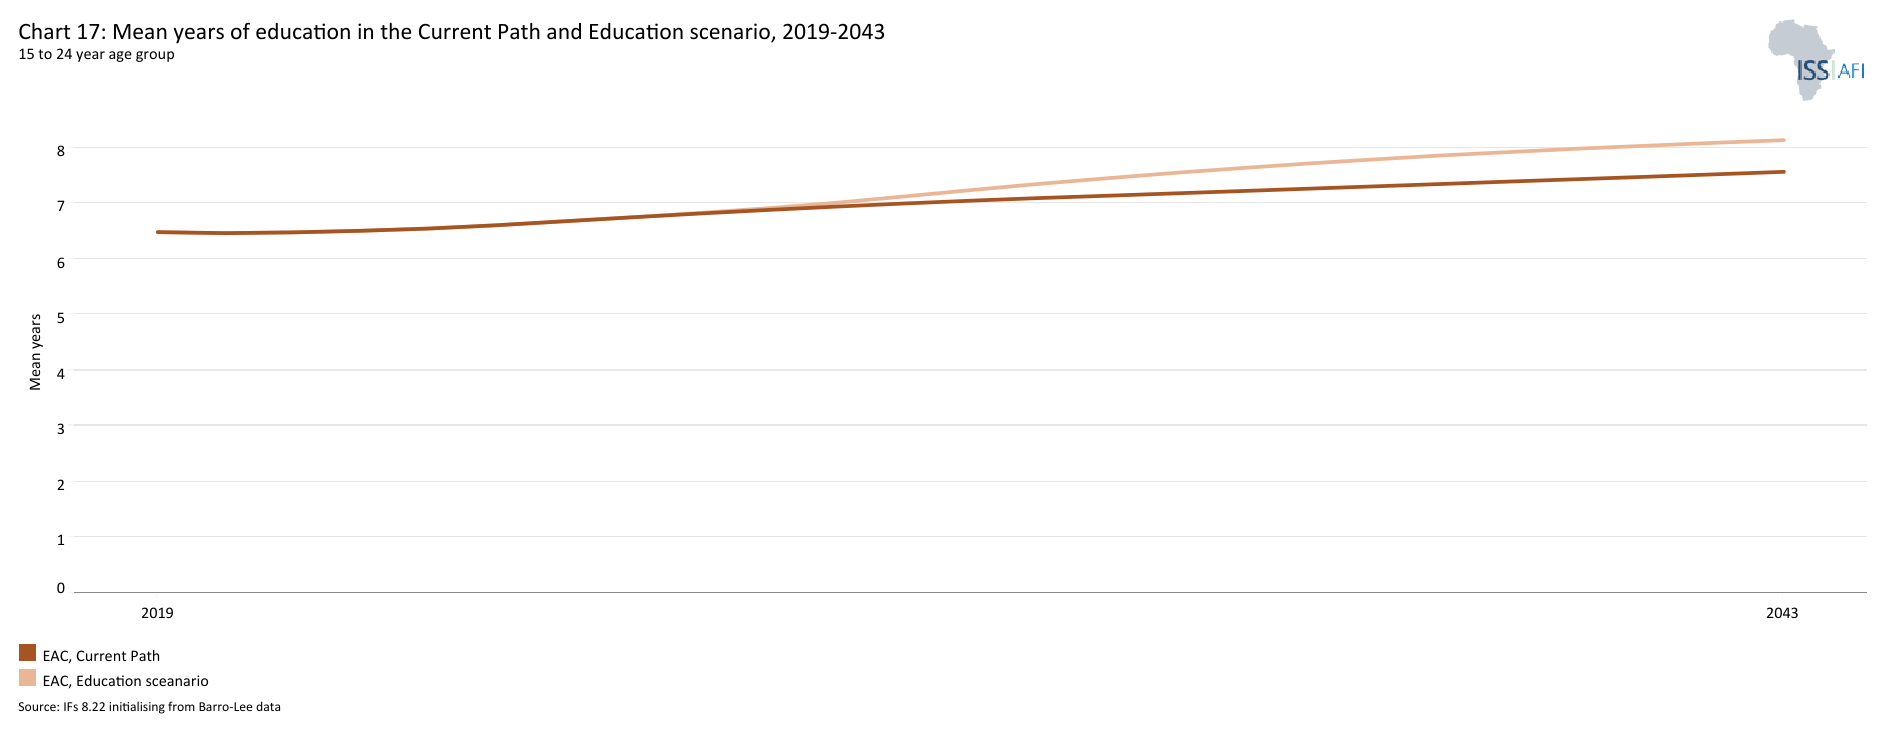
Chart 17 depicts the mean years of education in the Current Path compared to the Education scenario (for the 15 to 24 age group), from 2020 to 2050.
The average years of education in the adult population aged 15 to 24 is a good first indicator of how the stock of knowledge in society is changing.
As discussed in Chart 16, the EAC faces a number of challenges surrounding education, with large variance in performance between countries. While Kenya performs well by enrolling a high number of children, and ensuring they complete their education, others such as South Sudan and Somalia lag behind.
At the REC level, in 2023 the adult population between age 15 and 24 had an average education of 7 years, which is set to increase to 7.9 years in 2050 on the Current Path. In the Education scenario, the mean years of education of the EAC would increase to 8.4 years, 0.2 years higher than Current Path average for Africa. Kenya had the highest mean years of education in 2023 at 8.7 years, while South Sudan only had 3.1. The country which will improve the most over the forecast period is Somalia, which will see its level rise from 4.1 to 6.4 years, an increase of 2.3 years. The Education scenario will have the largest effect in DR Congo and Burundi with increases of 0.9 and 0.6 years in 2050 respectively.
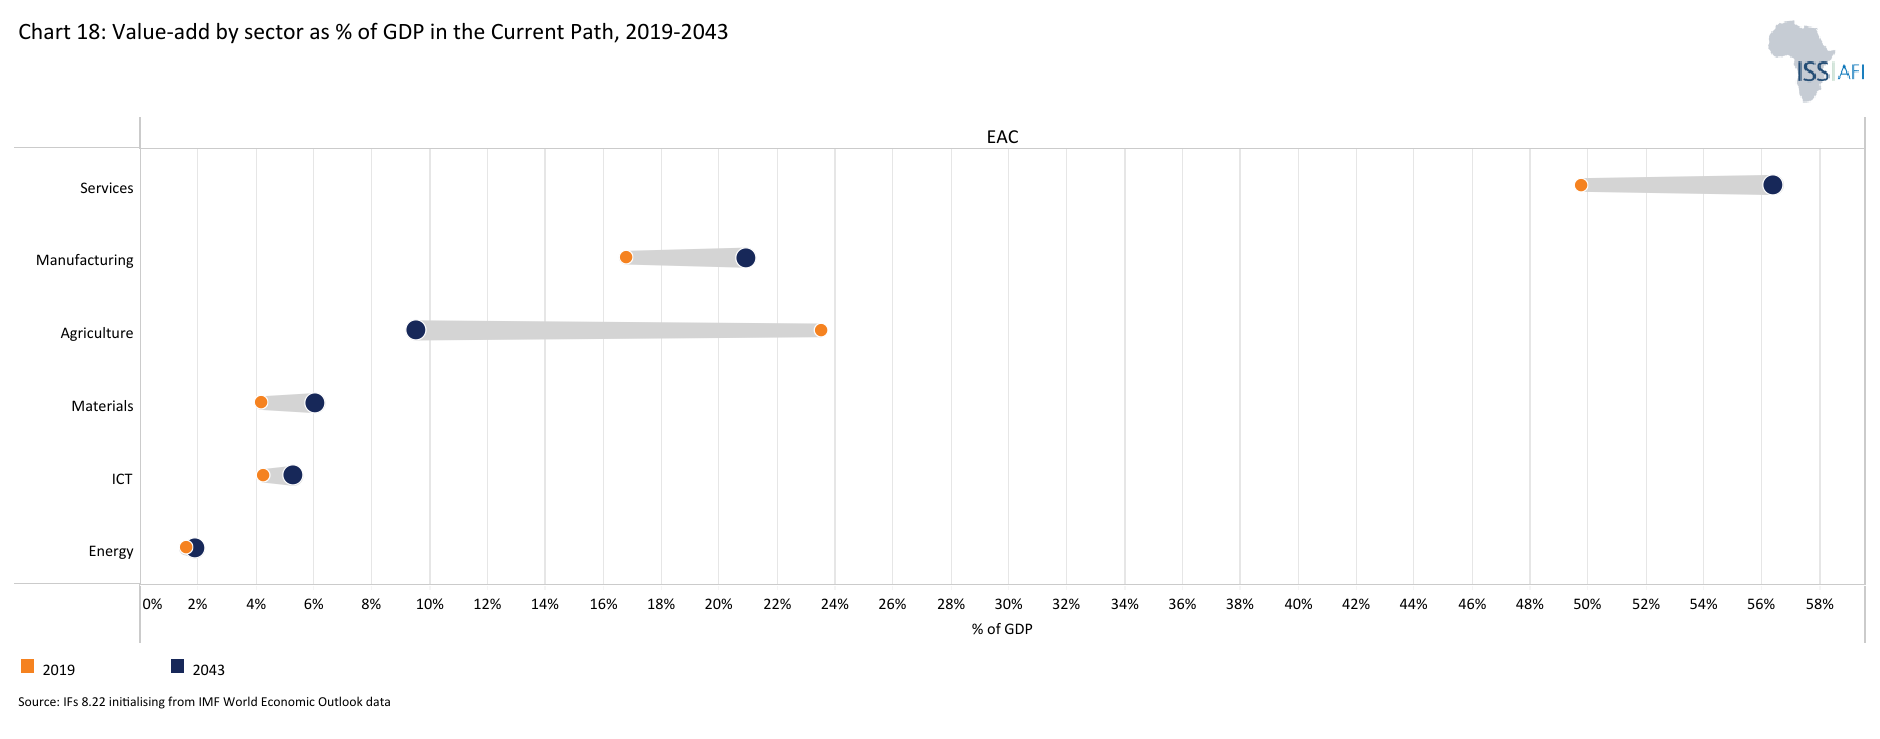
Chart 18 presents manufacturing as a share of GDP in the Current Path compared to the Africa income group, from 2020 to 2050.
In the Manufacturing scenario, reasonable but ambitious growth in manufacturing is envisaged through increased investment in the sector, research and development (R&D), and improved government regulation of businesses. This aims to enhance total labour participation rates, particularly among females where appropriate and is accompanied by increased welfare transfers to unskilled workers to mitigate the initial rises in inequality typically associated with a low-end manufacturing transition.
Visit the theme on Manufacturing for our conceptualisation and details on the scenario structure and interventions.
The EAC views the manufacturing and industrial sector as a key driver for sustainable growth in the region, aiming to grow the sector significantly between now and 2032, the end of its current Industrialisation Strategy. The main goal is to grow the share of manufacturing in the economy to 25% of GDP by 2032 through the achievement of a set of specific targets:
-
Ensure local value-added content makes up 40% of all of resource-based exports
-
Improve institutional frameworks to increase the effectiveness of industrial policies
-
Invest in R&D to structurally transform the manufacturing sector
-
Expand manufacturing trade:
-
intra-regional manufacturing exports amounts to 25% of all manufactured imports into the region
-
manufactured exports accounts for 60% of total merchandise exports
-
-
Transform SMME’s into competitive businesses capable of contributing 50% of GDP generated by manufacturing.
A sectoral evaluation in 2023 by the EAC highlighted the following challenges however:
-
Limited financing and resources available for development
-
Difficulties in building quality infrastructure such as industrial parks and electricity supply
-
Shortage of industrial skills due to subpar human capital development
-
Slow decision making at a regional level on industrial policies
-
Lack of R&D and Technological innovation.
To counter these challenges, member states must work to align their industrial policies through the EAC, with increased harmonisation potentially leading to a more robust regional market for manufacturing firms to exploit. Additionally, the region should play to its strengths and focus, in the short term, on agro-processing industries, before diversifying into higher value products in the medium to long term. The cotton apparel and leather products value chains are particularly suited to the competitive advantages of the region. Production of cotton and leather related products is already underway, with wood-based products also an important part of the manufacturing output in the region. The overall trend is for countries to either focus on the conversion of their abundant agricultural output into low-value added products, such as food and beverages, tobacco, textiles and clothing. A small number of industries are connected to international value chains which produce vehicles, electronic equipment and machinery, and growth in this sector is needed to spur on greater industrialisation in the region. An increased focus on labour market specific training and education is also needed, through tailored university programmes and TVET institutions.
At the REC level, the EAC's manufacturing sector contributed 16.7% of GDP in 2020, rising slowly to 21.7% by 2050. The REC will thus not meet its goal of 25% by 2032, and considerable work remains for member states to better its industrial base. The performance of individual member states diverge considerably. DR Congo and Uganda’s manufacturing stood at 24 and 23% of GDP respectively, followed by Tanzania at 15% in 2020. The two weakest performers were South Sudan and Somalia, at 9.6% and 6.1% in 2020. By 2050, Uganda’s manufacturing sector would equate to 29% of GDP, a 6.6 percentage point increase. South Sudan will also see significant growth, adding 19.6 percentage points to reach 29% of GDP, climbing from 7th to 2nd place amongst EAC members. The South Sudanese economy will undergo a shift away from energy towards manufacturing, as energy’s share will drop from 42% in 2020 to 20% by 2050. These drastic changes in the forecasts must be considered carefully and cautiously due to the data limitations for South Sudan. Futhermore, the country has historically struggled to create a robust manufacturing sector, due to a lack of raw materials and basic infrastructure. The country relies heavily on oil as a source of income, which is exported in an unrefined state as South Sudan has no oil refineries of its own. Overcoming these challenges and dependence on oil is possible, and investors see the country as a potentially profitable destination, if issues related to poor governance, corruption and instablity are addressed, and the nascent agricultural section is suitably developed.
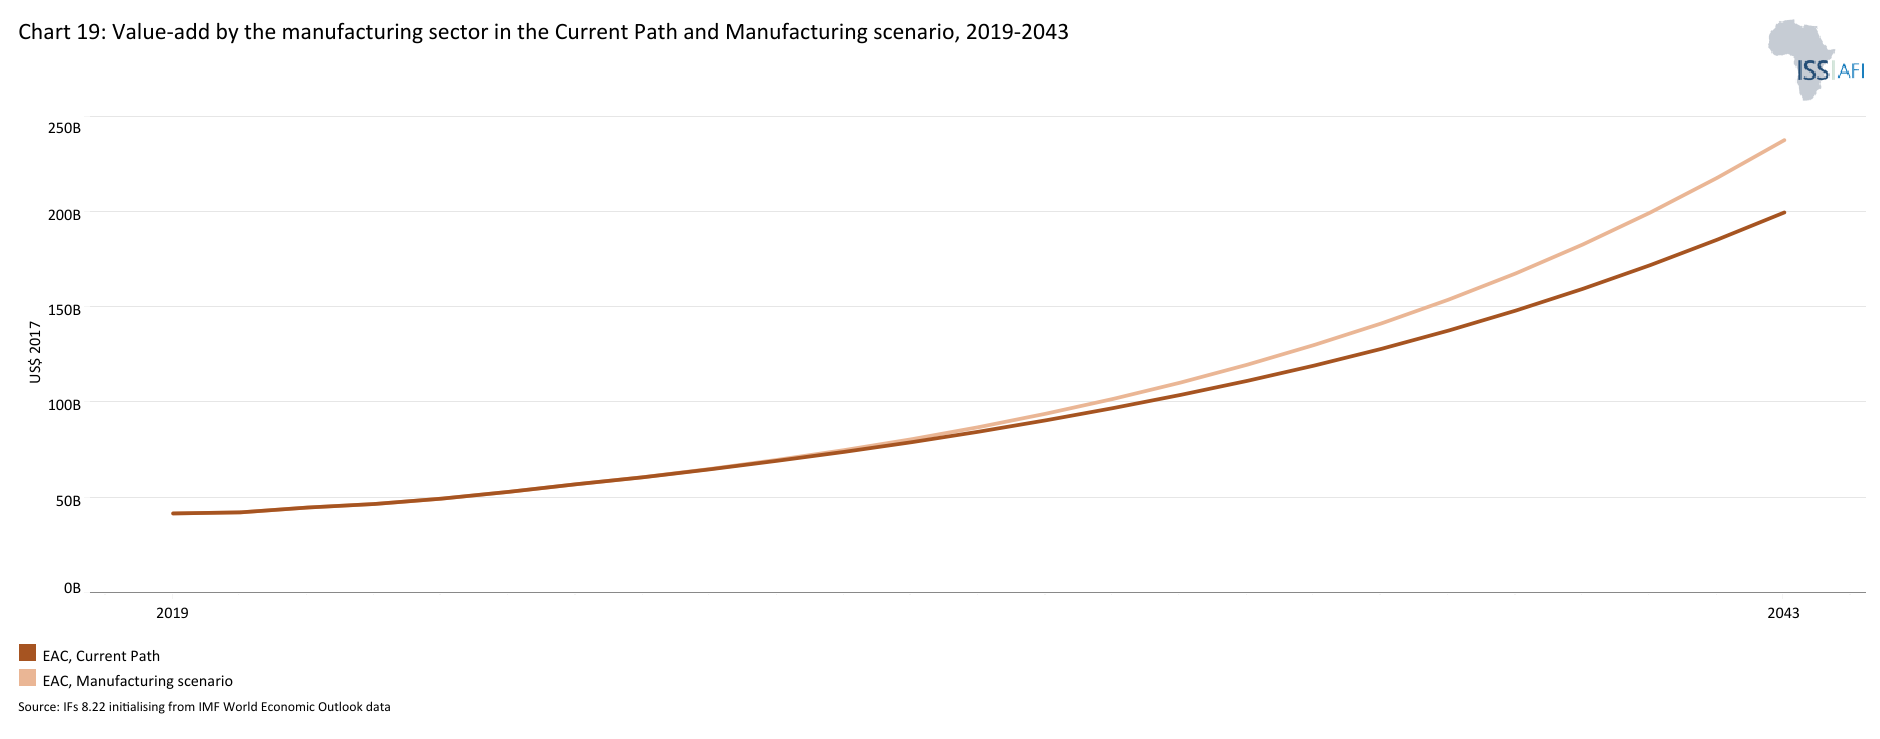
Chart 19 presents manufacturing as a share of GDP in the Current Path compared to the Manufacturing scenario, from 2020-2050.
The EAC will see steady but unspectacular growth in the Manufacturing scenario, as the manufacturing sector will be 4.2 percentage points larger by 2050 compared to the Current Path. As discussed in Chart 19, the sector faces a number of challenges to overcome, chief of which is a lack of infrastructure, human capital and adequate financing. The sector will amount to 25% of the REC’s GDP by 2050 in the Manufacturing scenario, reaching the target of 25% by set out in the EAC’s industrialisation strategy document 18 years later than the goal of 2032. Another key constraint to progress is the speed at which regional decisions are taken through the EAC by the member states, a problem potentially solved through improved communication between governments and ministerial bodies. Slow decisionmaking leads to delayed implementation of strategies which could spur on growth if they are prioritised appropriately.
South Sudan will see very significant growth in the sector, with manufacturing accounting for 33% of GDP by 2050, an increase of 23.8 percentage points in the Manufacturing scenario from 2020. Uganda, Burundi and Somalia will all see increases over 10 percentage points between 2020 and 2050, while Kenya will see the smallest increase at just over 5 percentage points. The improvement from the Manufacturing scenario over the Current Path value in 2050 ranges from 4.2 percentage points in South Sudan to 1.4 percentage points in Burundi. In the scenario, Uganda, South Sudan and DR Congo will have the three largest manufacturing sectors by 2050, while Somalia will have the smallest at 17% of GDP.
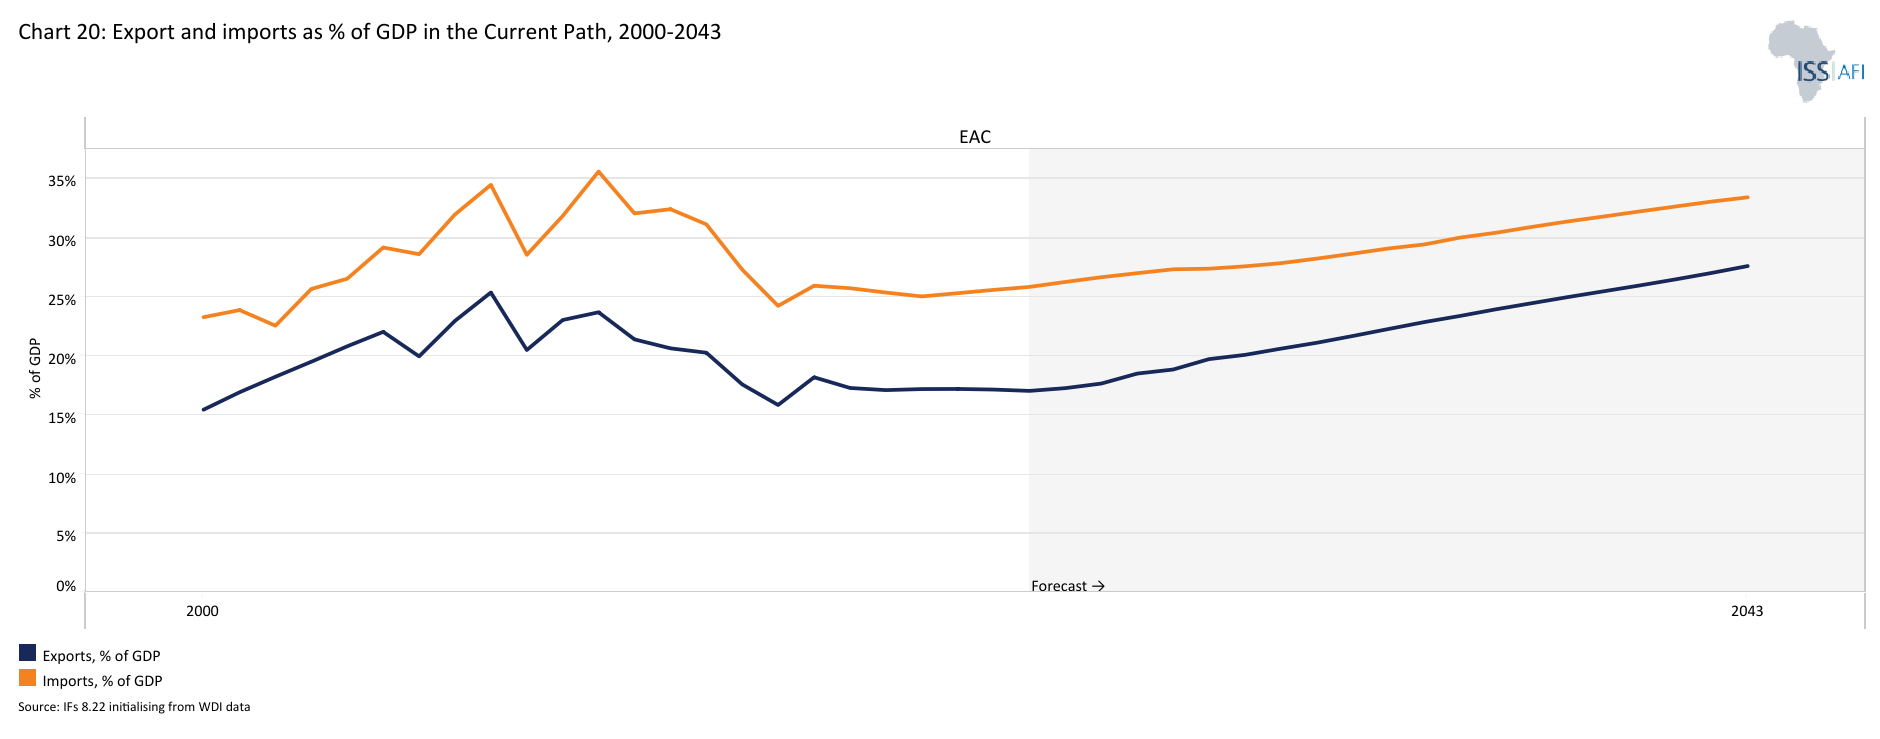
Chart 20 shows exports and imports as per cent of GDP from 1990 to 2050.
The AfCFTA scenario represents the impact of fully implementing the African Continental Free Trade Agreement by 2034. The scenario increases exports in manufacturing, agriculture, services, ICT, materials and energy exports. It also includes improved multifactor productivity growth from trade and reduced tariffs for all sectors.
Visit the theme on AfCFTA for our conceptualisation and details on the scenario structure and interventions.
Trade openness[5Trade openness is measured as the sum of export and imports over total GDP] has several benefits to an economy. The more an economy is open to trade, the larger the influence of trade transactions on economic activity and the better placed an economy is to benefit from the economic and non-economic benefits trade brings. Not only can businesses trade with a wider selection of international or regional firms, but they are also exposed to new and innovative ideas, and forced to increase their competitiveness, thereby increasing their overall productivity. In the long term, trade openness will reduce poverty after initially increasing it due to the redistributive effects of trade.
Intra-regional trade is seen as a crucial driver of growth for the EAC, and the REC has endeavoured to create a single market between its member states through the harmonisation of trade policies, product standards and investment incentives. The REC adopted a Common Market Protocol in 2010 to facilitate the free movement of goods, services and people, and has emphasised the need to tackle both tariff and non-tariff barriers to trade if countries want to grow.
Implementing frameworks that increase trade facilitation, strengthen competition policy and law, and counteract dumping of goods will foster regional trade openness in the REC.
The EAC, like most African countries, exports primary commodities and low-tech manufacturing products, and therefore a continental free trade agreement (AfCFTA) that reduces tariffs and non-tariff barriers across Africa will increase competition among countries in primary commodities and low-tech manufacturing exports. The EAC member states majorly export primary commodities such as coffee, cut flowers, gold, copper and various other metals, while importing refined and manufactured goods, mainly from other partners such as China, the UAE and India rather than its regional neighbours. As discussed in Chart 18, the EAC also has a small manufacturing sector, which faces challenges related to investment, human capital and infrastructure. These factors mean that countries with inefficient, high-cost manufacturing sectors might be displaced as the AfCFTA is implemented, thereby pushing up poverty rates. Decreased trading costs and easier access to larger markets will also benefit others who have a comparative advantage in the production of raw materials and primary commodities. In the long term, as the economy adjusts and produces and exports its comparatively advantaged (lower relative cost) goods and services, poverty rates will decline.
The EAC has historically been more open to trade compared to the average for sub-Saharan Africa, but since 1997 the REC has seen its trade openness be below both sub-Saharan Africa and North Africa’s average. In 2023, the EAC’s trade openness equated to 43%, trailing sub-Saharan Africa by 1.6 percentage points and North Africa by 9.7 percentage points, respectively. The region is expected to see a steady and sustained increase in trade openness, reaching 66% by 2050, overtaking both North Africa and sub-Saharan Africa by 6 percentage points.
The rise in trade openness will be driven by all countries, except South Sudan, with the region increasing their trade volumes, both for imports and exports. Somalia’s economy will see the largest increase, rising by 35 percentage points from 85% in 2023 to 134% by 2050. Burundi will see the smallest positive change at 7.6 percentage points, while South Sudan will see a drop of 74 percentage points, albeit from a very high base of 207% in 2023. The lack of productive capacity in South Sudan means relying heavily on imports to satisfy domestic demand for basic goods, while the exporting of oil is their main source of income. In 2023, imports amounted to 98% of GDP, a figure which will drop to 70% by 2050. Somalia’s rising level of trade openness will be largely driven by increasing levels of imports, rising from 64% in 2023 to 81% by 2050, a large part of which is foodstuffs and vegetable products to compensate for decreased production as a result of prolonged droughts and instability. Exports will also increase as a percentage of GDP, to 54% by 2050, but the country is dependent on a small selection of goods, namely live animals, gold and insect resins.
Chart 21 shows the trade balance as a share of GDP in the Current Path compared to the AfCFTA scenario, from 2020 to 2050.
The trade balance is the difference between the value of a country's exports and its imports. A country that imports more goods and services than it exports in terms of value has a trade deficit, while a country that exports more goods and services than it imports has a trade surplus.
In 2023, the EAC had a trade deficit of 8.7% of GDP, which will improve to 4.3% by 2050. The REC is more dependent on imports than the rest of Africa, as the continent’s average will improve from 4.8% to 2.3% over the forecast period. In the AfCFTA scenario, the REC will improve its position relative to the continental average, reaching a trade deficit of 3.1% by 2050, an improvement of 1.2 percentage points.
Thus, the full implementation of the AfCFTA will invigorate trade in EAC members, some of whom will benefit more than others. DR Congo will see the largest improvement in its trade balance, as the trade deficit improve by 7 percentage points by 2050. EAC members will also experience growth in different sectors: in the services sectors, Kenya, Rwanda, Tanzania and Uganda will see their trade surpluses grow, as their competitive advantages are maximised under the AfCFTA.
Chart 22 presents the access to electricity for urban, rural and total population from 1990 to 2050.
The Large Infrastructure and Leapfrogging scenario involves ambitious investments in road and renewable energy infrastructure, improved electricity access and accelerated broadband connectivity. It emphasises adopting modern technologies to enhance government efficiency and the rapid formalisation of the informal sector, incorporating significant investments in major infrastructure projects like rail, ports, and airports while highlighting the positive impacts of renewables and ICT.
Visit the themes on Large Infrastructure and Leapfrogging for our conceptualisation and details on the scenario structure and interventions.
Improvement of infrastructure systems, including roads, railways, aviation, communications, and inland waterways, is an important arm of the EAC regional integration project. Crucial to improving regional infrastructure systems requires the harmonisation of regulatory laws, construction and maintenance and the review and redesign of intermodal transport systems. A concrete step towards this goals was the adoption of the Tripartite Transport and Transit Facilitation Programme Eastern and Southern Africa (TTTFP), which aims to “facilitate the development of a more competitive, integrated and liberalised regional road transport market in the East and Southern African region”.
The need for improved road network is clear: in 2023, only 14% of the EAC’s roads were paved, compared to 24% in Sub-Saharan Africa and 83% in North Africa. By 2050, the EAC’s rate will rise to 49%, 7 percentage points below Sub-Saharan Africa, and 38 percentage points below North Africa. A number of cross-border road corridors have been built in the region to improve this situation: the Northern Corridor, which stretches from Kenya to Rwanda and DR Congo, through Kampala in Uganda; the Nairobi-Lusaka corridor, which runs through Tanzania and connects Lusaka with the Mombasa port in Kenya; and the North-South corridor, which connects the North of Rwanda with the Tanzanian border, running through Burundi along the way. These roads have increased commercial activity and decreased travel times, while serving as vital lifelines for landlocked countries such as Burundi, Rwanda, Uganda, and DR Congo (semi-landlocked).
The benefits of these major roads are numerous, but in countries where the majority of the population live in rural areas, other parts of the road network, such as minor and dirt roads, take on greater significance. High quality rural roads, which are durable in all weather types, play an important role in rural-urban connectivity. Indicator 9.1.1 in the UN’s Sustainable Development Goals refers to the proportion of the rural population who live within 2 km of an all-season road and is captured in the Rural Access Index. EAC member states had a wide range of scores in 2019: Rwanda and Burundi has score of 80 and 92% respectively, Uganda, Kenya, Tanzania and DR Congo scored between 72 and 47%, while South Sudan and Somalia lagged behind at 20% and below. Increasing rural-urban connectivity by building durable, all-season roads is an important enabling factor for the agriculture sector[6We model the impact of improving rural connectivity through greater access to rural roads on the agriculture sector in our Agriculture theme and in the Agriculture scenario above.], as better connectivity enables farmers to get their produce to market quicker and realise better profits. Other benefits include improved exposure to education and healthcare.
Kenya, Tanzania and Rwanda have all undertaken mega infrastructure projects in other forms of transport, all aimed at increasing interconnectedness in the East African region. Kenya is still working on the Standard Gauge Railway (SGR) between Mombasa to Malaba, Tanzania is planning to build the largest port in Africa and Rwanda is constructing a mega-scale airport to replace the existing Kigali International Airport. A joint project between Burundi-DR Congo-Tanzania to construct an SGR is also underway, with the second phase kicking off in 2024.
Another aspect of infrastructure development is energy, particularly the provision of electricity for the population of the EAC. As part of the East African Power Master Plan, which aims to employ a “least cost generation and transmission plan” to meet East Africa’s increasing demand for power, the Eastern Africa Power Pool (EAPP) was established as a regional institution to coordinate cross-border power trade. The EAPP has 13 members in East and North Africa, and aims to improve electricity access in the region through better coordination on power exchange, electricity production and transmission. Furthermore, the initiative aims to optimise the energy resources available in the region and in the long create a single Electricity Market in East Africa. A number of key issues identified to accomplish this task are:
- low access to electricity services (except for Egypt and Libya)
- insufficient installed generation capacity
- a high cost of supply
- limited electricity interconnections
- comparatively high electricity distribution losses
As of 2023, total electricity access in the EAC stood at 39%, compared to 98% in North Africa and 50% in Sub-Saharan Africa. By 2050, the access rate will have increased to 68%, while Sub-Saharan Africa’s will reach 75%, thus reducing the gap to 7 percentage points. The disparity between rural and urban areas in the EAC is large: in 2023, 65% of the region’s urban population had access to electricity compared to 25% of its rural population. Access will improve in both areas over the forecast period so that by 2050 urban access will equate to 85% and rural access will reach 51%; the gap between the two will however remain largely the same.
Access rates across the individual states differ substantially. Kenya had the highest level of total access at 73%, while four countries, Rwanda, Somalia, Tanzania and Uganda, had rates between 51% and 41%. DR Congo had a rate of 21% in 2023, while Burundi and South Sudan lagged further behind with rates of 11 and 7% respectively. Over the forecast period, Tanzania will see the largest increase, at 37 percentage points, followed by Uganda at 36 percentage points, and Rwanda and DR Congo at 35 and 32 percentage points respectively. Burundi will only see an increase of 22 percentage points to have an access rate of 33% by 2050, while South Sudan’s access will improve by 19 percentage points, leaving the country with a total access rate of only 26%.
Every country has lower rural access rates compared to urban areas, but four countries, Burundi, DR Congo, Somalia and South Sudan will see this gap grow over the forecast period. South Sudan will see the largest increase: in 2023, the gap between rural and urban electricity access was 9 percentage points. By 2050, the gap will grow to 39 percentage points, due to urban access rates increasing from 14 to 59%. Burundi will continue to have the largest gap, which will rise from 59 to 70percentage points by 2050, as only 17% of the country’s rural population will have access to electricity. Kenya will have the smallest gap by 2050, at 5 percentage points.
Chart 23 shows the number of people using cookstoves in the Current Path versus the Large Infrastructure and Leapfrogging scenario from 2020 to 2050.
The majority of people in the EAC, 85% in 2023, still rely on traditional cookstoves for their cooking needs. This is a much higher rate than in the rest of Africa, where 61% of the continent’s population uses cookstoves that burn fuels such as charcoal, firewood, coal and kerosene. These figures are to be expected when considering the discussion in Chart 22 on the low levels of rural electricity access in the EAC, where the majority of the REC’s population resides. Although the use of these stoves requires little upfront costs and the types of fuel used are readily available, the negative effects they have on users’ health and the environment mean increased usage of modern fuel stoves is a development priority. Furthermore, the use of clean cooking methods has the potential to create jobs in areas such as stove production, sales and fuel delivery, but care must be taken to accommodate those already employed in the charcoal and firewood industry, with upskilling required to mitigate potential job losses.
A decrease in deforestation, lower emissions, better health outcomes and improved educational attainment are all benefits of adopting clean cooking methods but require investments in alternative fuel sources such as liquified petroleum gas (LPG) and electricity, for which infrastructure remains a constraint. The advantages far outway the initial costs, as clean cooking tackles gender inequality by freeing up women’s time for money earning activities due to the reduction in time spent cooking and gathering fuel.
The EAC will stand to benefit from this transition to clean cooking over the forecast horison, as modern fuel cookstoves will be used by 53% of households by 2050, compared to 45% for traditional cookstoves. The Large Infrastructure and Leapfrogging scenario increases the speed of this transition and by 2050 the use of modern fuel cookstoves will reach 63%, 10 percentage points higher than in the Current Path. This increase also has the added benefit of decreasing the number of deaths from respiratory deahts, especially for women, who are usually responsible for cooking in the household.
The uptake of modern fuel cookstoves amongst EAC members has historically been low, except in Kenya, where 26% of households used this type of stove in 2023. The other 7 members all had a level of uptake below 15% in 2023, and for Burundi and South Sudan, this will still be the case by 2050 in the Current Path. The Large Infrastructure and Leapfrogging scenario will accelerate the already rapid progress in the Current Path for one country in particular, with 5.6 million Rwandans having access to modern fuel cookstoves in 2050 compared to the Current Path value of 4.6 million. The growth rate is steep: in 2023, only 0.1 million people had access to modern fuel cookstoves in Rwanda.
Compared to their rates of modern fuel cookstove usage in 2023, Somalia and DR Congo will see more modest improvements in the Current Path at 13 percentage points, and the scenario only has sligthly larger impact, where the uptake rate will be 19 and 16 percentage points higher respectively by 2050. Burundi and South Sudan will see slow growth and uptake rates will increase by less than 10 percentage points over the forecast horison in the scenario, coming from an already low base.
Chart 24 presents the percentage of the population and number of people with access to mobile and fixed broadband in the Current Path compared to the Large Infrastructure and Leapfrogging scenario, from 2020 to 2050. The user can toggle between mobile and fixed broadband.
Increasing internet access has multiple benefits for a country and leads to a number of positive spillover effects. Not only does higher levels of internet access inclusively increase productivity, it also creates jobs, improves general welfare and leads to indirect impacts on entrepreneurship, innovation and FDI. The more users have access to the internet, the larger the impact digital technologies can have on poverty reduction and increased income generation. Broadly, the internet can be accessed in two ways: mobile or fixed broadband. The former entails access through cellular towers or satellites, while the latter requires more costly infrastructure such as fibre-optic cables. Mobile broadband coverage in Africa is the lowest globally and the EAC lags behind its continental peers in access to 2G, 3G, 4G and 5G networks. The REC also has higher costs for mobile data and handsets, while users also face steeper taxes. Fixed broadband has even lower levels of penetration in the region, with fibre optic cable installations lacking, particularly in DR Congo, Somalia and South Sudan. The spread of fixed line connections is also lower in rural areas, although this is slowly improving, an issue which is worsened further by the large disparities in electricity access between rural and urban areas.
As a result, the EAC has much higher levels of access to mobile broadband, a trend reflected across Sub-Saharan Africa. In 2023, the EAC had 43 mobile broadband subscriptions per 100 people, compared to 52 for Sub-Saharan Africa. Conversely, fixed broadband subscriptions per 100 people stood at 2.3 for both in 2023, and will only improve to 28.9 by 2050. The scenario significantly improves on this performance, raising fixed broadband subscriptions to 42.1 by 2050, an increase of 13.2 subscriptions. Growth in mobile broadband access will however triple over the forecast horison, reaching 144.3 subscriptions per 100 people by 2050 in the Current Path. Due to this high rate of growth, the scenario has little impact, increasing subscriptions by 0.7 in 2050 compared to the Current Path.
Every EAC member will see rapid growth in the uptake of mobile broadband subscriptions over the forecast horison, although some countries, such as Somalia and South Sudan, will come from very low bases in 2023. Rwanda and Kenya both had high scores in 2023, at 71 and 70 subscriptions per 100 people, while Somalia and South Sudan achieved rates of 12 and 8 respectively. In the Current Path, all EAC members will have more than 120 subscriptions per 100 people, with the highest rate in Kenya at 153 by 2050 in the Current Path. The scenario only adds to this momentum, with the largest increase being 2.2 subscriptions in 2050.
Greater internet access through higher levels of infrastructure, especially in rural areas, holds many benefits for EAC members, one of which is better access to e-government services for citizens. By digitalising service delivery, governments can enhance the access to and quality of basic services, both for citizens and businesses. Processes which would normally take considerable time away from citizens, such as applying for visas and passports, completing tax returns and acquiring marriage or birth certificates, are streamlined through digital communication channels, all enabled through higher levels of internet access. In addition, the reduction in administrative burdens for firms leads to a better business environment, which encourages investment and subsequent job creation. Crucial to realising these benefits, however, are the provision of adequate internet infrastructure, both in rural and urban areas, greater digital skills and a strong regulatory framework.
The UN developed the E-Government Development Index (EGDI) to measure the three most important dimensions of e-government: provision of online services, telecommunication connectivity and human capacity. The 2024 version of the EGDI shows the varying levels of implementation of e-government practices in EAC member states: Kenya ranked 109th globally and 8th in Africa, followed by Rwanda at 118th and 14th. Uganda and Tanzania ranked 23rd and 24th in Africa, while DR Congo ranked 44th and Burundi 48th out of 54 countries. Somalia and South Sudan were the bottom performers, ranking 191st and 192nd out of 193 countries. South Sudan and Burundi struggled with telecommunication infrastructure specifically, while a lack of human capital was to blame for Somalia’s poor performance. Kenya scored high in the Online Service Index, ranking 3rd in Africa, showing the country’s success in creating systems which are intuitive and widely available for its citizens.
Chart 25 depicts the trends in Foreign Direct Investment, aid and remittances as a percentage of GDP, from 1990 to 2050.
The Financial Flows scenario represents a reasonable but ambitious increase in inward flows of worker remittances, aid to poor countries and an increase in the stock of foreign direct investment (FDI) and additional portfolio investment inflows. We reduce outward financial flows to emulate a reduction in illicit financial outflows.
Visit the theme on Financial Flows for our conceptualisation and details on the scenario structure and interventions.
Financial flows from outside the EAC region are crucial for development, as they allow governments to mobilise resources needed to grow economies, through FDI, foreign aid and remittances. Africa a whole has the lowest level of tax-to-GDP globally, and thus government requires other revenue schemes to compensate for the shortfall. Recent shocks such as the Covid-19 pandemic and the war in Ukraine have complicated the investment and foreign aid space, making it more difficult for African states to access these funds. In addition, already high levels of debt coupled with rising debt servicing costs has made borrowing difficult for many states.
The EAC has identified foreign investment as a crucial tool to combat this situation and aims to attract funds for targeted investments in infrastructure, industrial development and oil production. Also, renewable energy investments serve to lower a high import bill for energy and reduce the region’s dependence on fossil fuels. As such, the REC is emphasizing the need for increased levels of intra-EAC investments and has encouraged members to implement certain reforms such as improved tax collecting and stricter controls over illicit financial flows as means to promote member-to-member investment.
In 2023, FDI inflows stood at 2.6% of GDP for the EAC, slightly lower than 2.7% for Africa. Foreign investment has recovered since reaching a low of 1.7% in 2016, but remains lower than the peak period between 2007 and 2013, when the REC averaged FDI inflows of 3.5% of GDP. The growth in FDI was mainly fueled by DR Congo, where FDI as a percentage of GDP peaked at 12.7% in 2010 and averaged 7.5% over that period. Increasing demand for cobalt, used in smartphones and electric car batteries, fueled this strong performance, as DR Congo produces the majority of global cobalt output. South Sudan and Burundi lag behind the rest of the EAC, with FDI inflows below 1% for most of the last decade. In the Current Path, the average FDI inflows for the EAC will remain steady and reach 3.3% by 2050, representing strong growth in absolute terms as the REC’s economy will be three times larger at that point. DR Congo will remain the most attractive destination for FDI in the REC, reaching 4.3% by 2050, followed by Uganda and Tanzania. The continued interest in DR Congo by international investors will likely be driven by a continued interest in the country’s large untapped natural resources, while renewable hydro and large infrastructure projects provide additional avenues for lucrative returns on FDI.
The EAC has seen foreign aid steadily decrease since 2003, when the REC received aid equivalent to 18% of GDP. In 2023, the amount had shrunk to 5.2% and in the Current Path the REC will only receive 3.2% by 2050. The regional average masks large differences between countries. Generally consistent with global development trends, poor and smaller countries in the region have relied heavily on aid. Somalia received aid equal to 28% of GDP in 2023, followed by Burundi at 19% and Rwanda at 11%. The rest of the EAC all received under 7% in 2023. In the Current Path, Burundi and Somalia’s dependence on foreign will only decline marginally, reaching 13 and 21% respectively by 2050. Somalia and South Sudan continue to face large humanitarian challenges which require large amounts of external aid to counteract the negative affects of climatic shocks and instability. In 2023, South Sudan required US$1.7 billion in aid, of only 52% was funded, while Somalia needed US$2.6 billion in 2023, of which only 44% was covered, mostly by the USA, EU and Germany. The massive flows in aid were aimed at providing cash transfers, safe water, food assistance and protection services. Burundi required a much smaller amout, US$ 237 million, in 2023 but by June of that year only 26% of funds had been provided. The sectors which needed assistance ranged from education, health and nutrition, to repatriation and protection services. The country is in a fragile situation and will be exposed to increasing levels of returnees from neighbouring countries and heavy rainfall in the coming years, which will both strain the social cohesion and service delivery of the country.
Finally, remittances to the EAC remains an important source of funds for citizens to alleviate their most pressing needs and survive. Although these funds can serve to help families buy necessities, they are often not used in a way to spur on long-term growth and serve as a buffer rather than seed money for a business. Nevertheless, countries such as Kenya, Rwanda, South Sudan and Somalia all receive substantial amounts of these transfers yearly, driven by large diaspora communities. Somalia’s remittances equated to 15% of GDP in 2023, followed by Kenya and Rwanda at 4%. South Sudan’s last data point came in 2015 and reached 9.5% of GDP. By 2050, remittances will still amount to 4% of Somalia’s GDP, while Kenya and Uganda will see their level of inflows remain constant, at around 3 and 2.6% respectively.
Chart 26 shows government revenue in the Current Path compared to the Financial Flows scenario from 2020 to 2050. The data is in US$ 2017 and % of GDP.
Wagner's law, or the law of increasing state activity, is the observation that public expenditure increases as national income rises. It is reasonable to expect that government revenues will increase as a per cent of GDP in the Financial Flows scenario compared to the Current Path.
The most important source of government revenue is taxation, which requires a well financed and capable central government to efficiently manage a working tax collection system. Furthermore, the government’s capacity is strongly correlated to better tax generation, which is a crucial source of funds for governments to provide critical services such as healthcare, education and access to food. The goal for low-income and lower-middle-income countries is to increase the size of their tax base and widen the tax net by limiting tax evasion strategies, such as base erosion and profit shifting.
The data for government revenue is not readily available, making the picture at the individual country level clouded. The World Bank’s WDI database provides reasonably up to date data for seven countries, with South Sudan not included. Somalia is a distinct outlier, with the latest data showing the country collecting no revenue. The other six countries are clustered together, with the minimum value of 11.4% for DR Congo and the maximum value of 15.6% for Burundi. Due to lack of accurate data, forecasts in our modelling may not be reliable.
The EAC is relatively poor at collecting tax and generating revenue compared to North Africa, while it performs similarly to sub-Saharan Africa: in 2023, the REC generated revenue equal to 17% of GDP, compared to 17.6% for sub-Saharan Africa and 27.3% in North Africa. Although collection improves over the forecast period, the EAC will continue to lag behind, reaching 21.7% by 2050. North Africa will see government revenue equal to 31% by 2050. The Financial Flows scenario makes a marginal difference, increasing the rate to 22.1% for the EAC by 2050, equating to a rise of US$15.4 billion.
Chart 27 presents the Current Path of government effectiveness from 2002-2050.
The Government Effectiveness score, developed by the World Bank, measures “perceptions of the quality of public services, the quality of the civil service and the degree of its independence from political pressures, the quality of policy formulation and implementation, and the credibility of the government's commitment to such policies”. Higher scores in this index indicate a capable state, who creates effective policies and has the ability to implement them too. The EAC included ‘strengthened governance’ as one of the eight strategic focus areas of the REC’s sixth development strategy, in order to provide a more stable business environment. To this end, the strategy has as key targets the promotion of a regional framework of Good Governance and the implementation of cooperation arrangements centring around governance, rule of law and access to justice.
Improving good governance at a country level will have a wider effect regionally, as increased service delivery and decreased instability will improve regional performance. It will also enable states to better accommodate the large inflows of migrants and refugees from fellow member states. As populations move across borders in search of safety or opportunity, host countries are placed under additional strain to accommodate them and provide the needed services. A lack of government effectiveness means goverments at all levels lack the expertise and commitment to provide the services needed to sustain economic growth, social cohesion and decent standards of living.
On average, the EAC performs poorly compared to the sub-Saharan and North African averages. In 2023, the REC scored 1.4, compared to 1.7 for sub-Saharan Africa and 1.9 for North Africa. The REC’s score represents a partial recovery from a downward trend it experienced from 2006 to 2020. Over the forecast period, the EAC will see gradual progress to reach 2 by 2050, keeping the gap to sub-Saharan Africa at 0.3 index points.
Performance of member countries on government effectiveness can be categorised into three groups: the bottom group consists of Somalia and South Sudan; the next group contains DR Congo and Burundi; and the third group has the highest performers of Rwanda, Kenya, Uganda and Tanzania. South Sudan’s score has dropped dramatically from 0.92 in 2012 to 0 by 2023. The country has struggled to recover from its civil war, and the government is struggling to implement development policies as it continuously deals with crises brought on by political instability and climate shocks. Somalia, on the other hand, has slowly recovered from its lowest score of 0.05 in 2014 to reach a score of 0.35 by 2023. The peaceful transition of power in 2022 has helped, but slow progress in reviewing the constitution has hampered real change. Deficits in implementation and policy formulation capabilities also remain. Burundi and DR Congo have experienced tumultuous periods politically in recent years, and this has affected their scores, although government effectiveness is recovering from highs in the previous decade. In 2023, Burundi scored 1.2 and DR Congo reached 0.9. The top performer in the EAC was Rwanda, with a score of 2.7 in 2023. The country has made significant progress since 1996, when it had a score of 1.4. All 8 countries will make steady progress over the forecast horizon, with South Sudan catching up and surpassing Somalia by 2050. Worryingly, only Kenya, Rwanda and Uganda will surpass the 2.5 mark, which represents a score of 50% in the index.
Chart 28 shows the composite governance index in the Current Path compared to the Governance scenario in 2020 and 2050.
This scenario assumes better governance: stability, capacity, and inclusion. It measures a state’s progress using the average of these three indices. To this end, it includes an index (0 to 1) for each dimension, with higher scores indicating improved outcomes.
Visit the theme on Governance for a full conceptualisation and details on the scenario structure and interventions.
In 2020, the EAC’s security index score was below that of sub-Saharan Africa and North Africa: the REC scored 0.62, while sub-Saharan Africa's score reached 0.65, and North Africa performed the best at 0.75. In the Current Path, the EAC will continue to lag behind the performance of sub-Saharan Africa and North Africa than, but the scenario increases security considerably, so much so that the EAC’s score of 0.77 surpasses sub-Saharan Africa’s of 0.74 by 2050.
The East African region is marked by continuous periods of instability and conflict, particularly in DR Congo’s eastern regions, South Sudan and Somalia. The conflict in DR Congo has been ongoing for a number of decades, and Rwanda, Burundi and Uganda have all been involved in some capacity. The fighting has generated a large amount of refugees which has strained neighbouring countries’ budgets, infrastructure and food supply. The EAC did deploy troops to the area, but they withdrew in December 2020 due to disagreement between the DR Congo government and the REC on what the force’s mandate entailed. President Tshisekedi repeatedly criticised the EAC force as ineffective and hesitant to engage with rebel forces, while the REC maintained its troops role was “to oversee the withdrawal of armed groups from captured areas.” However, troops from SADC and the UN Organizaiton Stabilization Mission in the DRC (MONUSCO) are still actively involved in the region.
In South Sudan, inter-communal violence is rising as refugees fleeing from the civil war in Sudan make it increasingly harder for the government and aid organisations to meet humanitarian needs. Although the peace deal brokered in 2018 still holds, there is a growing fear that violence could once again erupt closer to the December 2024 elections. Lastly, Somalia continues to grapple with the al-Shabaab insurgency which has continued to resist governmental and UN attempts to displace the terrorist organisation from its bases in the South. A renewed effort launched in August 2020 has had a limited effect, with casualties continuing to rise even as droughts and widespread flooding displace millions of Somalis. The insurgency has also affected neighbouring countries such as Kenya, where al-Shabaab has successfully launched terrorist attacks in the past.
EAC members have struggled with governance effectiveness and tax collection, as discussed in Chart 27, and these feed into the REC’s poor performance for government capacity. Our modelling compiles its own capacity index to measure issues such as government revenue collection and corruption, scoring states out of 1. The EAC’s score is set to increase steadily in the Current Path, from 0.24 in 2020 to 0.36 by 2050. The Governance scenario will see the REC surpass the average for sub-Saharan Africa by 2031 and reach a score of 0.42 by 2050, 0.05 above sub-Saharan Africa’s average.
Somalia's capacity score will benefit the most from the scenario, seeing their score rise by 0.09 in 2050 compared to the Current Path. Kenya will see a small increase of 0.05, coming from a higher base, while Burundi and DR Congo will continue to experience capacity constraints will small increases coming from a low base.
The recurring problem of corruption helps explain the REC’s performance in the capacity index. The EAC’s own Organs and Institutions have been weakened by corrupt actions related to procurement processes, necessitating the adoption of the East African Community Integrity and Anti-Corruption Bill 2019. To counteract the negative effects of corruption in the REC, the bill clearly spells out what constitutes corrupt actions, proposes the creation of a mechanism which increases cooperation between National Anit-Corruption Agencies, and promotes the harmonisation and standardisation of codes of conduct for all the EAC’s Organs and Institutions.
The EAC’s members have themselves also struggled with corrupt practices for a number of years. Transparency International’s Corruption Perceptions Index is a widely used measure of the level of corruption present in a country. Only Rwanda scored above the global average of 42 out of 100 in 2020, with Somalia ranking last and South Sudan second from bottom globally. Somalia, Tanzania and Kenya are the only countries whose scores have improved since 2013, while Uganda and Rwanda have stayed the same. The largest decrease over that time occurred in DR Congo, whose score dropped by 9%, from 22 in 2013 to 20 in 2020. In the Current Path, Uganda will see its score rise to 36 by 2050 and be ranked third in the REC behind Rwanda and Tanzania, while South Sudan will see an improvement of 5 points to reach a score of 18.
The most significant incentive for decreasing the levels of corruption present with member states is the additional funds it would make available to authorities to address their current socio-economic challenges. Funds lost due to inflated procurement contracts or loss of capacity due to stolen public assets would be free to use for healthcare, education and climate change mitigation. Crucially, enforcement of anti-corruption laws must be consistent and fair to encourage compliance and remove any benefits actors might receive from corrupt actions. Greater transparency and reporting on interactions between firms and government officials is a needed step towards lower levels of bureaucratic corruption. Failure to do so means service delivery will continue to be negatively affected, which inevitably disproportionately affects the poor who have little recourse to alternative solutions.
The third pillar of the governance triangle is inclusion, which touches on the degree to which a population can participate in the political and economic processes of a country. The index scores a country out of 1, with higher scores reflecting greater gender equality. The inclusion index shows the EAC trailing sub-Saharan Africa’s average in 2020, with a score 8% below the regional average, which slowly decreases to 6.9% by 2050 in the Current Path. In the scenario, the trend is reversed, and the REC will see its score be 12% higher than sub-Saharan Africa’s by 2050 at 0.66. The increase over the Current Path will amount to 0.12 points.
DR Congo and Rwanda had the lowest scores in 2020, at 0.28 and 0.33 respectively, reflecting struggles in gender equality measures for the former and a lack of meaningful democratic representation in the latter. Kenya, Tanzania and Uganda rank as the top three performers in 2020, with Uganda expected to see the largest increase over the forecast horizon as its score increases to 0.88 by 2050. The biggest winner in the scenario will be Somalia, whose score will be 27% higher by 2050 compared to the Current Path. Kenya sees the lowest increase, as it comes from a high base in 2020. DR Congo and Rwanda will still be the lowest-ranked countries by 2050.
Two areas are particularly salient when considering inclusion in the EAC and helps explain the REC and its members’ performance: gender equality and the level of democracy. The UN’s Gender Inequality Index (GII) is a composite measure which combines data on political representation, education, health and labour force participation to gauge a country’s progress in achieving gender equality.
Another useful index is the OECD’s Social Institutions and Gender Index (SIGI), which looks at four areas relating to gender norms, attitudes and laws on the continent: access to productive and financial assets, discrimination in the family, restricted civil liberties and restricted physical integrity. Together they form the overall index score, with lower scores showing higher levels of gender equality. Rwanda is the leader in the REC across the four areas, scoring 21 points below the African average in 2020. Uganda, Kenya and South Sudan also perform better than their continental peers, while Burundi, Somalia, Tanzania and DR Congo score below the average. The REC’s members perform well in the area of access to productive and financial assets, with 6 countries outperforming the African average. However, only two score members score better than Africa in the area of restricted physical integrity, indicating an urgent need to address the norms, attitudes and laws which perpetuate violence against women in the region.
Turning to democracy, the Varieties of Democracy (V-dem) project constructs an index to measure the degree of democracy in a country termed polyarchy, defined as encompassing the electoral principle of democracy where those in power are responsive to their citizens through electoral competition. The indicator serves as the key element in any form of democracy, as conceptualised by V-dem and represents a ‘thinner’ version of democracy compared to a full, liberal democracy.
The EAC has performed below the global and African averages since 1990, but has gained ground since 2018, as democratic levels on the continent and globally continue to decline. The best performers in the REC have been Kenya, Tanzania and DR Congo, while South Sudan, Somlia and Burundi scored the lowest in 2020. Kenya and Tanzania have seen their scores increase rapidly in recent years: since President Samia Suluhu Hassan came into power in Tanzania in 2021, a series of reforms improving freedom of expression and association has significantly improved the state of democracy in the country. On the other hand, Rwanda has seen its score decline since 1990 by 3.2%. Despite strong gains economically, the government continues to quell dissent by civil society and international organisations, often citing opposing views as ‘genocide ideology’, while legitimate alternatives to the current governing party are non-existant.
Chart 29 presents GDP per capita in the Current Path and all sectoral scenarios from 2020 to 20250.
The scenario with the greatest impact on GDP per capita by 2050 is the AfCFTA scenario, followed by the Governance, Large Infrastructure and Leapfrogging, and Manufacturing scenarios. The AfCFTA scenario will increase GDP per capita to US$5 477, which is an increase of 121% compared to the Current Path for 2050. The Governance scenario will increase GDP per capita by 10%, followed by the Large Infrastructure and Leapfrogging scenario at 7%.
Full implementation of the AfCFTA would serve as a vehicle to boost trade and assist in the transformation of the EAC’s economies into produces of higher-value goods and services, moving away from their current focus on low value-added production tied to agri-processing. Freer trade under the AfCFTA is expected to increase both international exports and intra-EAC trade, unlocking greater opportunities for local and global businesses to enter into and expand throughout new markets across the region. This ultimately leads to welfare gains as resources flow to their most productive uses and lower consumer prices, driving economic growth, welfare gains and poverty reductions.
The Manufacturing scenario benefits economic growth in myriad of ways: greater government regulation of the business environment will create an enabling environment for businesses to enter the manufacturing sector; growth in formal jobs, benefitting workers through greater employment security, benefits and labour law protections; and structurally transform the EAC’s economies to focus on the production of higher value-added goods and developed a manufacturing sector linking forwards and backwards to various sector of the economy, and creating broad-based economic growth.
The Governance scenario, in turn, will spur on welfare gains through its focus on increasing government capacity, which will improve the ability of the EAC’s members to collect tax, thereby boosting revenue, reducing the need for borrowing and making funds available for targeted interventions aimed at promoting growth. The increase in stability modelled in the scenario will also benefit economic growth through greater predictability for international investors and decreased internal displacement of citizens, leading to sustained, uninterrupted economic activity and reduced demand for humanitarian assistance.
Unique national contexts mean countries will benefit more from different scenarios. In Burundi and Somalia, the Agriculture scenario has the largest the impact for most of the forecast horison, as these two countries have significant unrealised potential in the agricultural sector. Kenya, DR Congo, Rwanda, South Sudan and Tanzania will all benefit most from the freer trade of the AfCFTA, with DR Congo’s GDP per capita rising by 57%, a particularly impressive increase by 2050. Uganda benefit most from the Governance scenario, as GDP per capita rises by 12.7%.
Chart 30 shows poverty in the Current Path and all sectoral scenarios from 2020 to 2050.
The EAC will benefit most from the AfCFTA scenario in terms of poverty reduction, followed by the Manufacturing and Governance scenarios. The AfCFTA scenario reduces extreme poverty by 6.8 percentage points compared to the Current Path in 2050, followed by Manufacturing at 4.7 percentage points and Governance at 2.9 percentage points. In absolute terms, the AfCFTA reduces the number of poor people by 44.2 million people, followed by the Manufacturing scenario 30.8 million and the Governance scenario at 19 million. Clearly, an strong emphasis on finalising the full implementation of the AfCFTA is crucial for the REC, as the AfCFTA scenario also increase GDP per capita by the greatest amount compared to other scenarios. A pivot towards increased industrialisation will also benefit the EAC when it comes to poverty reduction, mostly due to the initial benefit of increased government transfers aimed at compensating for job losses in the Manufacturing scenario. Long-term, the positive effects of a larger manufacturing base will increasingly help to combat poverty through higher quality jobs and growing forward and backward integration with other sectors in the economy. Improving governance through anti-corruption campaigns and the implementation of applicable legislation will enable government to be more effective at affecting growth and decreasing poverty.
The Manufacturing scenario is the most effective at reducing poverty in Rwanda and Uganda, while the Agriculture scenario reduces poverty the most in Burundi and the AfCFTA scenario in DR Congo, Kenya and South Sudan. The Financial Flows scenario have the largest effect in Somalia, down to an increase in foreign aid, while Tanzania will benefit most from the Education scenario respectively. The wide range of scenarios showcase the differing national contexts and the individual interventions each government must adopt to positively affect its citizens.
Chart 31 presents GDP in the Current Path and in the Combined scenario, from 2020 to 2050. The data is in US$ 2017 and at market exchange rates.
The Combined scenario consists of the combination of all eight sectoral scenarios, namely Governance, Demographics and Health, Education, Large Infrastructure and Leapfrogging, Agriculture, Manufacturing, AfCFTA and Financial Flows.
In the Combined scenario, the EAC’s combined GDP will reach US$3.4 trillion by 2050, a 123% increase over the Current Path of US$1.5 trillion. The impressive performance of the REC is driven by substantial increases in DR Congo, Kenya, Tanzania and Uganda, whose economies grow by US$809 billion, US$370 billion, US$284 billion and US$245 billion respectively, compared to the Current Path in 2050. DR Congo will become the dominant economic force, constituting 31% of the REC’s combined GDP, an significant increase from 17% in the Current Path. Kenya will become the second-largest economy, reaching 25.3% of the EAC’s total economic size, followed by Tanzania at 19% and Uganda at 15%.
Chart 32 presents the value added by sector in the Current Path and in the Combined scenario, from 2020 to 2050. The data is in US$ 2017 and as a % of GDP.
Over the forecast period, the composition of the EAC economy will change substantially: the agriculture sector will see its share of value added as a percentage of GDP drop from 22.6% in 2023 to 6.5% by 2050. In the Combined scenario, the decrease is larger, with the sector making up 5.2% of the economy by 2050. The Manufacturing sector will also increase in importance, with its contribution in the Current Path growing from 16.7% to 21.2% over the forecast period; in the Combined Scenario this ticks up to 24.4%. Lastly, the services sector contribution will swell from 49% to 57.8% in the Current Path, while it increases slightly to 50.4% in the Combined scenario by 2050.
The composition of individual countries’ economies will significantly shift over the forecast horizon, with every state seeing their agriculture sector decrease in contribution and their services sector grow in influence. South Sudan is the only country where the the agriculture sector sees a decrease in value added as a percentage of GDP smaller than 10 percentage points in 2050; the sector was already small at 5.6% in 2020. The largest increase in contribution from services will be in Tanzania, where the sector makes up 13.4 percentage points more of the economy in 2050 compared to 2023, rising from 51% to 64% in the Current Path. A few countries will also see their manufacturing sector’s contribution to the economy grow, with South Sudan’s reaching 29% of total value added by 2050, up 20 percentage points from 11% in 2020. Burundi will also see its manufacturing sector’s contribution grow by 9.2 percentage points to 19.7% by 2050. South Sudan also diversifies away from the energy sector and the exporting of oil, as its contribution to the economy drops from 39% to 19%.
The Combined scenario impacts countries in differing ways: South Sudan and Burundi will see their manufacturing sector become even more important than in the Current Path. In South Sudan, 36.5% of total value added will stem from manufacturing by 2050 in the Combined scenario, compared to 29% in the Current Path. SImilarly, Burundi’s manfacturing sector will contribute 25% of value added, up from 20% in the Current Path. Somalia’s agriculture sector will constitute even less in the Combined scenario by 2050, shrinking from 17% of total value added to 10% by 2050.
In terms of growth in the size of each sector in the Combined scenario, the largest increase are in the services sector. In 2050, Kenya’s services sector will be US$228 billion larger compared to the Current Path, followed by DR Congo with US$232 billion and Tanzania with an increase of US$170 billion.
DR Congo will also see the size of its manufacturing sector grow appreaciably, rising by US$209 billion in 2050 compared to the Current Path. Uganda’s manufacturing sector will grow by US$104 billion and Kenya and Tanzania’s by US$75 billion and US$71 billion respectively. Although agriculture will see it’s share of total value added fall over the forecast horizon, Kenya, DR Congo, Tanzania and Uganda’s agriculture sectors will grow in absolute terms. Kenya’s will grow by US$32 billion, followed by Tanzania at US$20 billion, DR Congo at US$13 billion and Uganda at US$7 billion.
Chart 33 presents the size of the informal sector as per cent of the total economy in the Current Path and in the Combined scenario, from 2020 to 2050.
The informal sector is an important source of employment in the EAC, as well as a means of survival for a large part of the population. In the Combined scenario, the size of informal labour force will rapidly decrease from 72% in 2023 to 23% in 2050, 34.5 percentage points below the Current Path for the same year. As a result, the informal economy will also decrease in size, reaching the 13% of GDP by 2050, 14.9 percentage points lower than in the Current Path.
DR Congo will see the largest drop in the size of its informal sector in both the Current Path and Combined scenario, while Kenya, coming from a much lower base, will see the smallest decreases. By 2050, the size of DR Congo’s informal economy will equate to 6.9% in the Combined scenario, 26.1 percentage points lower than in the Current Path. South Sudan will see strong progress in the Combined scenario, as its informal economy shrinks to 2.1% of GDP, 27.2 percentage points lower than in the Current Path for 2050. In the Combined scenario. Kenya’s informal labour force will equate to 6.9% of the total labour force, 21.2 percentage points lower than the Current Path for 2050.
Chart 34 compares life expectancy in the Current Path with the Combined scenario from 2020 to 2050.
The average life expectancy in the EAC stood at 66 years in 2020, 0.6 years above sub-Saharan Africa’s average but 7.1 years below that of North Africa. In the Combined scenario, the REC’s life expectancy will climb to 74.3 by 2050, which is 1.5 years above the Current Path. The EAC will have surpassed the sub-Saharan African average of 73.3 and closed the gap to North Africa’s 77.1.
In 2020, Rwanda had the highest life expectancy at 68.8 years, followed by Kenya and Tanzania. Somalia lagged far behind at 59.3 years, the fifth lowest in Africa. The gap to Burundi, who performed the next worst in the REC at 64.3 years, stood at 5 years; by 2050, Somalia will close the gap to 1.5 years with a life expectancy of 69.7 years in the Current Path. The Combined scenario benefits South Sudan and Somalia the most, increasing their life expectancy by 2.8 and 1.9 years respectively compared to the Current Path for 2050.
Chart 35 compares the Gini coefficient in the Current Path with the Combined scenario, from 2020 to 2050.
The EAC is a highly unequal region, with impressive economic growth failing to translate to meaningful improvements in quality of life for the majority of its citizens. In particular, South Sudan, Uganda and Rwanda rank among the top 40 most unequal countries in the world, while all eight members rank above the world’s average in terms of their Gini coefficient. The richest 10% of the population received 47% of pre-tax income in 2021, and while taxation is progressive, corruption and a lack of budget transparency has hampered anti-inequality measures. The EAC’s average Gini in 2023 was 0.41, and will decrease to 0.33 in the Combined scenario by 2050, a 18% drop compared to the Current Path.
The most unequal country in the EAC in 2023 was South Sudan, with a Gini score of 0.45, followed by Rwanda and Uganda. Somalia and Burundi had the lowest scores at 0.37. The Combined scenario dramatically reduces inequality in the REC: South Sudan’s Gini score will drop to 0.27 by 2050, 39% below the Current Path. Similarly, DR Congo will see its score drop 28% to 0.28 by 2050, while Tanzania will see the smallest reduction of 4.9%.
Chart 36 compares carbon emissions in the Current Path with the Combined scenario from 2020 to 2050.
East Africa has borne the brunt of climate change-related extreme weather events for some time, and recent droughts and floods have severely threatened the livelihoods and survival of millions of people. The region has seen contrasting trends play out at the same time: as areas in South Sudan were hit with abnormal flooding and southern Tanzania saw wetter-than-normal rainfall seasons, Kenya, Uganda and Somalia were battling with droughts caused by drier-than-normal rainy seasons. Additionally, East Africa has experienced above-average rises in temperatures compared to other global regions: while most of the world has seen its temperatures rise by 1.1 degrees Celsius compared to pre-Industrial Revolution levels, East Africa has seen rises above 2 degrees. The effect of this on long-term growth could be disastrous: an AfDB study found that climate change-related risks have the potential to decrease median GDP per capita in the region by between 10% and 16% by 2050. Particularly concerning is the effect climate change will have on the agriculture sector, which is the main livelihood of the majority of the EAC’s population and a significant contributor to economic growth.
Despite the devastating impact of climate in the region, the EAC as a region is a low emitter of carbon emission. In 2023, the EAC emitted 21 million tons of carbon, equaling 0.2% of global emissions. By 2050, the EAC will increase its emissions to 128 million tons and the Combined scenario increases the EAC’s carbon emissions considerably, due to the increased economic activity the scenario entails: by 2050, the REC will produce 67% more carbon at 214 million tons.
In 2023, Kenya being the largest economy in the region emitted the most carbon in the EAC, at 7.2 million tons, followed by Tanzania and Uganda. By 2050, the picture will have shifted, and Tanzania, Uganda and DR Congo will be the top three emitters, with Kenya dropping to fourth. Kenya will continue to produce most of its energy through renewable sources, while Tanzania and Uganda will continue to rely on oil and gas, adding to their carbon emissions output. DR Congo will experience rapid economic growth in the Combined scenario, and coupled with large increases in population size, will significantly grow its carbon emissions. The Combined scenario will have the largest effect in DR Congo, raising emissions by 32 million tons compared to the Current Path for 2050. Rwanda, South Sudan, Somalia and Burundi will remain tiny emitters in the Combined scenario: all four will emit less than 10 million tons by 2050.
Chart 37 compares energy production from 2020 to 2050 in the Current Path with the Combined scenario. Production is done in six types, namely oil, gas, coal, hydro, nuclear and other renewables. The data is converted into billion barrels of oil equivalent (BOE) to allow for comparisons between different sources. Note that energy production could be for domestic use or export.
The EAC relies predominantly on oil, gas, and coal for its energy production needs, and the REC aims to create an enabling environment for the efficient extraction, refinement and use of these fossil fuels as it achieves energy self-sufficiency. A number of oil and gas pipeline projects have been identified in this regard: the East African Crude Oil Pipeline (EACOP), which is currently under construction, will run from Lake Albert in Uganda to the port of Tanga in Tanzania; Kenya and Uganda have recently signed an MoU to extend an oil pipeline from Nairobi to Kampala, with the EAC hoping it could be extended to Rwanda and Burundi in the future; Tanzania has signed a deal with European companies to export natural gas from its off-shore deposits, starting after 2030. Furthermore, current planning to meet future energy demand needs heavily includes coal-fired power plants, with a total of 100GW of new plants planned for the next 20 years, if existing power pool master plans are implemented.
Even before these planned projects aimed at increasing fossil fuel production and exportation, the REC is a leader when it comes to renewable energy on the continent. In 2023, 28% of EAC’s energy came from hydro, and 45% from other renewables (solar, wind and geothermal primarily). The region also has enormous potential to significantly boost its renewable energy production: IRENA estimates that the region could meet up to 63% of its electricity needs through renewables by 2040, due in large part to underutilised potential for solar and wind power. Additionally, the potential impact of importing energy production for the Grand Ethiopian Renaissance Dam (GERD) and finally completing the Grand Inga 3 dam is sizable and would contribute significantly in meeting the region’s growing energy demand. The World Bank warns, however, that the region first needs to deal with certain obstacles to investment, such as political instability, weak governance, inadequate regulatory frameworks and insufficient financing.
Nuclear energy production is also being prioritised by a number of EAC states, with Rwanda, Kenya, Uganda and Tanzania at varying phases of nuclear reactor projects. All these projects will only see generation capacity added to the grid in the early 2030’s, if no delays in construction and project implementation occur. Reservations exist regarding the timeframe and financial costs involved to generate nuclear energy; for example, upgrading the transmission infrastructure of the current electricity grid is a major constraint to future nuclear energy development. Countries need to consider the financial implications of financing these major projects, with large loans and prohibitive interest payments potentially constraining government spending on other development priorities.
The energy production profile shows that the EAC is on course for a transition away from oil towards gas, hydro and other renewables. In 2023, oil made up 51% of energy production, followed by 16% for gas, 13% for other renewables, 13% for hydro, while coal made up only 7%. By 2050, the shares would have shifted significantly: oil will decline to 31%, while hydro and other renewables increase to 14% and 32%, respectively. Gas will also rise to 22%, while coal shrinks to 1% by 2050. The REC will face continuing shortages of energy, as energy demand further outstrips production. In 2023, the EAC had a shortage of 90 million BOE, which will grow to 820 million BOE in the Current Path. The Combined scenario worsens this trend, with the shortfall growing to 1.5 billion BOE by 2050. Generating enough energy to fuel the economic growth possible in the Combined scenario is a key constraint the EAC’s members will have to overcome if they are to fully benefit from the interventions proposed in the scenario.
The individual energy mixes and amount of energy produced of the EAC’s members vary considerably: 17.6% of all the energy produced in the REC comes from South Sudan’s oil, followed by 12.4% from Kenya’s other renewables, 10.3% from Tanzania’s oil and 9.8% from DR Congo’s oil. The positive trend towards renewables does not however solve the shortfall in energy most EAC members are experiencing. By 2050, 7 members’ energy deficits will have grown in the Combined scenario, except South Sudan, where increased oil production sates demand. Uganda will have the largest deficit, at 340 million BOE, followed by Tanzania and Kenya at 330 million BOE and 280 million BOE respectively
Chart 38 summarises the policy recommendations for the EAC.
The EAC is a Regional Economic Community comprised of eight member states including recently new members (DR Congo and Somalia) who differ significantly on various fronts. Additionally, the organisation must confront the challenges new opinions, priorities and development shortfalls the members bring. Aligning development plans and trajectories will remain a obstacle to regional growth as countries battle with unique challenges. Nevertheless, the EAC serves as a useful space for convening member states to increase coordination in various sectors, such as energy, infrastructure and migration, as well as agriculture. Full buy in from national governments to capacitate the REC while adopting regional development objectives is a top priority, and promises to spur on shared growth. Crucially, instability concerns in Somalia, South Sudan and the eastern DR Congo must be addressed at the REC level, with the organisation serving as an important forum to discuss joint responses to security challenges.
The EAC will grow steadily on the Current Path, with DR Congo and Rwanda in particular on their way towards meaningful development. However, the rate of change will not sufficiently address the needs of a rapidly expanding population, and timely interventions are needed to address extreme poverty and income inequality. To this end, a number of key interventions must be pursued to create a region capable of providing for its citizens:
- Significant investment in WaSH infrastructure is needed, especially for improved sanitation facilities. EAC members must commit to and implement the Principles of Action they laid out at the WaSH Leadership Summit in 2023 to combat the REC’s low levels of access. These principles focus on:
- coordinating national budget priorities around improved WaSH,
- removing governance bottlenecks,
- incentivising sector providers to improve efficiency,
- generating increased funding from the private sector and climate finance,
- designing WaSH systems which are climate- and disaster-resillient.
- Governments should prioritise the implementation for the EAC’s Food and Nutrition Security Action Plan to improvefood security and reduce dependence on food imports to meet demand. Crucial to the plan’s success is the harmonisation of regional and national development plans aimed at improving agricultural productivity.
- Increased funding for education is needed, focusing specifically on the motivation of teachers, provision of teaching and learning materials, creation of sound learning curriculums and improvement in infrastructure. Members should share best practices and adopt strategies aimed at increasing classroom-to-pupil ratios, developing gender-sensitive teaching policies and reducing the distance needed to travel to get to school.
- States must work to align their industrial policies under the EAC Industrialization Policy and Strategy, as increased harmonisation will lead to a stronger regional market for manufacturing firms to exploit. The EAC should focus, in the short term, on agro-processing industries before diversifying into higher-value products in the medium to long term.
- Implementing frameworks aimed at increasing trade facilitation, strengthening competition policy and law, and countering the dumping of goods will foster regional trade and improve the level of trade openness in the REC. In addition, all members must be encouraged and aided in the full implementation of the AfCFTA.
- Promote member-to-member investment by implementing certain reforms that target improved tax collecting, finance sector development and stricter controls over illicit financial flows. To this end, emphasise the implementation of the recommendations set out in the EAC’s Sixth Development strategy which clearly set out actionable steps towards improving the REC’s investment environment and making the financial sector more efficient.
- To provide a more stable business environment, the EAC’s development strategy has as key targets the promotion of a regional framework of Good Governance and the implementation of cooperation arrangements centring around governance, rule of law and access to justice. Adherence to the East African Community Integrity and Anti-Corruption Bill of 2019 is crucial in this regard.
- Solving regional instability remains a key target in the REC, with the EAC serving as an important forum for its members to address and solve the causes of regional conflicts affecting multiple members. To this end, properly capacitating those forces tasked with maintaining peace while simultaneously addressing the roots causes of instability is crucial.
- Although some members perform well in governance inclusion, the REC must improve gender equality outcomes, specifically related to violence against women. Public awareness campaigns, gender-sensitive teaching material and strong implementation of legal frameworks are needed to better protect women from abuse.
Governments must refrain from shrinking the space within which civil society can act and allow citizens to meaningfully participate in democratic processes. Furthermore, the right to association and freedom of expression must be protected to ensure citizens have the ability to positively and constructively voice their opinions and grievances.
Endnotes
The Visa Openness Index report in 2023 did not include Somalia as a EAC member, as it only joined the REC in early 2024.
UN-Habitat defines living in a slum as lacking access to improved water and improved sanitation, sufficient living area and quality/durability of structure.
The figures in IFs uses a method developed by Elgin and Oztunali (2008), and Schneider and Ernste (2012). A more recent study by Murunga et al. (2021), using alternative methods, found the size of the informal economy to be over 32%. Thus, IFs potentially underestimates the size of the sector and its relative importance in Kenya, where 82.9% of total employment occurred in 2022.
The OECD defines child marriage as: “Percentage of girls aged 15-19 years who have been or are still married, divorced, widowed or in an informal union”
Trade openness is measured as the sum of export and imports over total GDP
We model the impact of improving rural connectivity through greater access to rural roads on the agriculture sector in our Agriculture theme and in the Agriculture scenario above.
Page information
Contact at AFI team is Du Toit McLachlan
This entry was last updated on 21 July 2025 using IFs 8.26.
Reuse our work
- All visualizations, data, and text produced by African Futures are completely open access under the Creative Commons BY license. You have the permission to use, distribute, and reproduce these in any medium, provided the source and authors are credited.
- The data produced by third parties and made available by African Futures is subject to the license terms from the original third-party authors. We will always indicate the original source of the data in our documentation, so you should always check the license of any such third-party data before use and redistribution.
- All of our charts can be embedded in any site.
Cite this research
Du Toit McLachlan (2026) EAC. Published online at futures.issafrica.org. Retrieved from https://futures.issafrica.org/geographic/recs/eac/ [Online Resource] Updated 21 July 2025.
