 Rwanda
Feedback welcome
Our aim is to use the best data to inform our analysis. See our Technical page for information on the IFs forecasting platform. We appreciate your help and references for improvements via our feedback form.
This page presents a comprehensive analysis of Rwanda. The analysis outlines the nation's rapid development, examining various sectoral scenarios and their potential impacts on future pathways through 2043. It discusses Rwanda’s significant sectoral improvements and potential, as well as the need to balance this growth with sustainable practices and address challenges of poverty and inequality. The analysis aims to provide policymakers and researchers with insights to guide the country towards a more prosperous future.
For more information about the International Futures modelling platform that we use for the development of the various scenarios, please see About this Site.
Executive Summary
This page begins with an introductory assessment of the country’s context, looking at current population distribution, social structure, climate and topography.
- Rwanda, geographically one of Africa's smallest countries, is bordered by Burundi, the Democratic Republic of the Congo (DR Congo), Uganda and Tanzania. The country is nestled in the heart of the African Great Lakes Region. In 2019, Rwanda had a population of 12.6 million people, and its density of 5.1 people per hectare makes it the second most densely populous country in Africa after Mauritius.
- Rwanda’s Vision 2050, launched in 2015, aspires to elevate the country to upper-middle-income status by 2035 and high-income status by 2050, providing a high quality of life for all citizens.
- Rwanda's GDP, measured in market exchange rates (MER), more than quadrupled from US$3.2 billion in 1990 to US$13.0 billion in 2019, making the country’s economy the sixth largest in East Africa and the 34th-largest in Africa. From 2009 to 2019, Rwanda’s GDP grew at an average of 7.2%.
This section is followed by an analysis of the Current Path forecast for Rwanda which informs the country’s likely current development trajectory to 2043. It is based on current geopolitical trends and assumes that no major shocks would occur in a ‘business as usual’ future. This section compares progress on the Current Path with eight sectoral scenarios. These are Demographics and Health; Agriculture; Education; Manufacturing; the African Continental Free Trade Area (AfCFTA); Large Infrastructure and Leapfrogging; Financial Flows; and Governance. Each scenario is benchmarked to present an ambitious but reasonable aspiration in that sector.
- Generally, governance in Rwanda is better than in most African countries, especially those within the low-income group. Rwanda is performing well on two of the three governance indices, namely in security and capacity, compared to its peers on the continent but does poorly on inclusion. The Governance scenario improves security by 13% above the 2043 Current Path, capacity by 32% and inclusion by 41%.
- In the Demographics and Health scenario, Rwanda enters a potential demographic dividend one year earlier than on the Current Path and achieves a maximum ratio of working-age population to dependants of 2:1 by 2043. The scenario reduces Rwanda’s infant mortality rate to 6.1 deaths per 1 000 live births by 2043 which is almost seven deaths fewer than in the Current Path. In addition, the scenario increases life expectancy to 76.6 years by 2043, which will be 1.7 years more than the Current Path.
- In 2019, the mean years of adult education in Rwanda were 4.7 years, almost equal to the average of 4.6 years for low-income countries on the continent. In the Education scenario, the mean years of adult education will rise to 7.1 by 2043, which will be 0.3 years more than in the Current Path.
- In 2019, the average test score for primary students in Rwanda stood at 24.7 slightly below the average of 27.2 for its income peers in Africa. The Education scenario will increase average test scores for primary learners to 47.5 in 2043, which is 5% above the Current Path.
- By 2043, the proportion of the rural population with access to an all-weather road will improve to 67%, above the average of 52% for low-income African countries. In the Large Infrastructure and Leapfrogging scenario, the proportion of the rural population with access to an all-weather road will rise to 70% by 2043.
- In 2019, the average crop yield per hectare in Rwanda stood at 7 metric tons, which was 2.5 times higher than the average of low-income countries in Africa and only second to low-income Malawi at 7.8. On the Current Path, yield per hectare will rise to 9.9 tons by 2043. In the Agriculture scenario, yield per hectare will increase to 13.6 metric tons by 2043 — 3.8 metric tons per hectare higher, or a 38% improvement.
- In the Manufacturing scenario, the manufacturing sector’s contribution to GDP significantly increases over the period. By 2043, the sector will contribute about 36% of GDP, equivalent to US$21.7 billion, in the Manufacturing scenario, almost twice its contribution in the Current Path.
- The AfCFTA scenario leads to a faster improvement in Rwanda’s trade balance than the Current Path. By 2043, Rwanda’s trade deficit in the Current Path will constitute about 8.5% of GDP, whereas, in the same year, the AfCFTA scenario will mitigate this situation leading to a deficit of 7.6% of GDP. These figures suggest that Rwanda stands to benefit from trade liberalisation through the full implementation of the AfCFTA.
- In 2019, the government’s total revenue in Rwanda was estimated to be US$3.4 billion, equivalent to 26.3% of GDP. In the Financial Flows scenario, government revenue will rise to US$18.7 billion in 2043, representing 27.1% of GDP. Compared to the Current Path, the Financial Flows scenario can improve government revenue in Rwanda by almost an additional US$3.3 billion by 2043.
The third section proceeds with a Combined scenario analysis (the sum effect of all eight scenarios) and compares the impact of each of the eight sectoral scenarios on key indicators (economy, poverty and inequality, carbon emissions).
- Rwanda’s GDP will increase to US$126.7 billion in the Combined scenario by 2043, which is more than double the US$59.6 billion in the Current Path.
- In the Combined scenario, Rwanda’s GDP per capita will increase to US$5 109 by 2035. This will be US$1 565, or 44%, higher than the projection of US$3 544 on the Current Path and US$1 073, or 27%, more than the target of US$4 036 set for 2035 indicated in the Vision 2050 blueprint.
- The structure of the Rwandan economy will undergo significant transformation in the Combined scenario. By 2035, the service sector will still be the largest contributor to GDP at 54% although this will be lower than the Current Path of 60% but higher than the target of 49% in Vision 2050. The manufacturing sector will be the second-largest contributor to GDP in the scenario by 2035 with a share of 22% — higher than the Current Path of 14% but below the 24% target in Vision 2035. The share of the agriculture sector will decline to 11% in the Combined scenario compared to 12% in the Current Path in 2035.
- In the Combined scenario, both the number and proportion of poor people in Rwanda will significantly decline. By 2043, about 403 000 people in the country will be living in extreme poverty. This means that, compared to the Current Path, 3.1 million more people could be lifted out of poverty by 2043 in this scenario. This is equivalent to a decline of 15.5 percentage points compared to the Current Path of 2.1% in 2043.
- In the Combined scenario, life expectancy will increase to 75.2 years by 2035, which will be 1.5 years higher than the country’s Current Path in the same year and about 3.5 years higher compared to the target of 73.1 years set in Vision 2050. By 2050, the average life expectancy will rise to 78.7 in the scenario, which will be about two years more than the Current Path and almost six years more than the target of 73 years in Vision 2050. In fact, in the Combined scenario, Rwanda achieves its Vision 2050 target on life expectancy as early as 2029.
- In 2019, Rwanda’s Gini coefficient was 0.44. By 2035, it will improve to 0.42 and will improve further, reaching 0.41 by 2050 on the Current Path. In the Combined scenario, inequality in Rwanda will reduce more rapidly than on the Current Path, reaching 0.36 by 2035 and 0.32 by 2050.
- In 2019, Rwanda released about 1 000 tons of carbon, reflecting the country's low carbon emissions. On the Current Path, carbon emissions will quintuple to 5 000 tons by 2043 from their low base in 2019. In the Combined scenario, Rwanda’s total carbon emissions will rise to 14 000 tons and will be twice higher than what is estimated in the Current Path by 2050.
We end this page with a summarising conclusion offering key recommendations for decision-making. Despite its remarkable improvements in various sectors such as education, infrastructure and economic growth, Rwanda needs to balance this rapid development with sustainable practices, particularly in addressing environmental sustainability and ensuring that economic growth translates into widespread poverty reduction and reduced inequality.
All charts for Rwanda Development Futures
- Chart 1: Political map of Rwanda
- Chart 2: National Development Plan of Rwanda - Rwanda Vision 2050
- Chart 3: GDP (MER) in Current Path, 1990–2043
- Chart 4: Informal sector value in Current Path, 2019–2043
- Chart 5: Diagram of Current Path and sectoral scenarios
- Chart 6: Governance scenario
- Chart 7: Governance indices in Current Path forecast and Governance scenario, 2043
- Chart 8: Population structure in Current Path forecast, 1990–2043
- Chart 9: Population distribution map, 2022
- Chart 10: Urban and rural population in Current Path forecast, 1990–2043
- Chart 11: Demographics and Health scenario
- Chart 12: Demographic dividend in Current Path forecast and Demographics/Health scenario, 2019–2043
- Chart 13: Infant mortality in Current Path forecast and Demographics/Health scenario, 2019 –2043
- Chart 14: Education scenario
- Chart 15: Mean years of education in Current Path forecast and Education scenario, 2019–2043
- Chart 16: Large Infrastructure and Leapfrogging scenario
- Chart 17: Improved cookstove usage in Current Path forecast vs Large Infra/Leapfrogging scenario, 2019–2043
- Chart 18: Rural road access in Current Path forecast and Large Infra/Leapfrogging scenario, 2019–2043
- Chart 19: Agriculture scenario
- Chart 20: Agriculture production/demand in Current Path and Agriculture scenario, 1990–2043
- Chart 21: Manufacturing scenario
- Chart 22: Value added by manufacturing sector in Current Path forecast and Manufacturing scenario, 2019–2043
- Chart 23: Employment in manufacturing sector in Current Path forecast and Manufacturing scenario, 2019–2043
- Chart 24: AfCFTA scenario
- Chart 25: Trade balance in Current Path forecast and AfCFTA scenario, 2019–2043
- Chart 26: Financial flows scenario diagram
- Chart 27: Government revenue in Current Path forecast and Financial Flows scenario, 2019–2043
- Chart 28: GDP per capita in Current Path forecast and scenarios, 2019–2043
- Chart 29: Poverty in Current Path forecast and all scenarios, 2019–2043
- Chart 30: GDP in Current Path forecast and Combined scenario, 2019–2050
- Chart 31: GDP per capita in Current Path forecast and Combined scenario, 2019–2050
- Chart 32: Value added by sector in Current Path forecast and Combined scenario, 2019, 2035 and 2050
- Chart 33: Poverty in Current Path forecast and Combined scenario, 2019–2050
- Chart 34: Life expectancy in Current Path forecast and Combined scenario, 2019–2050
- Chart 35: Domestic Gini in the Current Path forecast and Combined scenario, 2019–2050
- Chart 36: Carbon emissions in Current Path forecast and Combined scenario, 2019–2050
- Chart 37: Recommendations
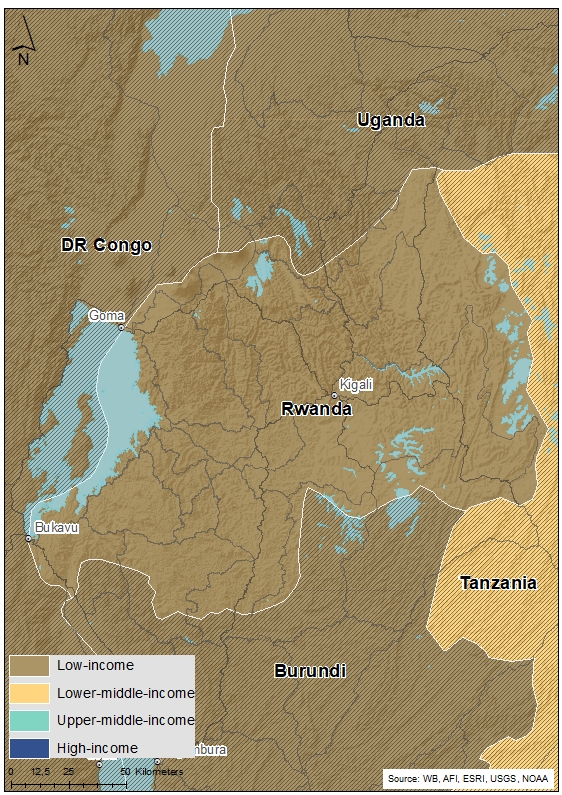
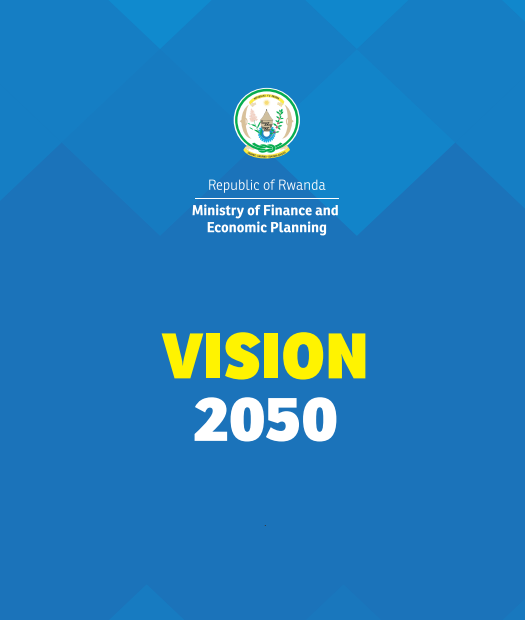
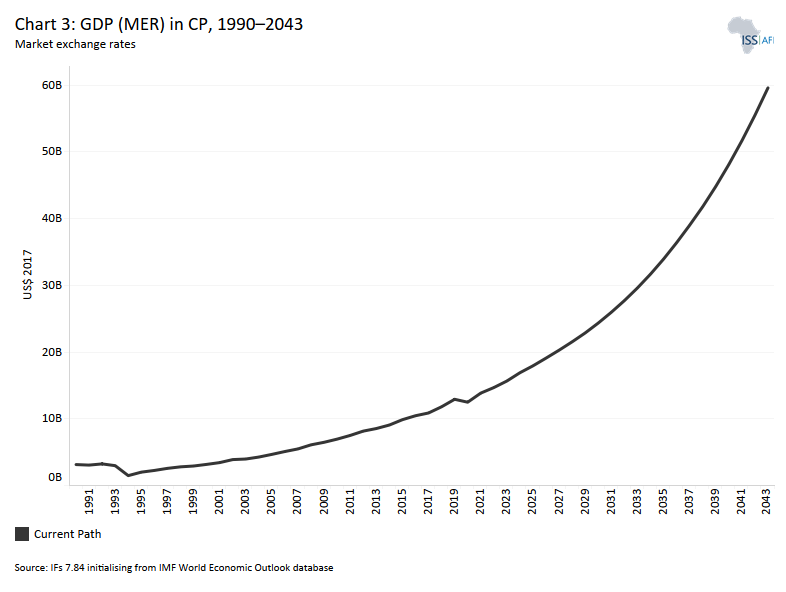
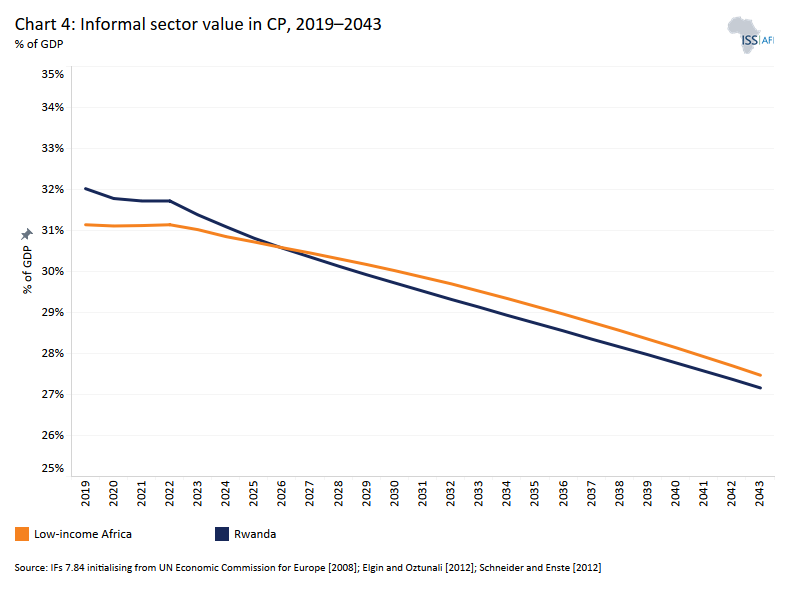
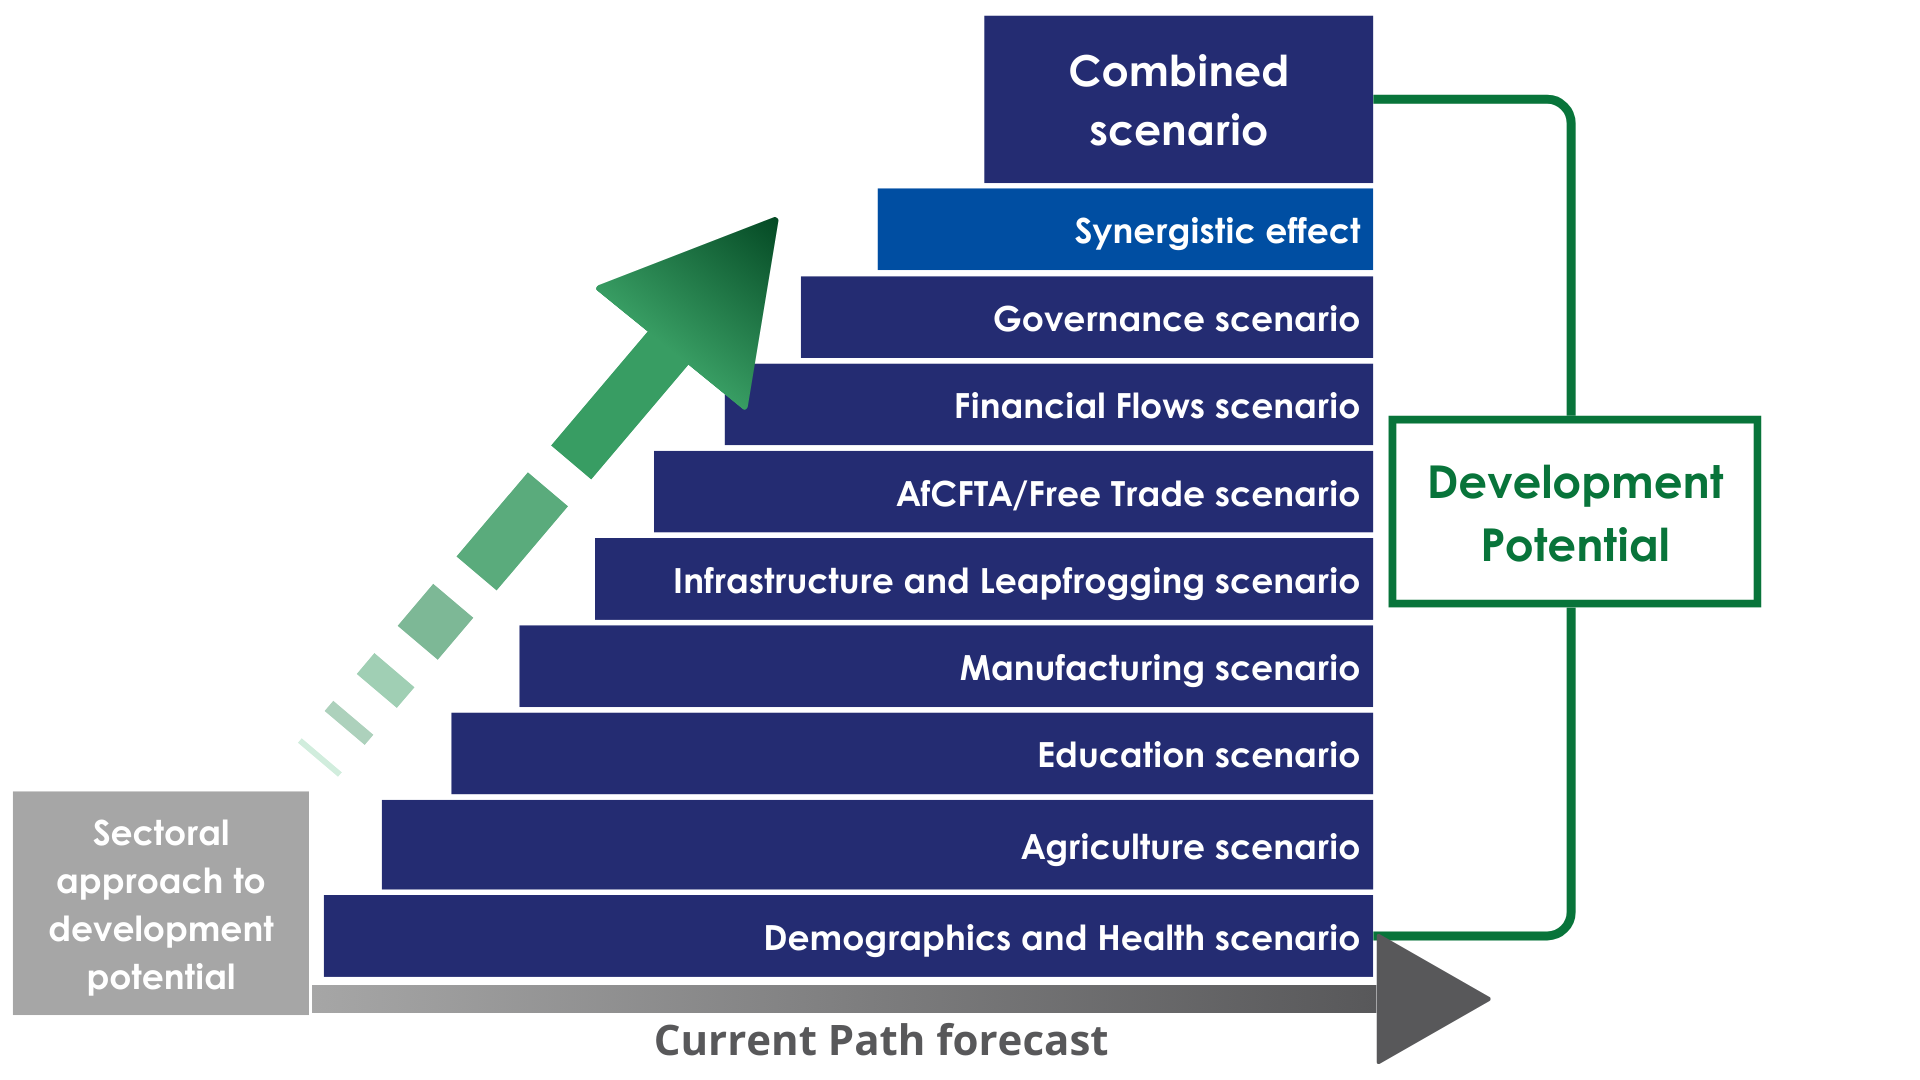
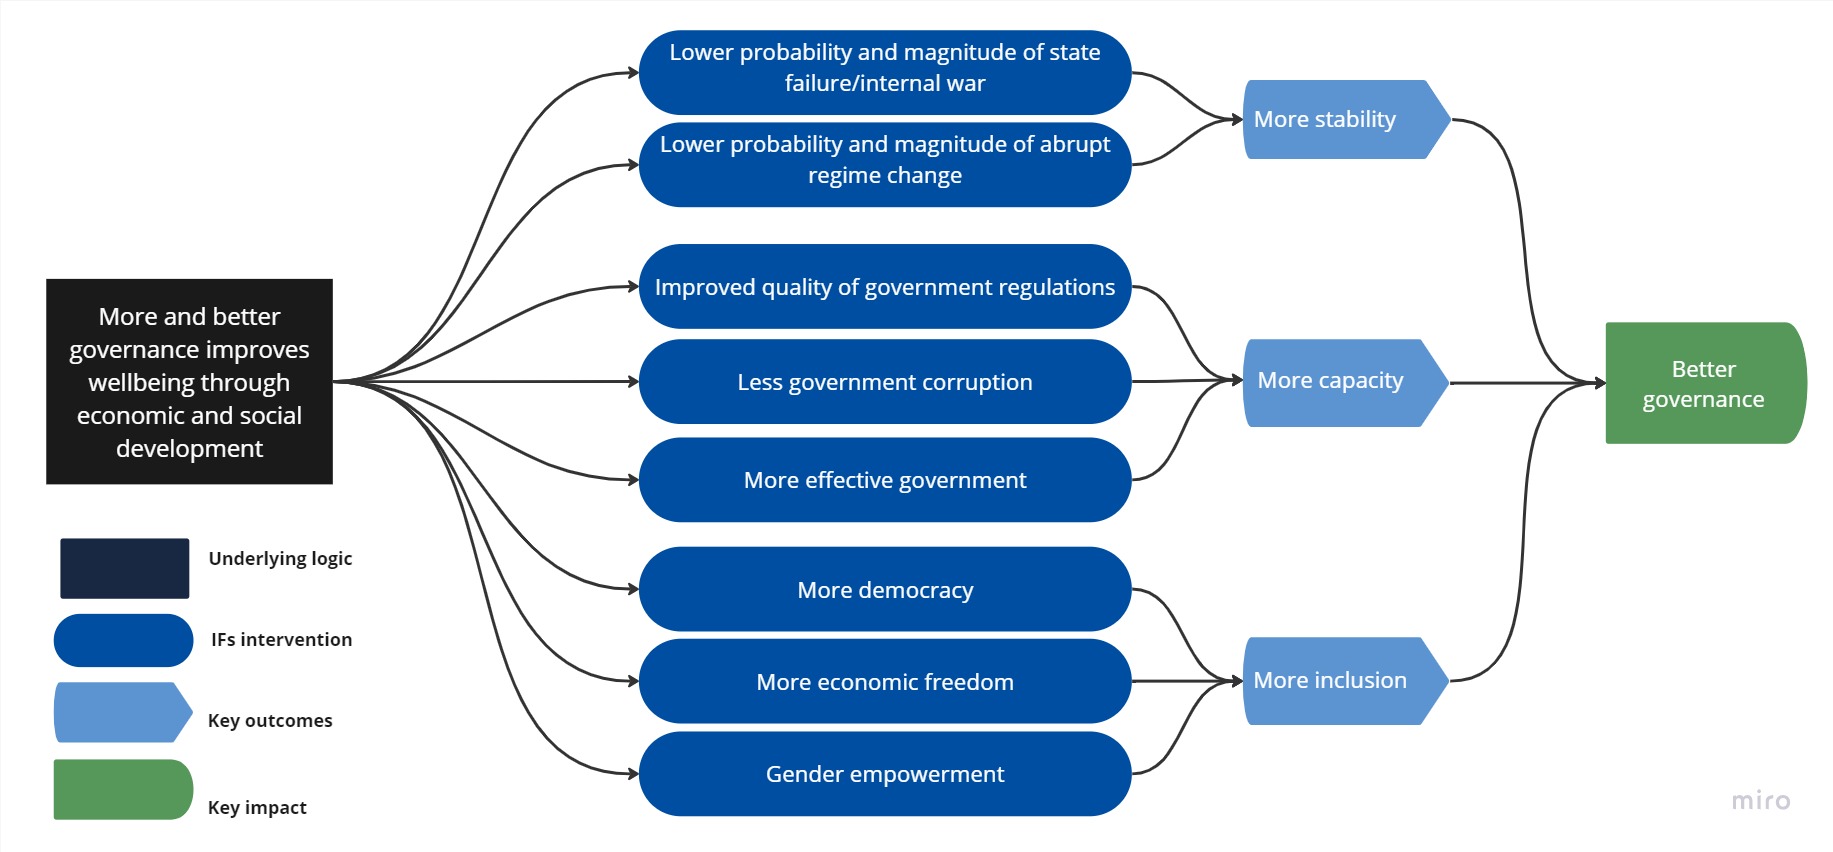
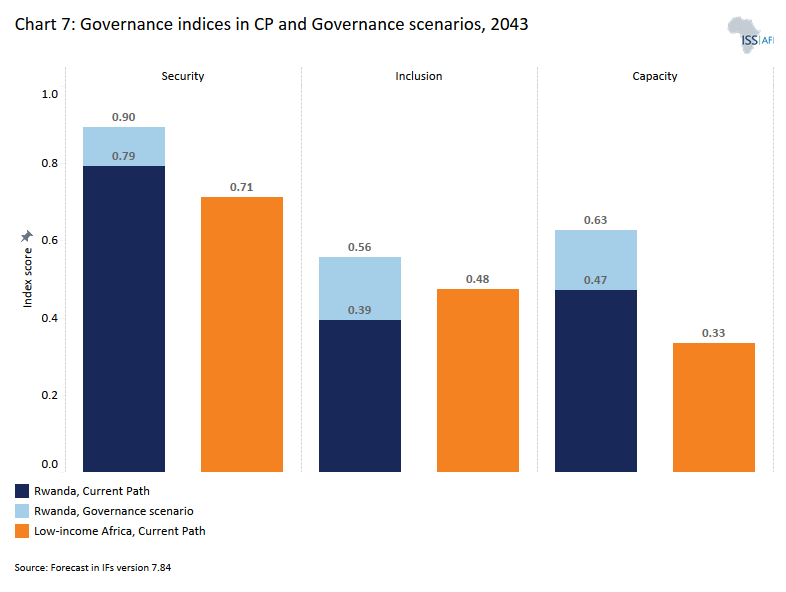
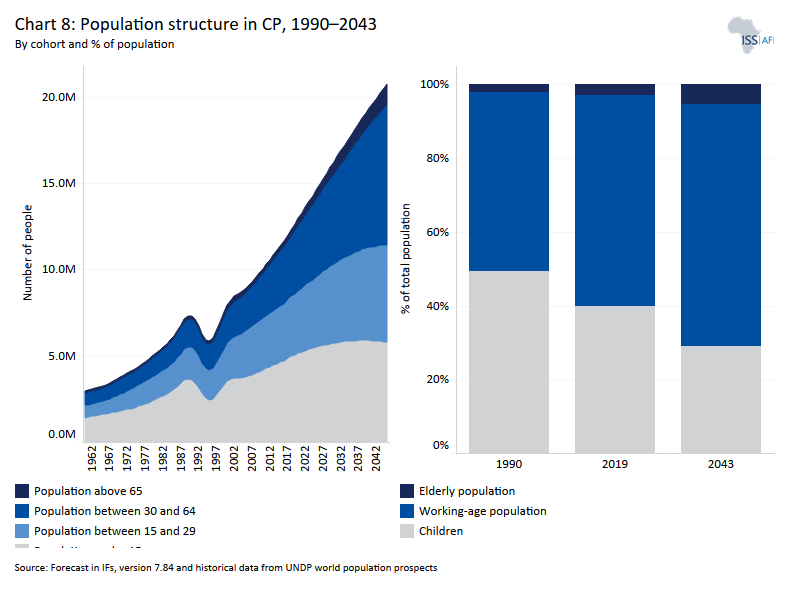
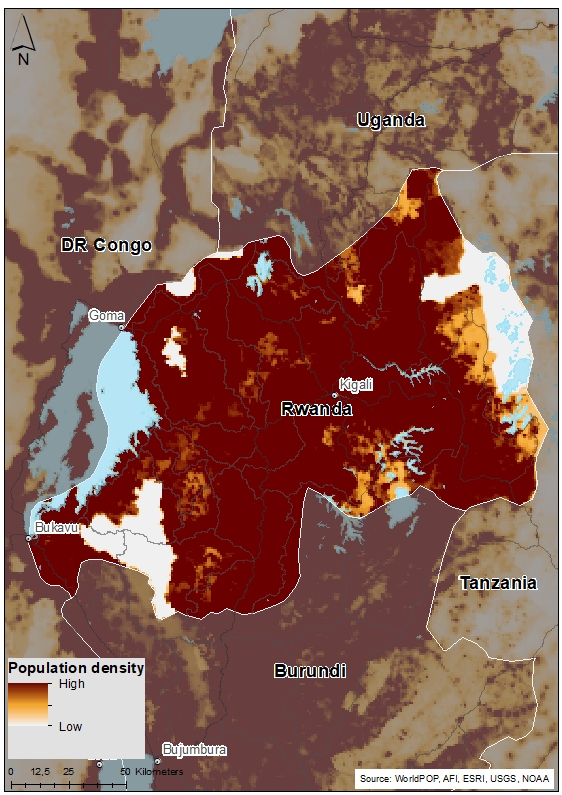
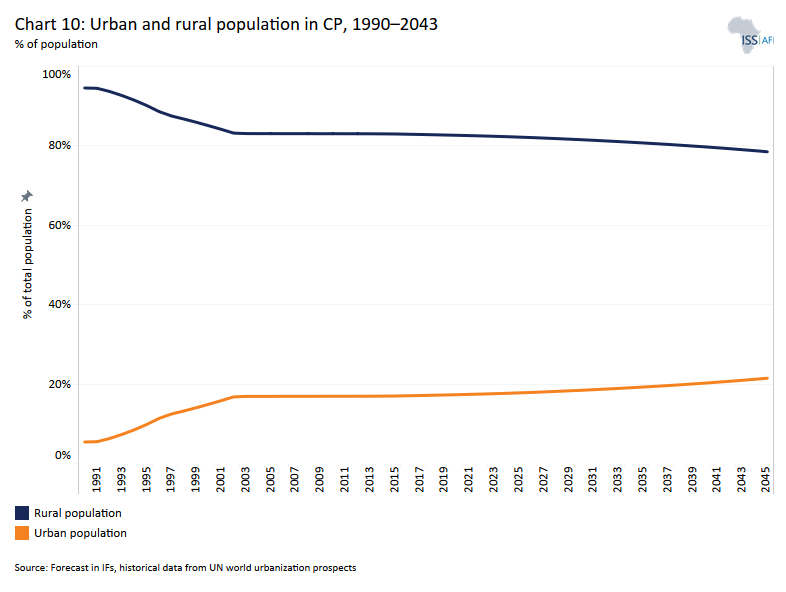
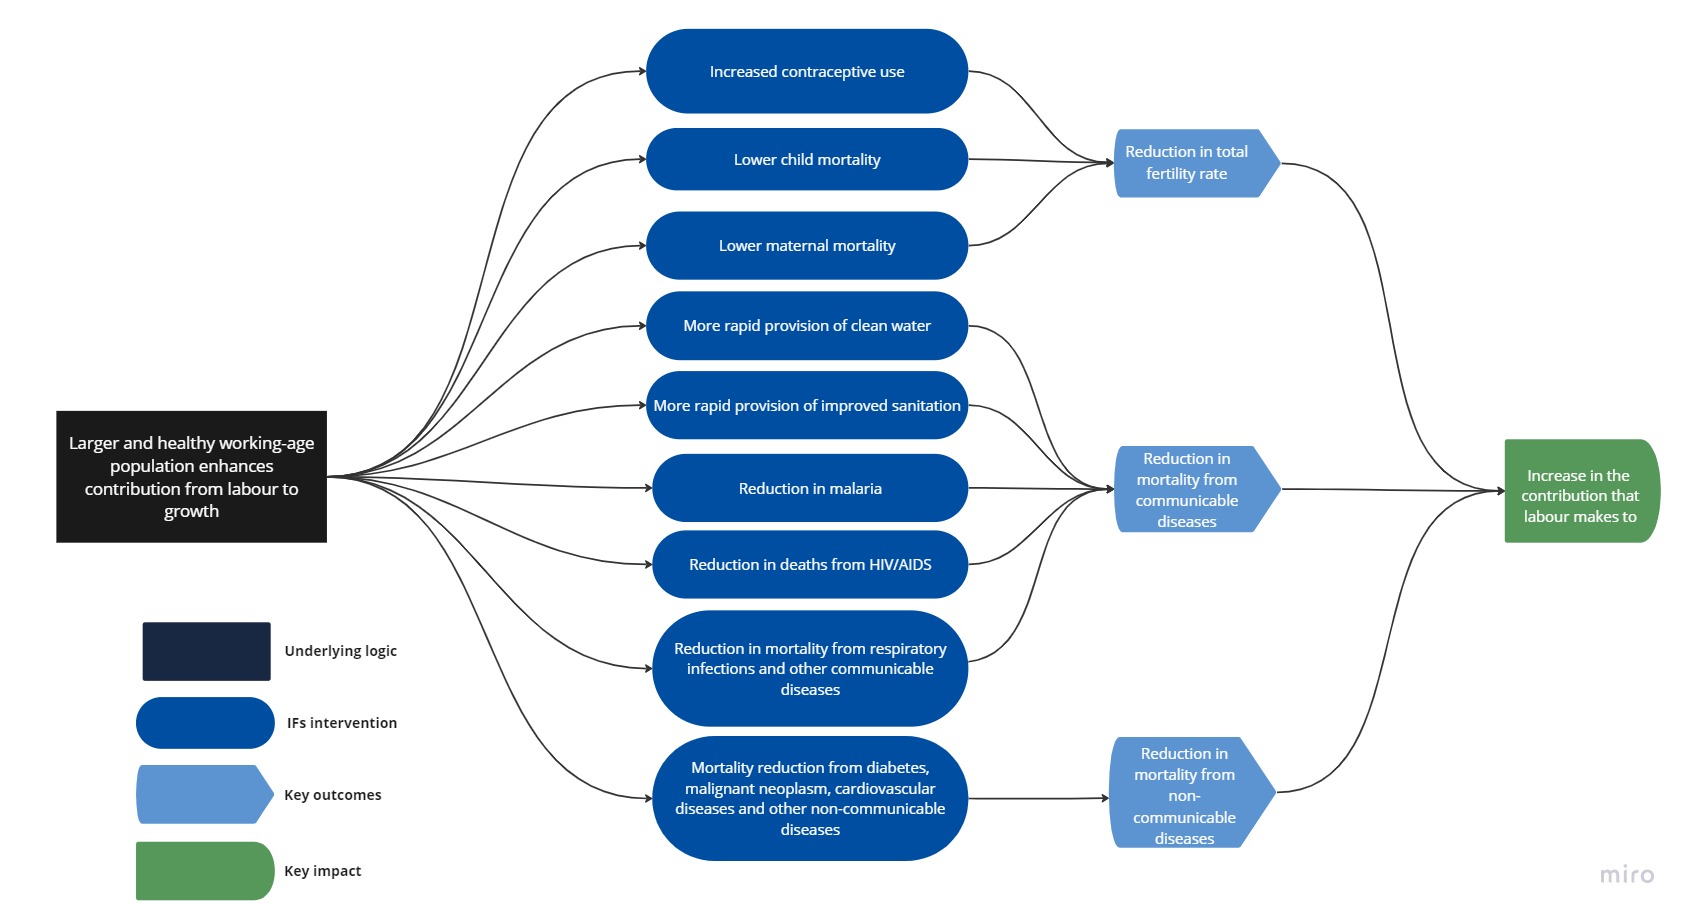
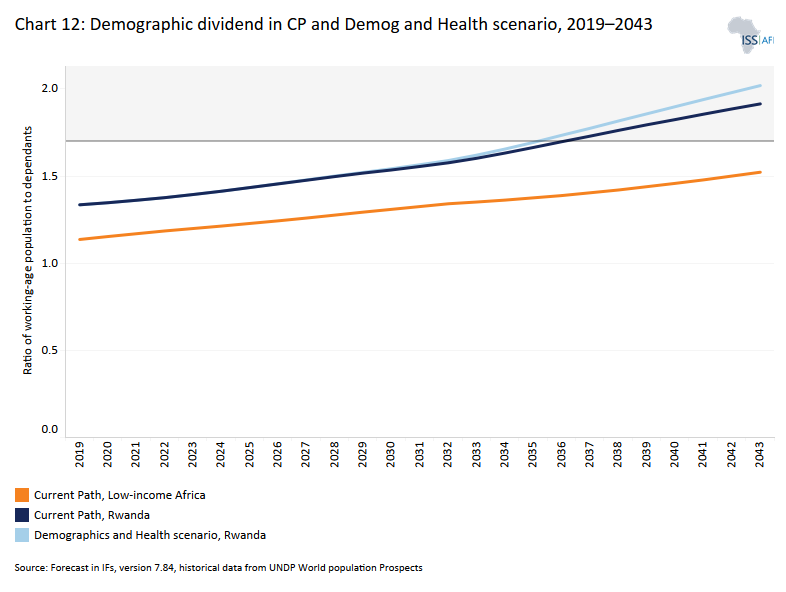
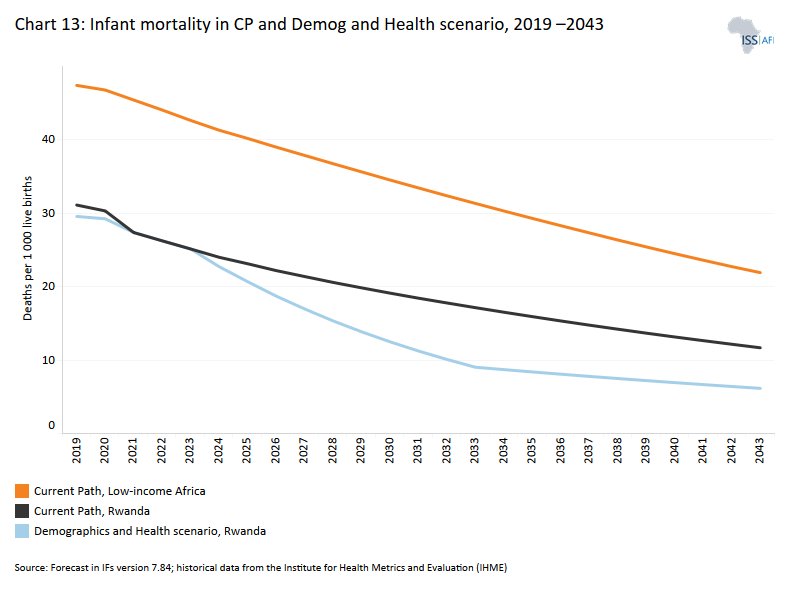
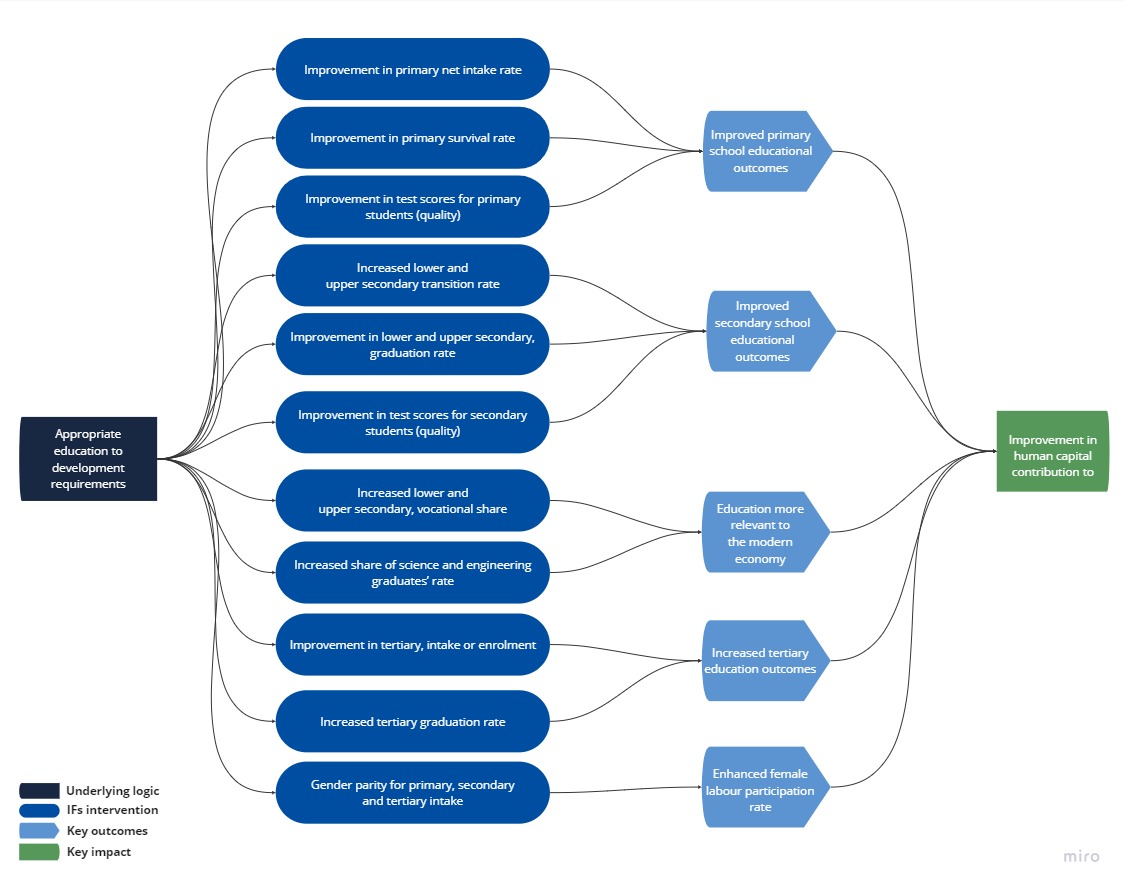
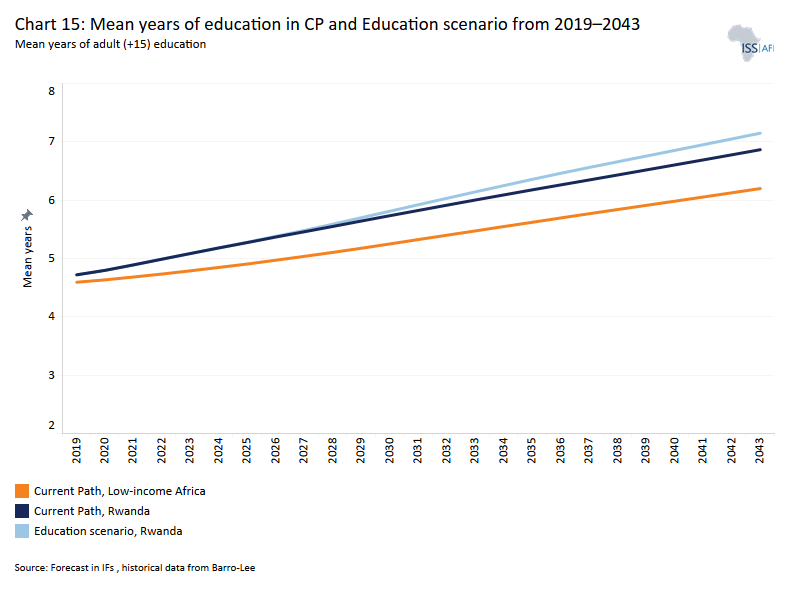

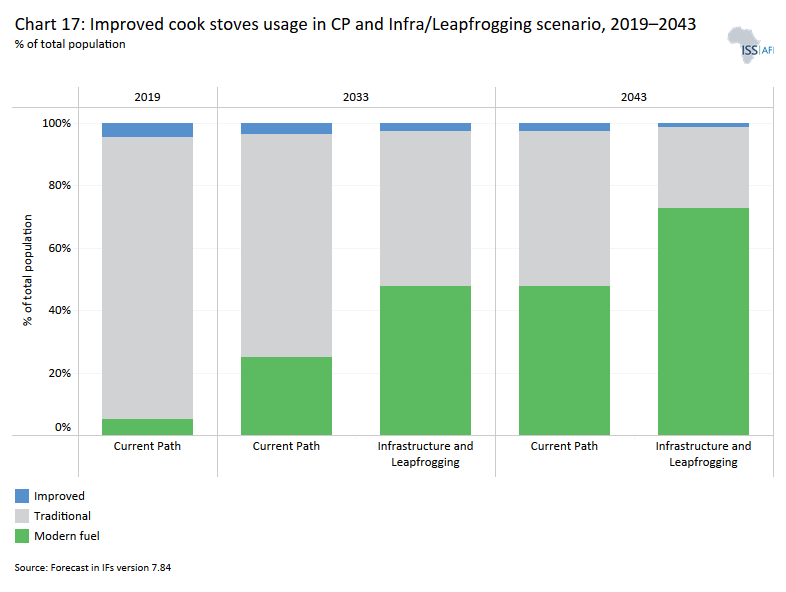
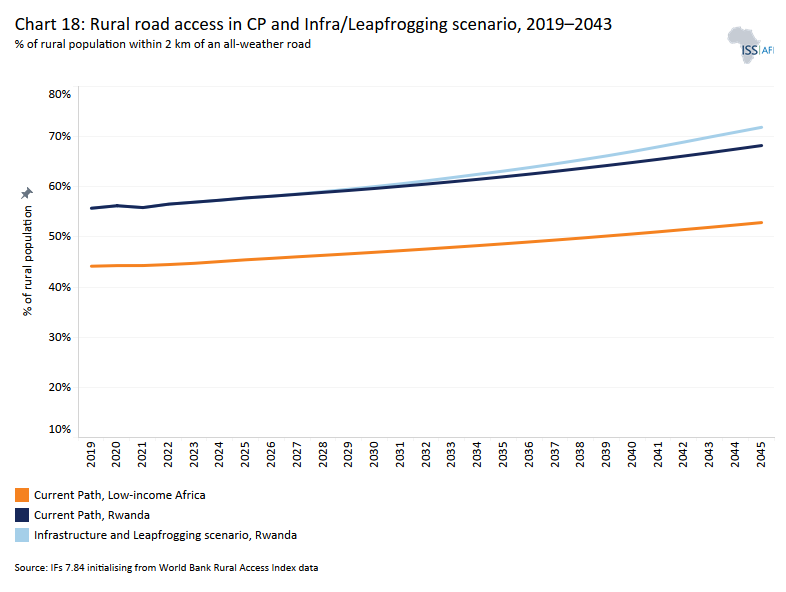
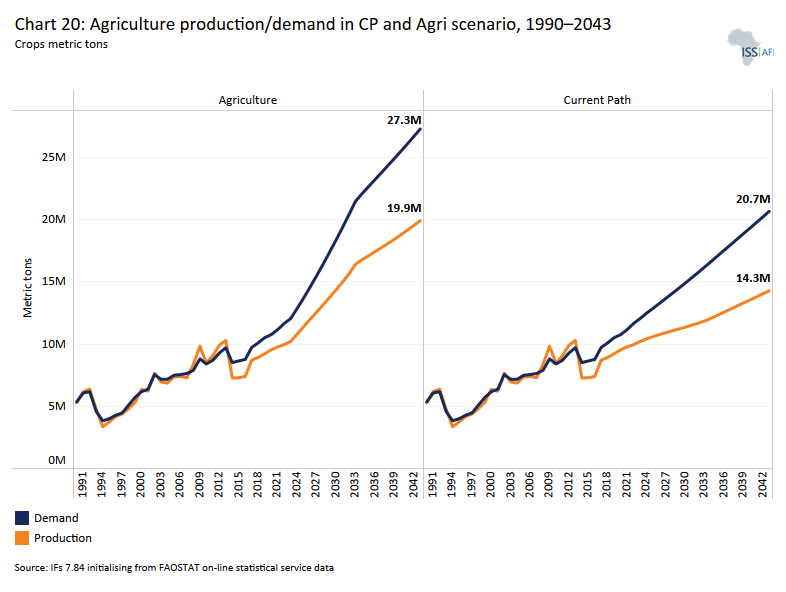
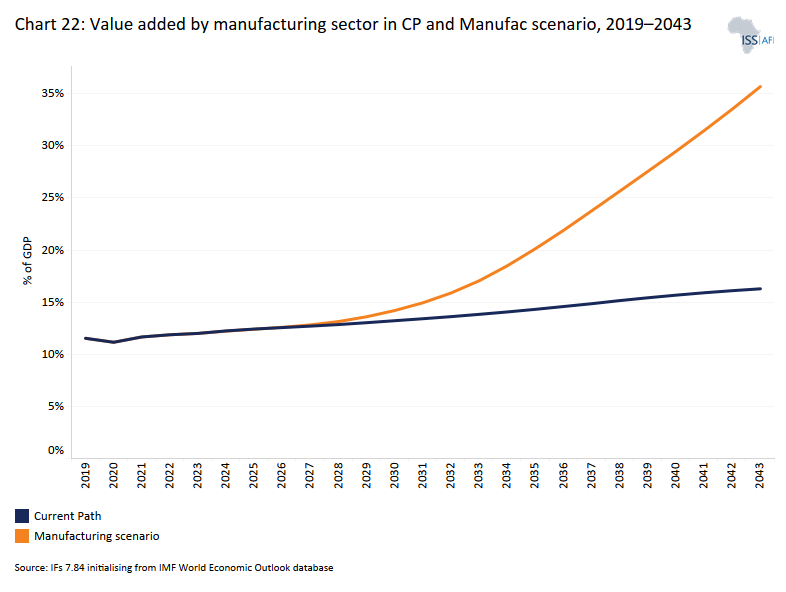
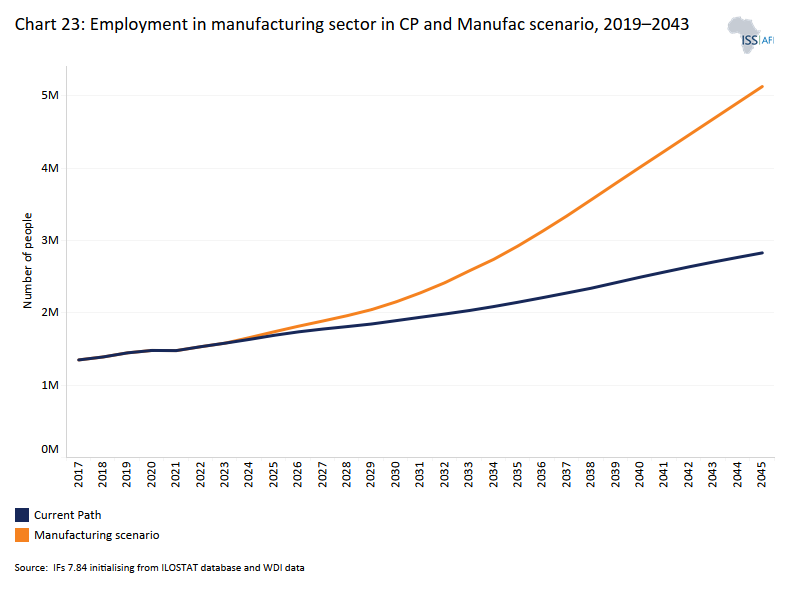
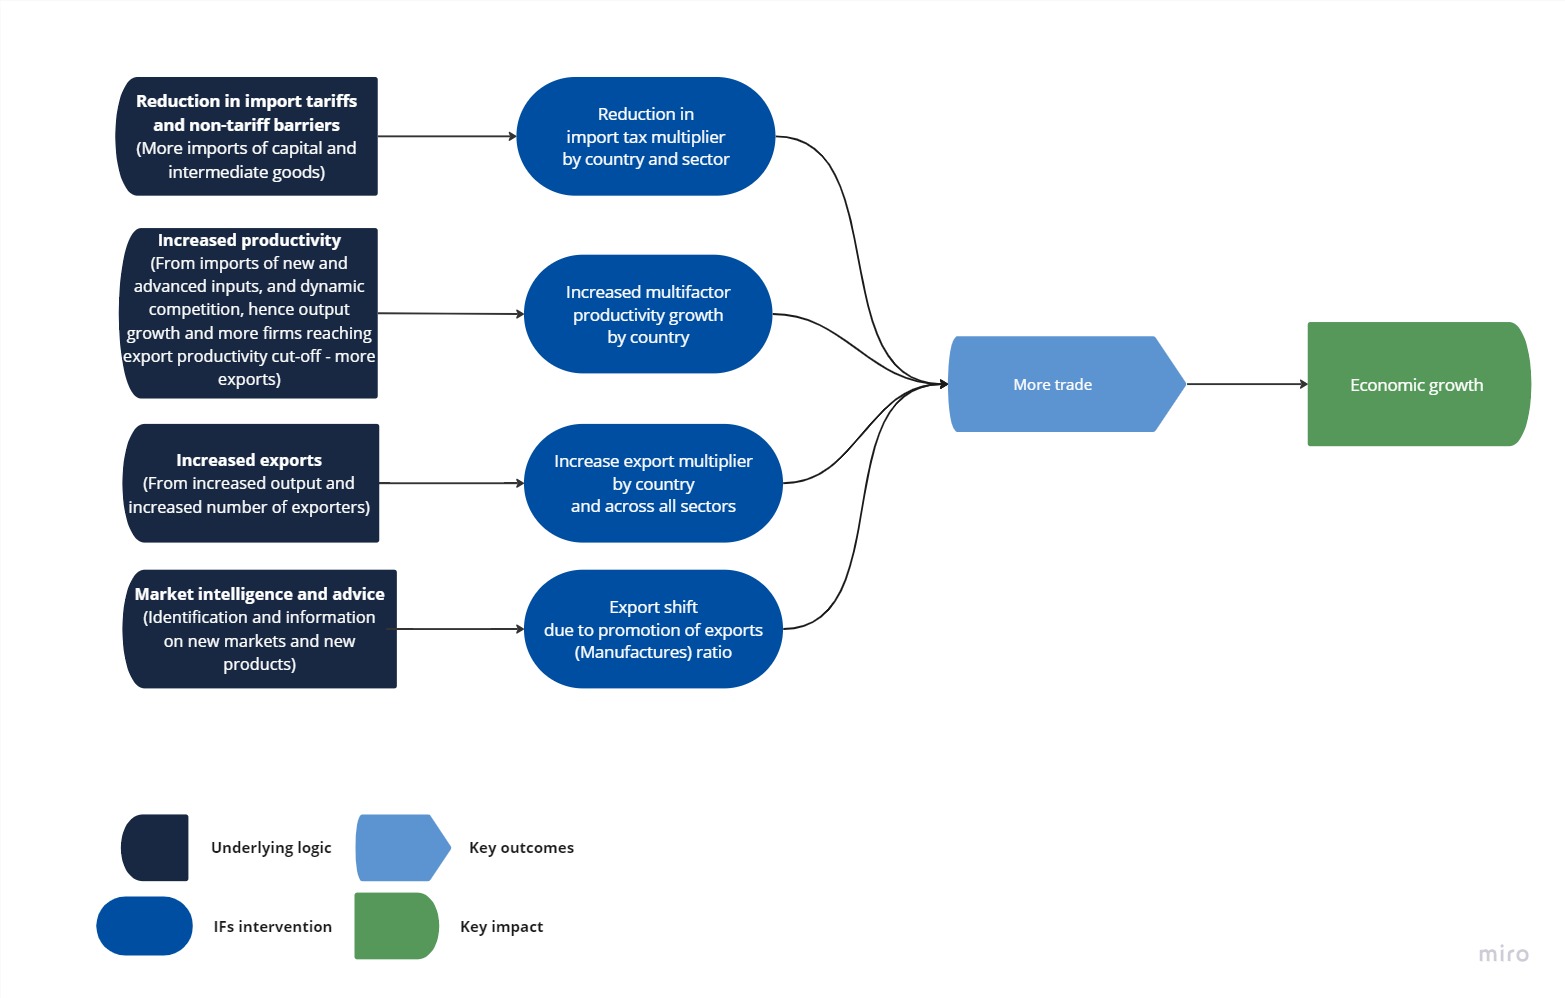
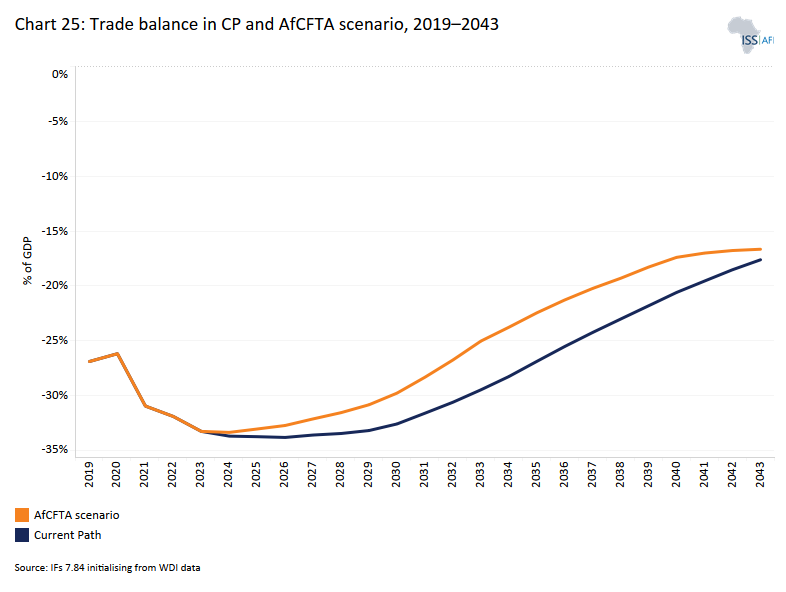
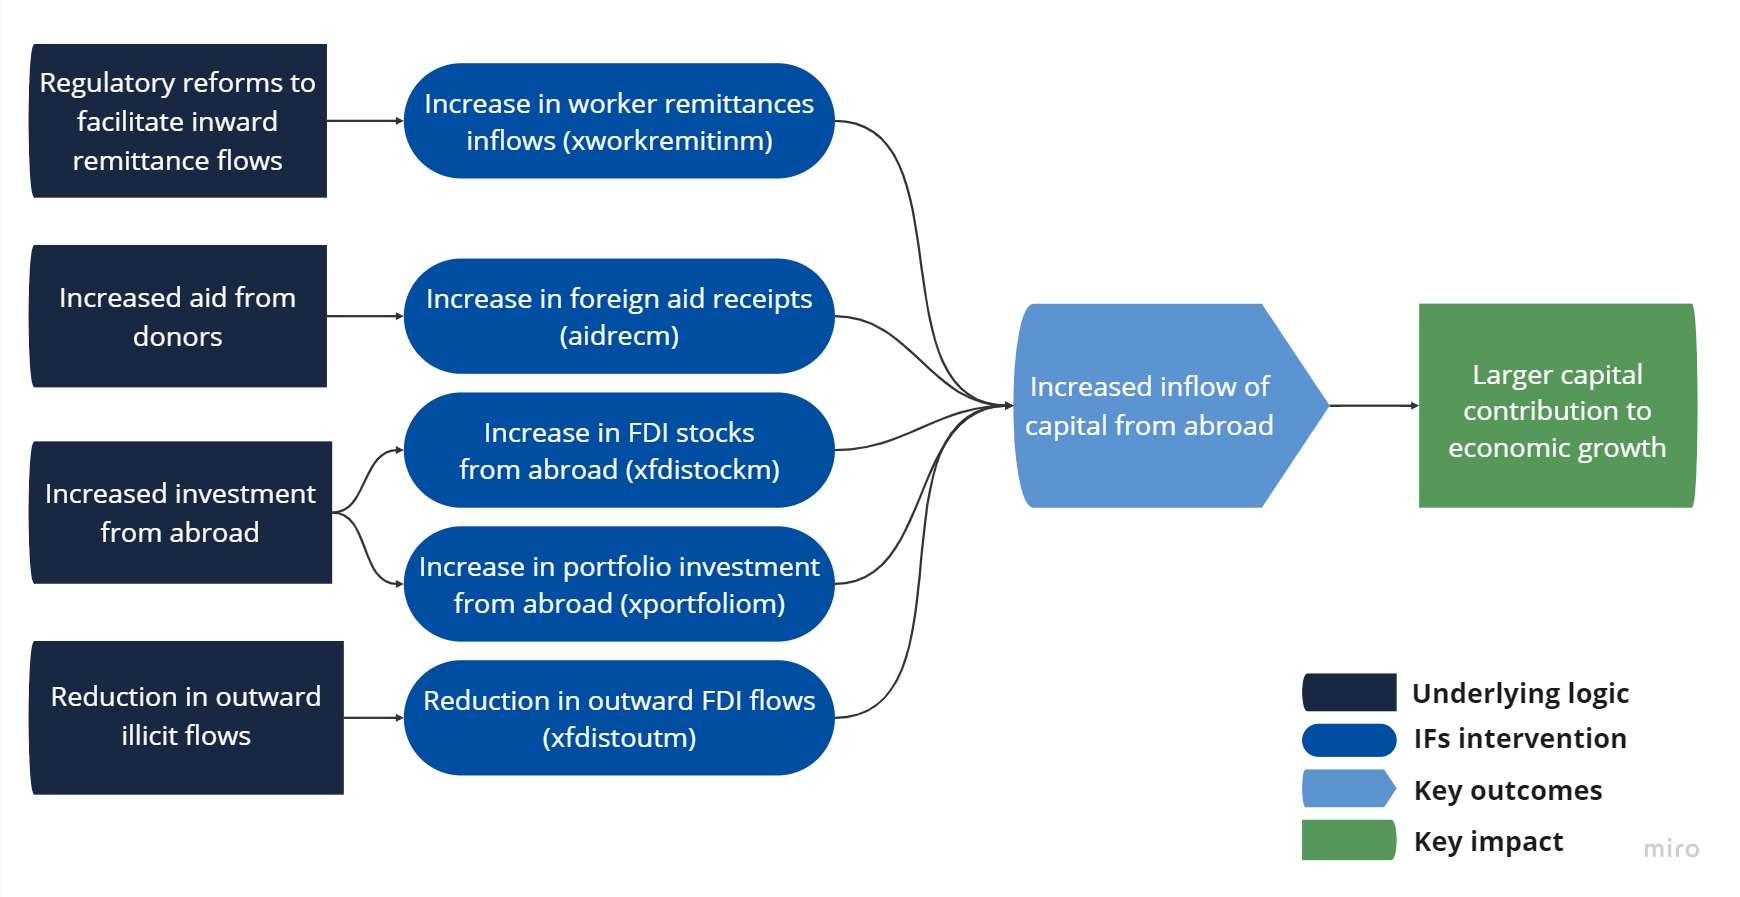
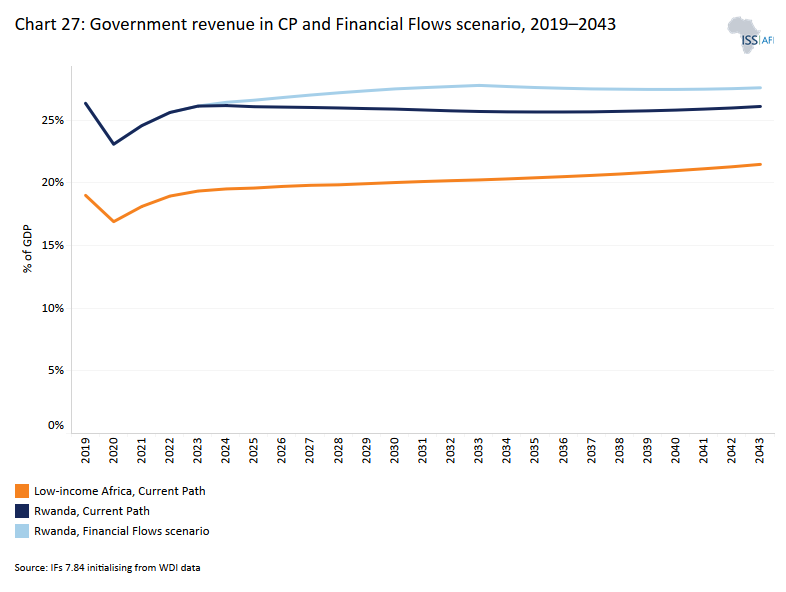
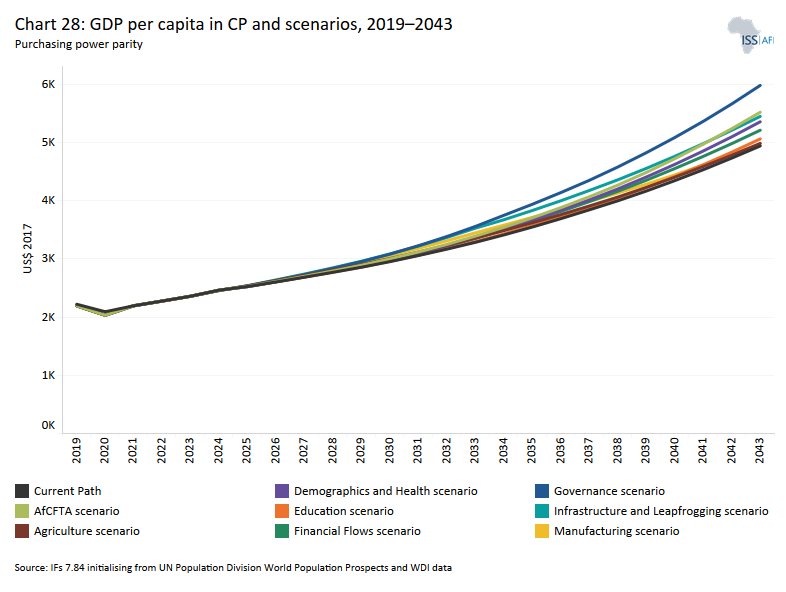
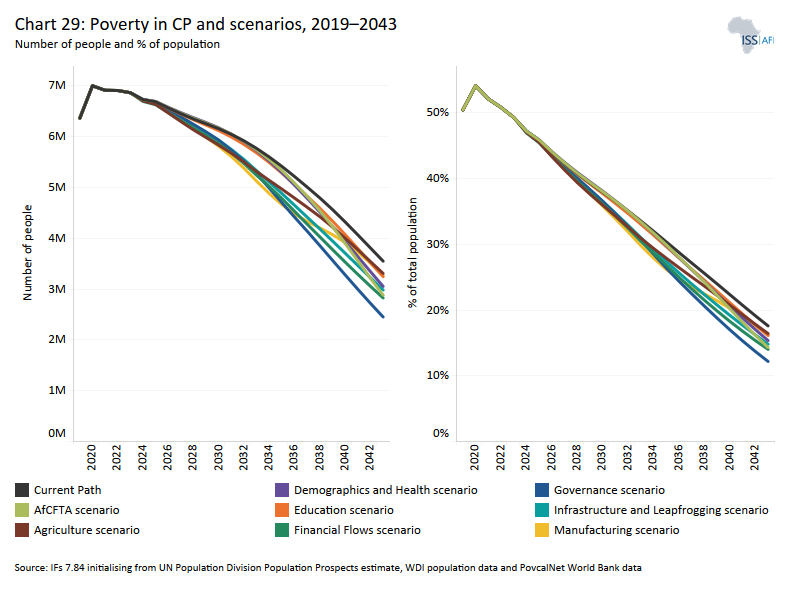
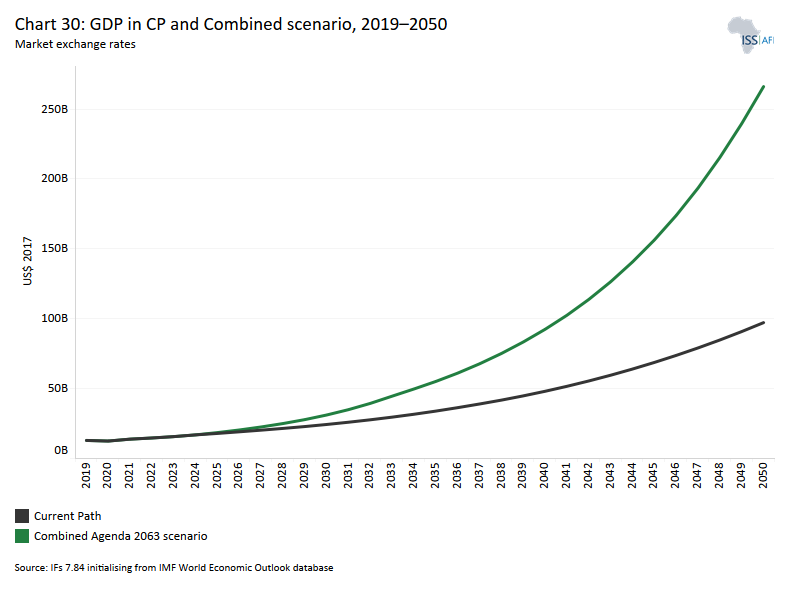
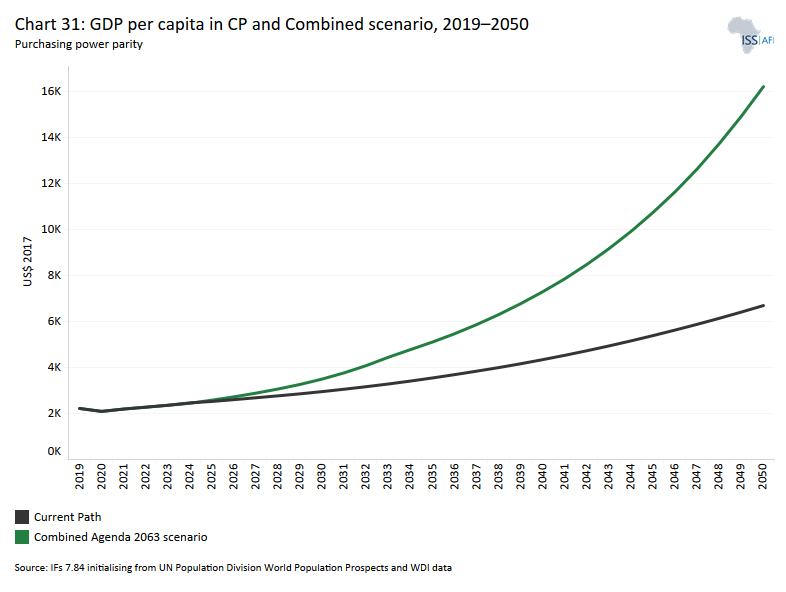
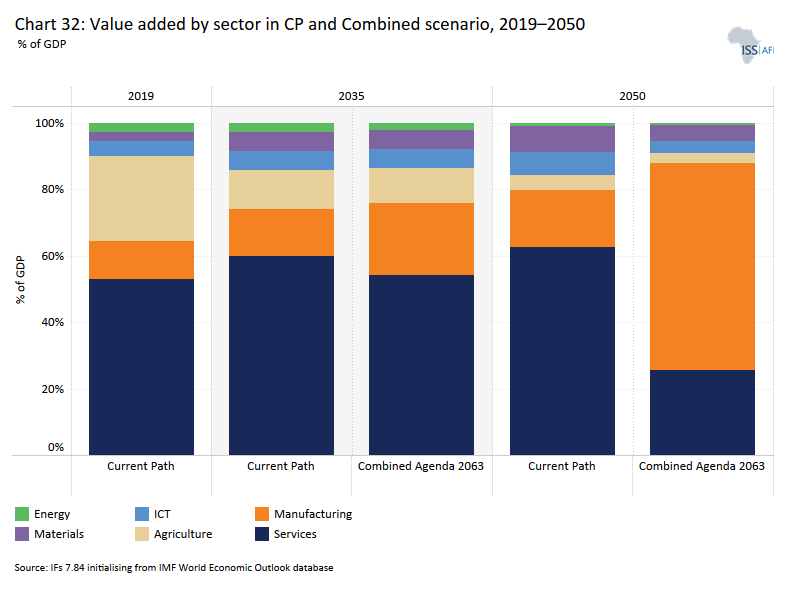
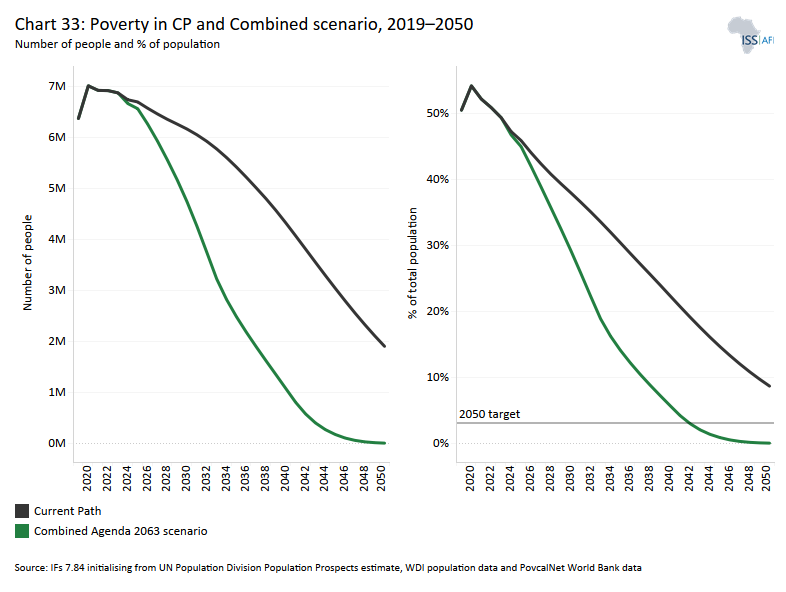
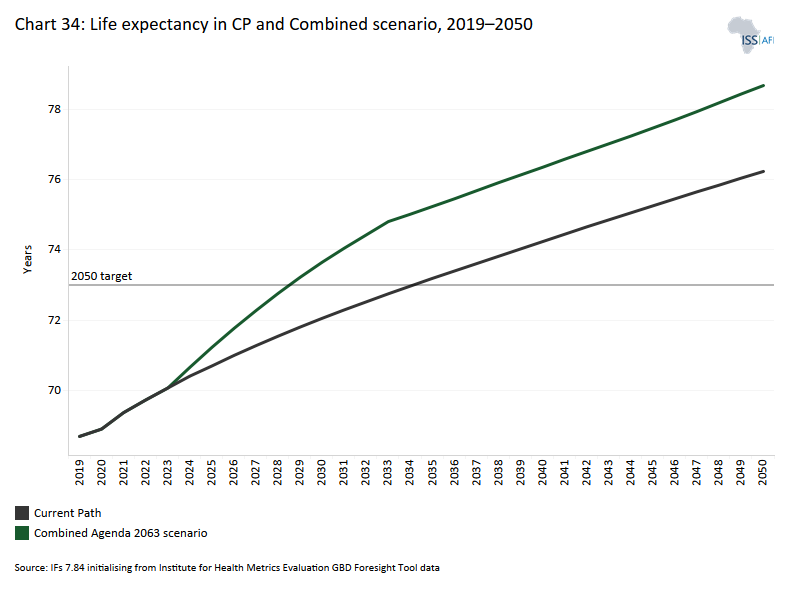
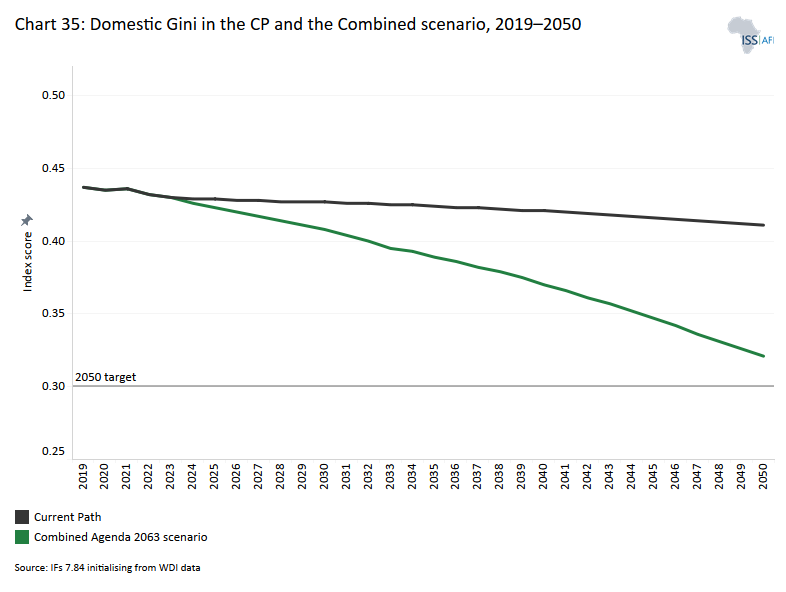
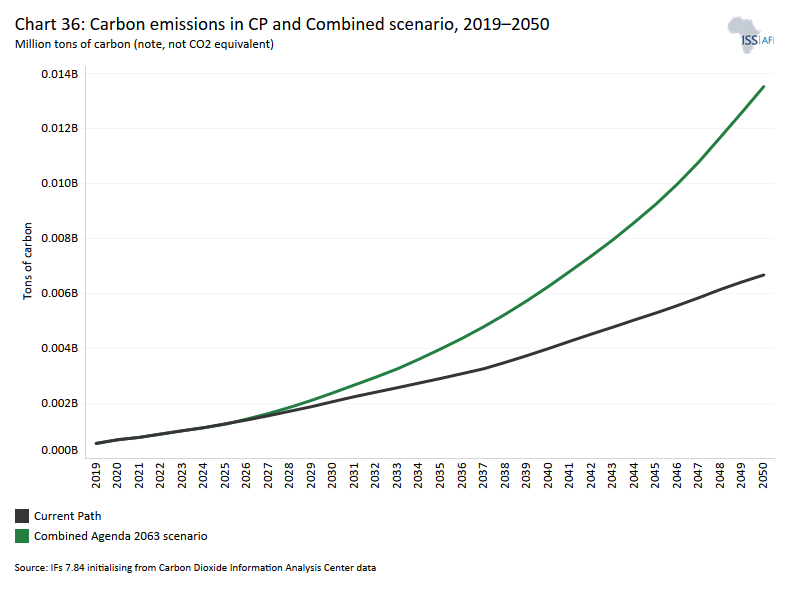
Chart 1 is a political map of Rwanda.
According to the World Bank’s income classification, Rwanda is a low-income country positioned in central Africa. A small, landlocked country Rwanda is located just south of the equator and bordered by Burundi, the Democratic Republic of the Congo (DR Congo), Uganda and Tanzania. With an area of 26 338 km2, it is the fourth smallest mainland African country, and its location on the East African Rift results in a complex topography with rich soils and great biodiversity. Rwanda's hilly topography has earned the country the nickname of ‘land of a thousand hills’ and the its ample rainfall drains into a series of freshwater lakes as part of the eastern Nile and western Congo basins.
Rwanda gained independence from Belgium and separated from Burundi in 1962. The government of President Grégoire Kayibanda faced severe development challenges. Upon the assassination of his successor, Juvénal Habyarimana on 6 April 1994, Rwanda spiralled into civil war. The subsequent genocide was ended with the military victory of the Rwanda Patriotic Front (RPF) which has dominated politics since. In 2000 Vice President Paul Kagame took over the presidency from Pasteur Bizimungu and became the fourth Rwandan president since independence. President Kagame was officially elected in 2003 as president, re-elected for a second term in 2010 and his mandate was renewed during the August 2018 elections that the RPF won with a landslide.
In accordarance with an 2015 amendment to the constitution the length of presidential terms were shortened from seven years to five years and allows President Kagame the option to contest for third seven-year term starting in 2018 with the option of an additional two subsequent five-year terms until 2034.
Rwanda has made significant development strides since 1994 and is known for its ease of doing business, ranking 38th in the World Bank’s ease of doing business index in 2020. it has emerged as one of Africa’s fastest-growing economies.
Rwanda is a member of the Common Market for Eastern and Southern Africa (COMESA) and the East African Community (EAC). After joining the Commonwealth in 2009, Rwanda replaced French with English as the official second language in schools.
The restoration of forest land, protection of national parks and groundbreaking environmental policies have been vital for the country’s successful tourism sector.
The Rwanda Energy Group (REG) was established in 2016 to deliver on the government's energy aspirations and a number of new projects are currently underway to increase capacity. For instance, recently, Lake Kivu, the largest of the freshwater lakes in Rwanda, has become a source of biogas (methane) extraction, promising great potential for energy generation in Rwanda.
Chart 2 depicts the National Development Plan of Rwanda, called Rwanda Vision 2050.
In 2015 the Minister of Finance and Economic Planning launched Rwanda's Vision 2050 that provides the long-term strategic direction for the country and sets the pathways to achieve the country’s 2050 ambition. Vision 2050 replaces Rwanda's previous long-term development plan, Vision 2020. Vision 2020 recorded substantial economic growth, but did not meet its target of becoming a lower-middle-income country by 2020. Vision 2050 now aspires to elevate the country to upper-middle-income status by 2035 and high-income status by 2050, providing a high quality of life for all citizens.
Vision 2050 is anchored on five pillars: human development, competitiveness and integration, agriculture for wealth creation, urbanisation and agglomeration, and accountable and capable state institutions.
- Part of the human development pillar, Vision 2050, acknowledges that the benefits of a demographic dividend will only be harnessed if the future workforce is well educated, skilled, healthy and provided with employment opportunities. To this end, it commits to investments in human capital parallel to a reduction in fertility rates and economic reforms.
- The competitiveness and integration pillar emphasises the role of economic competitiveness at all levels as a prerequisite to a developed country. Particular emphasis is placed on modern technologies, innovation, research and development (R&D), increased productivity, quality infrastructure and a favourable cost of doing business environment.
- The third pillar, agriculture for wealth creation, reaffirms the important role of agriculture, which consists of professional farmers and strong commercial value chains. This will underpin economic growth and poverty reduction and support food security, nutrition and a vibrant export sector.
- Urbanisation and agglomeration are recognised as the fourth pillar for their role in increasing access to markets, skills and employment opportunities.
- The fifth pillar, accountable and capable state institutions, supports effective institutions to facilitate economic growth and development. Emphasis is placed on modernising the country’s institutions and governance through innovation and by keeping the government accountable through citizen participation and adherence to the rule of law.
Chart 3 shows the GDP (market exchange rates, MER) in the Current Path from 1990 to 2043.
The GDP of Rwanda measured in market exchange rates (MER) has more than quadrupled from US$3.2 billion in 1990 to US$13.0 billion in 2019, placing the country’s economy as the sixth largest in East Africa and the 34th largest in Africa. This represents a growth in GDP of over 300% in the last three decades. From 2009 to 2019, Rwanda’s GDP grew at an average of 7.2%.
However, after growth of 10% in 2019, the restrictive measures and protocols instituted to control the COVID-19 pandemic curtailed economic activities, with the GDP shrinking by 3.4% in 2020 — the largest drop since 1994. The structural problems facing the Rwandan economy include a balance of payments deficit, rising foreign debt, a small industrial sector, and a large informal sector, as well as at least 40% of its youthful labour force either underemployed or unemployed.
The government also faces the difficult task of combating high inflation, climate risk and addressing long-term development needs. Annual inflation jumped to 31% in October 2022 from 23.1% in the previous month, the highest since January 1997. The steady rise in inflation is mainly driven by rising prices of vegetables, food and non-alcoholic beverages and bread and cereals. High food inflation severely affects poorer households for whom food expenditure constitutes more than 70% of their budget.
Huge public investment in the economy, estimated at 19% of GDP in 2019, is also resulting in a large fiscal deficit and public debt largely financed by external borrowing. From 2010 to 2019, the country’s debt-to-GDP ratio increased from 19.5% to 56.8%, rose to 72.4% in 2020 due to COVID-19 expenditure, and was projected to reach 77.9% by the end of 2022. Out of this, external debt constitutes a growing portion and is projected to reach 62.7% in 2022.
With the easing of COVID-19 restrictions and with donor support, the economy is expected to bounce back. It is the first African country to secure a staff-level agreement with the IMF for a 36-month Policy Coordination Instrument (PCI) and Resilience and Sustainability Facility (RSF). The agreements gives Rwanda access to a Special Drawing Right (SDR) of 240.3 million (about US$310 million) under the RSF. This is to support economic policies and reforms in maintaining macroeconomic stability and advancing structural reforms such as climate mitigation and adaptation. On the Current Path, Rwanda’s GDP is estimated to increase nearly fivefold to US$59.6 billion by 2043. The increase in GDP reflects the higher rate of economic growth expected to occur within the next 24 years.
Chart 4 presents the informal sector value in the Current Path forecast from 2019–2043.
The informal sector in Rwanda is large, serving as a source of livelihood for the majority of the population, especially young people who largely depend on the sector for survival. According to the 2019 Rwanda Labour Force Survey, over 75% of all workers are employed in the informal sector. Informal workers are particularly vulnerable as they do not have secured employment contracts, social security and protection or worker representation and work in bad conditions. People who work in the informal sector are usually underemployed and poor as most of them earn less than US$0.5 per day, with women earning significantly less.
The sector mainly consists of hawkers, street vendors, domestic workers, mine and tea plantation workers, barbers and hairdressers, street vendors, restaurant workers and other unregistered service providers. The activities of the sector include agriculture, fishing and forestry, wholesale and retail trade, motor vehicle reparation, motorcycles in the manufacturing sector as well as transport and storage.
In 2019, the size of the informal sector in Rwanda was approximately 32% of GDP. Among Africa’s 23 low-income countries, only Togo, Ethiopia, Sudan and Madagascar have a smaller informal sector. It suggests that Rwanda has performed better in formalising its economy compared to the average of other African countries within its income group. This is expected to decline to 27.2% by 2043, constituting a 4.8 percentage point decrease over the 24-year period. By then, Rwanda will overtake Madagascar to be the country with fourth lowest informal sector contribution among the low-income countries in Africa after Ethiopia, Togo and Sudan.
Current Path Forecast and Sectoral Scenarios
Download to pdf- Briefly
- Governance: Current Path vs scenario
- Demographics and Health: Current Path vs scenario
- Education: Current Path vs scenario
- Infrastructure and Leapfrogging: Current Path vs scenario
- Agriculture: Current Path vs scenario
- Manufacturing: Current Path vs scenario
- AfCFTA: Current Path vs scenario
- Financial Flows: Current Path vs Scenario
This section provides an overview of the key characteristics of Rwanda along its likely (Current Path) development trajectory and the impact of a single positive scenario in eight separate sectors. Chart 5 depicts this structure.
The Current Path is a dynamic scenario that imitates the continuation of current policies and environmental conditions. The Current Path is, therefore, in congruence with historical patterns and produces a series of dynamic forecasts endogenised in relationships across crucial global systems.
The eight sectoral scenarios are: Governance, Demographics and Health, Education, Large Infrastructure and Leapfrogging, Agriculture, Manufacturing, the African Continental Free Trade Area (AfCFTA), and External Financial Flows. The interventions in each scenario are benchmarked to present an ambitious but reasonable aspiration for countries at similar levels of development.
Chart 6 presents the structure of the Governance scenario.
Better governance ensures efficient allocation and distribution of state resources and encourage inflows of foreign direct investment (FDI). See the theme on governance for the conceptual approach that we have adopted consisting of three dimensions, security, capacity and inclusion.
Generally, governance in Rwanda is better than in most African countries, especially compared to the average for low-income countries. In our modelling governance index, its score of 0.73 for 2019 was 14% higher than the average of 0.64 for low-income countries in Africa. On the Current Path, Rwanda’s score on the index will reach 0.81 compared to the average of 0.74 for low-income African countries by 2043.
In terms of governance capacity, Rwanda’s score in 2019 of 0.4 was about 63% higher than the average of low-income Africa of 0.25, reflecting the extent to which Rwanda has increased government capacity over the years. For example, the effective tax rate in Rwanda, is significantly higher than the average of its peers on the continent. A similar picture is evident when comparing government revenue as a percentage of GDP where Rwanda has a higher revenue base than the average of its African peers. For instance, in 2019, Rwanda’s total revenue (without aid) equated to 11.5% of GDP and exceeded the average of 9.7% of GDP recorded by low-income countries in Africa.
Determined efforts has seen Rwanda now perceived as the least corrupt country in East Africa and the fourth least corrupt country in Africa on the Corruption Perception Index. The government has established several institutions such as Office of the Ombudsman (with prosecutorial powers and spesialised chambers to deal with corruption), the Rwanda Public Procurement Authority (RPPA), the Office of the Auditor-General, the Anti-Corruption Unit in the Rwanda Revenue Authority and the Public Procurement Appeals Commission.
Also, civil servants are prosecuted if allegations of corruption are made against them, and senior officials are required by law to declare their assets before occupying public office. In addition, the government in September 2018 enacted a law that broadened the definition of corruption to include bribery, sexual corruption, embezzlement, decision-making based on favouritism, friendship or hatred, influence peddling, illicit enrichment, use of the public property for unintended purposes, abuse of power, and demanding or receiving undue or excessive money. Moreover, a national-level advisory council against corruption was established to devise tactics to fight and share information on corruption-related activities. Petty corruption continues to be an issue in the public sector and police, however. On the Current Path, the governance capacity score in Rwanda is projected to reach 0.47 by 2043, well above the average of 0.33 for low-income African countries.
While Rwanda performs well on the security and capacity index, it does poorly on inclusion. In 2019, Rwanda scored 0.33 on the inclusion index, about 29% below the average for its income peers on the continent at 0.42. By 2043, Rwanda’s score on governance inclusion will still be about 21% below the average of low-income countries in Africa. The lack of strong political opposition parties and critical voices contribute to its low performance. For instance, during the September 2018 parliamentary elections only two opposition parties, the Social Party Imberakuri and the Democratic Green Party of Rwanda managed to garner two seats each.
Despite this low performance on political inclusion, the country appears to be doing well in gender representation. By international standards, inclusive gender representation requires at least 30% female representation at all levels of governance. The government of Rwanda has years introduced a raft of mechanisms and structures to ensure female participation in the governance process. Article 9 of the 2003 Constitution of Rwanda enjoins at least 30% women representation in all the three arms of government. At the executive level, the country has consistently since 2010 exceeded the constitutional requirement of 30% in some cases achieving gender parity at the executive level. Since 2017, the number of women ministers in cabinet has always met the gender parity condition of 50%.
Rwanda also has the highest representation of women in parliament in Africa. The 2013 parliamentary election saw a significant increase in women representation to 64% and the highest in the world but declined marginally to 61% after the 2018 legislative elections. The Chamber of Deputies has consistently had over 50% women representation and the senate has also achieved the 30% constitutional requirement.
Women are significantly represented at the highest levels in the judiciary. The Supreme Court, which is the top court in Rwanda, has seen at least 50% women representation and, in some cases, up to 57% of women on the bench. The 2016/17 achievement report stated that 50% of all employees in the court were females, 62% for court registrar and 50% of court inspectors were also women.
To improve governance in Rwanda, we use a multiplier on the Polity IV democracy index, improve gender empowerment using the Gender Empowerment Measure (GEM), reduce corruption (using the index from Transparency International), and reduce the risk of interstate conflict and levels of internal conflict from the Political Instability Task Force. The scenario further proceeds on the assumption that democratisation, currently under pressure as a result of the economic impact of the COVID-19 pandemic, will regain its momentum as incomes, urbanisation and education levels all improve.
Chart 7 shows the governance indices in the Current Path forecast and Governance scenario for 2043.
In the Governance scenario, Rwanda's governance security index score improves to 0.88, which is about 13% above the Current Path by 2043 and about 26% above the Current Path average of low-income Africa in the same year. Governance capacity will also improve in the Governance scenario, with its score increasing to 0.63 by 2043, constituting a 32% improvement above the Current Path and 88% above the average of its income peers on the continent. In terms of inclusion, the Governance scenario will improve Rwanda’s score on the governance inclusion index by 41.1% above the Current Path, reaching 0.56 by 2043. At this rate, Rwanda’s score will be 17% higher than the average of low-income countries in Africa, reflecting the progress that the country has made in this dimension.
Chart 8 depicst the population structure in the Current Path forecast from 1990 to 2043.
Rwanda’s population grew from 3.05 million on independence in 1962 to 7.28 million in 1989. The civil war, which started in 1990, followed by the brutal genocide in 1994 skewed the demographic trajectory of the country and the country’s population plummeted to 5.8 million. The genocide had a profound effect on the country’s demographic structure: it resulted in an estimated 800 000 deaths, 2.1 million refugees and 1.5 million internally displaced people.[x] In an effort to see Rwandans return home, numerous repatriation efforts, campaigns and policies followed the end of the genocide.[x] Only by 1999 had population numbers returned to those measured a decade earlier. The genocide also severely impacted the country’s health services with critical and preventative services, such as vaccinations programmes and prenatal care being interrupted and healthcare resources impacted.[x]
In addition to the lasting impact of the genocide, a drop in fertility rates has also had a significant effect on the population structure of the country. The changes in fertility is a result of significant investments in reproductive health and family planning the last two decades. The family planning policy of 2006, supported by a strong parliamentary backing laid the foundation of improved access to family planning services. Improved access to modern contraceptives, family planning and increased female education have significantly increased and in 2019 nearly 67% of women had access to modern contraceptives, placing Rwanda among the top five African countries with regard to family planning.[x] Fertility rates have, as a result, dropped from 8.5 births per woman in 1970 to fewer than four births per woman in 2019. The biggest contributor to the large drop in fertility rates observed between 2005 and 2010 was the improvement of female education levels and the noticeable increase in educational attainment between 2005 and 2010. Mean years of schooling for women increased during this period from 2.8 years to 3.5 years.
The government of Rwanda has also invested significantly in the healthcare system. In 2003, the constitution secured citizens ‘rights to health’ and focused on HIV treatments, vaccination campaigns, primary healthcare and malaria prevention.[x]
In 2019, the population stood at 12.63 million with an annual growth rate of just more than 2%. The fertility rate, currently at four births per woman, will continue to decline and in the Current Path it is likely to reach 2.3 births per woman by 2043. Improvements in access to health services have also significantly extended the life expectancy of the population. In 1994, the country had the second-highest under-five mortality rates in Africa and the lowest life expectancy globally. At the turn of the century, the average Rwandan could expect to live 49 years, placing it as the tenth worst performer in Africa. By 2019, life expectancy had climbed to nearly 69 years — the 11th highest in Africa. The strides made in the past two decades are unprecedented with only Rwanda and Botswana having managed to raise life expectancy by more than 19 years since the turn of the century. On the Current Path, the population of the country will increase to 16.23 million in 2030 and to 20.19 million by 2043, with life expectancy climbing to 75 years in 2043.
With increased life expectancy the elderly population (65 years and older) willalso grow. The elderly population constituted 7% of the population in 2019 and in the Current Path will increase to nearly 19% by 2043. However, the population remains predominantly young. In 2019, 40% of Rwanda’s population was below the age of 15 years with more than half the population below 20 years of age. This is an improvement from three decades ago when the median age was a mere 15 years and the under-15 age cohort made up 50% of the population. In 1990, Rwanda ranked as the most youthful country in Africa but over the past 30 years the country has surpassed 34 other African states. In the Current Path, the median age of the population will be 26.3 years by 2043 with a declining under-15 cohort making up only 29% of the population.
Rwanda’s youth bulge (the portion of its adult population aged between 15 and 29) stood at about 47% in 2019 — a fall from the 52% measured a decade earlier in 2009. While this is slightly above the African average of 46.5%, the investment of the Rwanda government in education and health services over the past two decades promises to have positive returns on these investment in the decades ahead, if the country manages to provide enough employment opportunities for its youthful population.
The subsequent growth in the working age population (15- to 64-years of age) from the current 57% to 66% by 2043 means that Rwanda will experience a decline in its dependency ratio with positive effects on economic growth. Given the investments made by the government over the past decades in the health and education sectors, this growing age cohort holds great potential for the country’s development future.
Chart 9 shows a population distribution map for 2022.
At 5.1 people per hectare, Rwanda is the most densely populated country in East Africa, which is well above the African average of 0.44 people per hectare. The capital city, Kigali, is located centrally within the country with altitudes ranging from 1 300 m to 1 800 m above sea level. Kigali is also one of five provinces within the country and is the most densely populated with a density of 1 644 people per square kilometer. The city has grown from 34 000 people in 1960 to a present population of 1.2 million people and contributes a staggering 41% to the country’s GDP. The second-largest city is Gisenyi, which is located in the Western Province next to Lake Kivu, with a population of 136 000 people. Rwanda also boasts four national parks. Akagera is the largest park at 1 122 km2 and is located towards the north-eastern border with Tanzania, covering more than 4% of the country’s surface area.
Chart 10 presents the urban and rural population in the Current Path forecast, from 1990 to 2043.
In spite of its high density, Rwanda is technically one of the least urbanised countries in Africa. In 1990, 6.9 million Rwandans, constituting 94.6% of the total population, lived in rural areas. By 2019, this figure had declined to about 82.6%, equivalent to 10.4 million people, far above the average of 57.1% for Africa. Consequently, the urban population stood at 17.6% in 2019 making Rwanda the fifth least urbanised country in the world and the second least urbanised country in East Africa.
The country has experienced a slow urbanisation rate in part due to land use and the post-war reconstruction policies that saw the construction of grouped settlements called ‘imidugudu’ to cater for the resettlement of returning migrants. This has resulted in many rural settlements across the country that do not qualify as urban. Urbanisation is however more pronounced in Kigali where the persistent movement of people to the capital city has created severe pressure on land use planning, housing and basic service delivery. Much of the migration to Kigali has historically been the result of geopolitical events in the aftermath of the genocide as well as the economic opportunities offered by the capital. More recently, the profile of migrants towards the capital seems to be a younger population cohort that is pulled there due to the promise of economic prospects. Between 2013 and 2018, 85% of migrants to the city of Kigali were between the ages of 18 to 35 years.[x]
The government and private sector have struggled to keep pace with the demand for housing. In 2018, nearly 950 000 people lived in informal settlements throughout Rwanda’s urban spaces, the vast majority within the Kigali province.[x] The city of Kigali is addressing this problem and recently extended its 'Master Plan 2025' to a revised 'Master Plan 2050' in which informal settlements are addressed through the reallocation of high-risk settlements to safer spaces and the in-situ upgrading of well-located informal settlements.[x]
The slow urbanisation rate will not see Rwanda achieve a rural–urban parity within the next couple of decades. In the Current Path, nearly 80% of the population (16 million people) will be living in rural areas by 2043. The urbanisation rate will only increase marginally to 21% by 2043. Rwanda will be among the four least urbanised countries in Africa by 2043.
Chart 11 depicst the structure of the Demographics and Health scenario.
Rwanda has done well in recent years in improving critical health outcomes. Maternal mortality ratio has dropped fivefold from 1 160 deaths per 100 000 live births in 2000 to 224 deaths by 2019. The malaria mortality ratio has decreased from 1.4 deaths per 1 000 people in 1997 to 0.23 in 2019, while the HIV prevalence rate dropped from 3.4% of the adult population in 1995 to 1.75 in 2019. These improvements are the results of the government's focus on the health and demographic sector.[x] Community-based health programmes have enabled the government to implement one of the most robust health programmes globally.[x]
Health expenditure (as a per cent of GDP) stood at 4.2% in Rwanda in 2019 — while this is below the average of low-income African countries it follows a period of substantial investment in the health sector. From 2003 to 2016, the Rwandan government invested significantly in the sector and health expenditure (as a per cent of GDP) peaked above 8% for a decade (2003–2012) and above 6% between 2013 and 2016. This huge investment in the health sector has impacted positively on the country’s health infrastructure and outcomes.
There remains, however, a high burden of infectious and non-communicable diseases in the country. Our modelling uses the International Classification of Disease (ICD) to differentiate between three broad categories of disease: communicable diseases (e.g. diabetes), non-communicable diseases (e.g. AIDS, diarrhoea, malaria and respiratory infections) and injuries, as well as fifteen sub-categories of mortality and morbidity. In 2019, non-communicable diseases caused about 32 000 deaths. On the Current Path, this figure is likely to climb to 710 000 by 2043. Communicable diseases have, however, been steadily declining, from 92 000 deaths in 1998 to 28 000 in 2019, and it is likely to be 15 000 by 2043. While Rwanda has done well in reducing child, infant and maternal mortality, stunting in children has remained high at 32% in 2019.
The Demographics and Health scenario consists of reasonable but ambitious reductions in the child and maternal mortality rate, increased access to modern contraception, reductions in the mortality rate associated with both communicable diseases and non-communicable diseases, as well as improvements in access to safe water and better sanitation.
Chart 12 presents the demographic dividend in the Current Path forecast vs the Demographics and Health scenario, from 2019 to 2043.
This study uses the ratio of working-age persons to dependants, i.e. the size of the labour force (between 15 and 64 years of age) relative to dependants (children and elderly people) as set out in the Demographics theme.
A window of opportunity opens when the ratio of the working-age population to dependants is at least 1.7:1, meaning that for every dependant, there are 1.7 workers. When there are fewer dependants to take care of, it frees up resources for investment in both physical and human capital formation. Studies have shown that about one-third of economic growth during the East Asia economic ‘miracle’ can be attributed to the large worker bulge and a relatively small number of dependants.[x] However, the growth in the working-age population relative to dependants does not automatically translate into rapid economic growth unless the labour force acquires the needed skills and is absorbed by the labour market. Without sufficient education and employment generation to successfully harness their productive power, the growing labour force (especially those in urban areas) could increasingly become frustrated with the lack of job opportunities leading to social tension and even the emergence of civil instability.
In 2019, the ratio of the working-age population to dependants in Rwanda was 1.3:1, which means that on average, for every dependant in Rwanda, there were only 1.3 persons of working age (15–64 years of age). According to the Current Path, Rwanda will achieve the minimum ratio of 1.7:1 for a potential demographic dividend by 2035, after which it could experience higher economic growth given its larger labour force relative to dependent children and elderly people. Given the significant investment in the health and education sector by the Rwandan government, this promises great returns for a well-educated and healthy workforce. By 2043, the ratio of the working-age population to dependants will be 1.9:1 on the Current Path.
The focus on family planning, education and the investments in the health sector has already started benefiting Rwanda and in 2019 the 1.3:1 ratio was already higher than the average of 1.1:1 for low-income countries in Africa. Given the additional improvements as outlined in the Demographics and Health scenario, the country can expect to achieve the desired 1.7:1 ratio one year earlier than on the Current Path and will reach a 1:1 ratio of working-age population to dependants by 2043.
Chart 13 shows the infant mortality in Current Path forecast vs the Demographics and Health scenario, from 2019 to –2043.
The infant mortality rate is the number of infant deaths per 1 000 live births and is an important marker of the overall quality of the health system in a country. In 2019, the infant mortality rate in Rwanda was 29.6 deaths per 1 000 live births — a remarkable decline from 90.2 deaths in 2000. This threefold decline has placed Rwanda above the average of low-income Africa with regard to health outcomes. Whereas, in 2000, Rwanda was on par with the average infant mortality rates for low-income Africa, by 2019 Rwanda achieved nearly 18 fewer infant deaths per 1 000 live births.
The Demographics and Health scenario will reduce Rwanda’s infant mortality rate to 12.5 deaths per 1 000 births in 2030 and to 6.1 deaths per 1 000 live births by 2043. Rwanda will achieve the SDG target of 12 deaths per 1 000 live births by 2030 in this scenario. This is almost seven deaths fewer than in the Current Path and 22 fewer deaths than the Current Path average of low-income countries in Africa.
In addition, in the Demopgrahics and Health scenario, life expectancy will increase to 76.6 years by 2043, which will be 1.7 years more than the Current Path and about 6.3 years more than the average of 73.1 years for low-income African countries.
Chart 14 represents the structure of the Education scenario.
The education sector in Rwanda follows the 6-3-3-4 model: six years of primary school, three years of junior secondary school, three years of senior secondary school and four years for a university degree. To help achieve its vision of becoming a knowledge-based economy, in 2015 Rwanda launched a competence-based curriculum that was rolled out in 2016. This was done in accordance with the global standards according to the 2013 Harmonised Curriculum Framework prepared under the EAC key principles. The new curriculum addresses the gaps identified in the old knowledge-based curriculum with the aim of ‘training a competent workforce that reflects not only skills of employability but also humane, social skills fit for a socially cohesive Rwanda,’ as stated in Rwanda’s Vision 2020.
Before 1994, the country had about 1 000 primary schools and a few secondary schools, and as such, education was limited to only a privileged few. Since then, the government has invested in educational infrastructure over the years such that by 2018, there were a total of 2 909 primary schools, 1 728 secondary schools, 360 technical and vocational education and training institutions and 40 tertiary institutions as well as 4 991 adult literacy centres. This huge investment in education infrastructure has led to significant improvements in enrolment, especially at primary and secondary levels.
In 2019, the gross enrolment rate for primary school learners was 138.6%, which was above the average of 117% for low-income countries in Africa. At the same time, net primary enrolment stood at 97.8%, signalling the achievement of universal primary enrolment and higher than the 76.6% recorded for low-income African countries in the same year. This represents significant improvement over the past two decades from 107.8% and 85.7%, respectively. Gross enrolment rate for males at 140.8% is slightly higher than the gross enrolment rate for females at 136.4%. Conversely, the net enrolment rate for females at 99.3% is above that of males at 96.4%. On the Current Path, the net enrolment will increase to 99% in 2043, which is above the average of its income peers.
The primary completion rate stood at almost 77.8% in 2019 compared to a little over 50% for Rwanda’s income peers. On the Current Path, the primary completion rate will rise to 98% by 2043, which is above the average of 85% for Africa’s low-income countries.
At the secondary level, gross enrolment rose from 10% in 1999 to 43.6% in 2019 and net enrolment stood at 32.3% in the same year. Both the gross and net enrolment at secondary level in Rwanda, albeit low, are higher than the average of low-income African countries at 39.9% and 28.2%, respectively. By 2043, gross and net secondary enrolment rates are expected to increase to 67% and 58%, respectively.
The proportion of primary students who transition to the first grade of lower-secondary stood at 80.5% in 2019, on par with the average of low-income African countries. Likewise, the lower to upper-secondary transition rate also stood at 79%, below the average of 88.4% for its income peers in Africa. By 2043, primary to lower-secondary transition rate will rise to 87% and lower to upper-secondary transition rate will increase to 89%.
While the primary completion rate is high in Rwanda, the secondary completion rate, on the other hand, is quite low, increasing from 4.2% in 2000 to 13.7% in 2019 — on par with the average of low-income African countries. By 2043, only 29% of the Rwandan population will have completed secondary education.
Regarding vocational education, the number of students enrolled in vocational programmes at lower-secondary stood at 2.7% — higher than 0.5% average of low-income countries in Africa. At upper-secondary level, 37% of students are enrolled in vocational programmes compared to the 13.3% average of its income peers in Africa.
At the tertiary level, both enrolment and graduation rates are still very low. As of 2019, gross tertiary enrolment was just 8.1% — an improvement from 1.3% in 2000. Gross tertiary enrolment will reach 27% by 2043. Even with this, only about 8.5% of Rwandans had graduated from a tertiary institution with at least a first degree in 2019. Only 9.7% of these graduates had a science and engineering background, which is considered key to the future of work.
To improve access to higher education, the government of Rwanda started the Kigali Innovation City project in 2021, which attracted world-class universities, technology companies and biotech firms to invest in education in Rwanda. As a result, institutions such as Carnegie Mellon University Africa, the University of Global Health Equity, the African Leadership University (ALU) and the African Institute of Mathematical Sciences (AIMS), have been established in Rwanda.
While access to education is important, the quality of education determines the human capital formation of the country. A critical contributor to student performance is the number and quality of teachers available. In the past decade, the number of qualified teachers rose from 91% to 98.6% in primary schools and from 57.4% to 76.5% at the secondary level. The teacher to student ratio at the primary level has also improved from 1:63 to 1:56 in the same period.
In 2019, the average test score for primary and secondary students in Rwanda stood at 24.7 and 36.1, respectively. While the primary test score for Rwanda was slightly below the average of 27.2 for its income peers in Africa, the secondary score was on par with its income peers on the continent. Challenges such as overcrowding classrooms, inadequate facilities and a lack of qualified teachers at pre-primary level due to insufficient government funding still needs to be addressed. In addition, primary level scores in numeracy and literacy exams are low and some teachers are unable to teach in English, the official language of instruction.
There have been efforts to improve quality education in Rwanda. The ‘one laptop per child policy’ introduced in 2008 to integrate information and communications technology (ICT) in primary education currently includes about 76% of schools in Rwanda. This policy was implemented to facilitate the learning of computer skills and enhance the knowledge and understanding of primary students on key subjects including science and mathematics at a basic level.
The government also introduced the smart classroom programme at primary and secondary levels in 2016 to improve teaching and learning outcomes. Through this policy, the government has established two smart classrooms per school that enable both students and teachers to access a variety of educational materials. Currently, the programme has reached 55% of public and government-funded schools. As a result, access to computers currently stands at 84.2% and Internet connectivity access stands at 52.9% in schools, with 65.7% of all schools in Rwanda using ICT in teaching and learning. More students are now exposed to ICT with a computer to student ratio rate of 1:8. In the Current Path, primary and secondary test scores for Rwanda will reach 33.2 and 45.2, respectively, with both above the average of its income peers.
In summary, Rwanda has been able to significantly increase enrolment at primary and, to some extent, secondary levels, but completion rates at secondary levels together with tertiary enrolment, especially in the areas of science and engineering as well as technical and vocational education, remain low. Also, there is a need to improve the quality of education at all levels. As such, the Education scenario represents reasonable but ambitious improvements in the intake, transition and graduation rates from primary to tertiary levels of schooling and increases in the quality of education. It also models substantive progress towards additional vocational training at secondary school level, and increases the number of science and engineering graduates.
Chart 15 shows the mean years of education in the Current Path forecast and the Education scenario, from 2019 to 2043.
In 2019, the mean years of adult education in Rwanda was 4.7 years, almost equal to the average of 4.6 years for low-income countries on the continent. There is no gender disparity in mean years of education in Rwanda meaning that the country has performed better at closing the gender gap. In the Education scenario, the mean years of adult education will rise to 7.1 by 2043, which will be almost a year more than the average of low-income countries in Africa and 0.3 years more than in the Current Path.
The Education scenario will increase average test scores for primary learners to 48 in 2043, which is 5% above the Current Path. In addition, the quality of primary education in the Education scenario will be 27.2% higher than the Current Path average of low-income African countries. By 2043, the average test scores for secondary learners in the Education scenario will improve to 40, which is 19% higher than to the Current Path, and will be 32% higher than the average of low-income countries in Africa.
Chart 16 depicst the structure of the Large Infrastructure and Leapfrogging scenario.
Modern infrastructure can improve productivity, augment healthy lifestyles, boost educational outcomes and facilitate government effectiveness. The Large Infrastructure and Leapfrogging scenario focuses on both physical and digital infrastructure including roads, electricity access and ICT.
Physical infrastructure, such as roads and railways, is a critical driver of economic growth and an important component of development. It facilitates the movement of people, goods and services, promotes intra-country trade and serves as an enabler of social service provision such as education and health. The Rwandan government continues to make efforts to improve the road network in the country. In 2019, the total length of roads in Rwanda was 14 882 km of which only 3 069 km, equivalent to 20.6%, were paved. On the Current Path, by 2043 the total road network in Rwanda will increase to 26 366 km, of which 17 381 km, or 65.9%, will be paved.
Access to rural areas is essential for improving integration and interaction between rural and urban economies, which is important for spurring local economic development and rural access to critical services. The SDG Indicator 9.1.1 refers to the proportion of the rural population who live within 2 km of an all-weather road and is captured in the Rural Access Index. In 2019, the proportion of Rwandans who lived within 2 km of an all-weather road was 55.7% compared to the 44.2% average of low-income countries in Africa. Still, road infrastructure, particularly paved roads, is low in Rwanda.
In 2019, 40.4% of the Rwanda population had access to electricity. This was above the average of 33.3% for low-income countries in Africa. In contrast to 88% of urban residents, only 30.4% of rural dwellers had access to electricity in 2019, depicting a location disparity in favour of urban areas. On the Current Path, access to electricity will reach 75% of the population by 2043, which is above the average of 60% for Rwanda’s income peers. The disparity in electricity access in favour of urban residents will continue as 95% of urban residents will have access to electricity compared to 70% of rural residents by 2043.
As access to electricity in urban and rural areas increases, more households switch from traditional cooking stoves, such as wood-burning and coal stoves, to improved and modern fuel stoves, such as electric and gas cookers. The IFs model distinguishes between three types of cooking stoves: traditional, improved and modern. In 2019, 90.1% of households in Rwanda used traditional stoves for cooking, while 4.7% used improved cooking stoves and 5.2% used modern stoves for cooking. The large numbrer of people in Rwanda that still rely on traditional stoves for cooking, contributes to pollution and carbon emissions, and negatively impacts the health of these households.
Aside from physical infrastructure, technological advancement is essential for economic growth. Technology improves productivity and reduces the transaction costs and bottlenecks associated with doing business. Rwanda’s progress in broadband access, like many other African countries, has lagged over the years. In 2019, the total number of fixed broadband[1Fixed broadband includes cable modem Internet connections, DSL Internet connections of at least 256 KB/s, fibre and other fixed broadband technology connections (such as satellite broadband Internet, ethernet local area networks, fixed-wireless access, wireless local area networks, WiMAX, etc.).] subscriptions in Rwanda was about 2.2 per 100 people — above the low-income Africa average of 1.6 per 100 people. In the Current Path, fixed broadband subscriptions will rise to 47.5 per 100 people by 2043, almost twice the average of 24.8 subscriptions per 100 people for low-income African economies.
Notwithstanding the low subscription to fixed broadband rates, mobile broadband subscription in Rwanda is high. Mobile broadband refers to wireless Internet access delivered through cellular towers to computers and other digital devices. In 2019, Rwanda had a mobile broadband subscription rate of 49.9 per 100 people, more than twice the average of 18.7 for low-income countries on the continent. On the Current Path, mobile broadband subscriptions will rise to 151 per 100 people — 17.2% above the average of its income peers.
Rwanda is yet to be able to increase electricity access to all citizens, especially in rural areas, despite its renewable energy potential.
The Large Infrastructure and Leapfrogging scenario addresses increases the length of paved roads in Rwanda. Additionally, the scenario models a reasonable but ambitious increase in the adoption of and investment in renewable energy technologies, resulting in better access to electricity in urban and rural areas. The scenario includes the adoption of modern technology through accelerated access to broadband, especially fixed, that improves government efficiency and allows for the more rapid formalisation of the informal sector.
Chart 17 presents the improved cookstove usage in the Current Path forecast vs the Large Infrastructure and Leapfrogging scenario, from 2019 to 2043.
Based on the Large Infrastructure and Leapfrogging scenario, almost all Rwandans will have access to electricity by 2043, compared to 84.2% in the Current Path. In this scenario, the composition of cookstove usage in Rwanda will reverse such that only 25.8% of households will use traditional stoves compared to 49.6% in the Current Path by 2043. As a result, the proportion of households expected to use modern fuel for cooking will constitute 72.8% of households in the Large Infrastructure and Leapfrogging scenario compared to 47.8% in the Current Path by 2043.
Chart 18 shows the rural road access in the Current Path forecast vs the Large Infrastructure and Leapfrogging scenario, from 2019 to 2043.
By 2043, the proportion of the rural population with access to an all-weather road will improve slightly to 66.8%, above the average of 51.9% for low-income African countries. In the Large Infrastructure and Leapfrogging scenario, the proportion of the rural population with access to an all-weather road will rise to 70% by 2043, above the Current Path of 67% and the average of 52% for low-income countries in Africa.
Chart 19 presents the structure of the Agriculture scenario.
The agriculture sector has served as the backbone of the Rwandan economy. It employs about 70% of the total population and 89% of rural households practise small-scale farming. It has been an important driver of growth and poverty reduction in the country in the past decade, accounting for about 45% of poverty reduction largely due to the increasing commercialisation of the sector. Rwanda has vast agricultural potential as nearly 61% of Rwandan soil is fertile for agricultural production. Principal agricultural products include pyrethrum, tea, flowers, beans, cassava banana, Irish potatoes, rice, wheat, sugar cane and coffee.
Historically, yield per hectare in Rwanda has been higher than the average of its income peers in Africa. In 1990, Rwanda’s average crop yield of 4.8 metric tons per hectare was almost four times the average of 1.2 tons for its income peers in Africa. By 2019, the average crop yield per hectare in Rwanda had increased to about 7 metric tons, which was 2.5 times higher than the average of low-income countries in Africa and only second to low-income Malawi at 7.8. On the Current Path, yield per hectare will rise to 9.9 tons by 2043. This will still be more than twice the average of low-income African countries but lower than the projected average of 13.8 metric tons in Malawi by 2043.
Challenges facing the sector include the inability of farmers to adopt modern and efficient technology for farming. Overdependence on livestock and rain-fed crop production makes agriculture in Rwanda susceptible to weather patterns. This has been exacerbated by the country’s vulnerability to climate change factors such as land degradation, biodiversity loss and flood risk caused by urbanisation. An estimated area of 11 467 ha is equipped for irrigation in Rwanda, with about 61% mainly for crop production. However, this is in shortage of the estimated 58 million cubic metres irrigation water demand.
Total agriculture production in 1990 stood at 5.291 million metric tons. Of this, 5.1 million metric tons were crops, with the remainder constituting meat production. By 2019, total agricultural production had grown to 9.2 million metric tons. Of this, crop production constituted 96.4%, equivalent to 8.9 million metric tons, meat production 4.3%, and fish production constituted the remainder of the total of production.
There have been efforts to improve agriculture and increase productivity. The Rural Sector Support Programme and the Land Husbandry, Water Harvesting and Hillside Irrigation Project funded by the World Bank led to increased productivity and commercialisation of rural agriculture. This resulted in double the rice and maize yields and triple the potato yields from 2010 to 2018.
In terms of demand, total demand stood at about 5.353 million metric tons in 1990 of which 5.2 million metric tons were for crops, 146 000 tons for meat and the remainder for fish. This meant that excess demand for agricultural products in 1990 was effectively just about 62 000 metric tons. Since then, domestic demand has rapidly outgrown production, and by 2019, agricultural demand exceeded domestic production by 1.3 million metric tons, despite the increase in production. The majority of the demand is for crops, constituting 93.4% of total demand (9.8 million tons). The remaining demand is mainly for meat (416 000 tons), and the lowest demand is for fish (12 000 tons).
Despite the projected increase in domestic production on the Current Path to 14.3 million metric tons in 2043, it will not be enough to meet domestic demand of 20.7 million metric tons. As a result, excess demand for agricultural products will reach 6.4 million by 2043. With total agricultural demand outpacing domestic production, imports will increase. In 2019, Rwanda’s net import for crops stood at 6.5% of total crop demand, which exceeded the average of 6.6% for low-income countries in Africa. In the Current Path, net crop imports will increase to 33% of total crop demand by 2043. This means that Rwanda faces the risk of food shortages in the future if drastic measures are not taken to increase domestic production.
In anticipation of these challenges the government, through land registration and consolidation, settled land ownership and title disputes that previously prevented large-scale farming. It also embarked on an agricultural modernisation programme which facilitated access to credit for farmers and the adoption of improved cultivation methods. As a result, about 81.3% of households in Rwanda are food secure, have acceptable diets and used a lower proportion of their budget to buy food in 2016.
However, there is a growing threat to food access emanating from exogenous shocks. The 2018 World Food Programme report indicates that the proportion of households that face seasonal food access challenges doubled from its 2012 figure to 40% in 2018. Also, about 40% of households reported experiencing at least one shock which affects access to food in a year. These shocks are mostly weather-related, including irregular rains, drought, prolonged dry seasons, pests and diseases, especially in the Eastern Province and the Southern Province.
Although yield per hectare in Rwanda’s is relatively high compared to its income group peers, the country still faces challenges in the sector and domestic food demand is forecast to exceed agriculture production over the forecast horizon. As a result, the Agriculture scenario represents reasonable but ambitious increases in yields per hectare (reflecting better management and seed and fertiliser technology), increased land under irrigation, and reduced loss and waste. It includes an increase in calorie consumption, reflecting the prioritisation of food self-sufficiency above food exports as a desirable policy objective.
Chart 20 shows agriculture production and demand in the Current Path forecast and Agriculture scenario, from 1990 to 2043.
In the Agriculture scenario, yield per hectare will increase to 13.6 metric tons by 2043 — 3.8 metric tons per hectare higher, or a 38% improvement, compared to the Current Path. By then, the average yield per hectare in Rwanda will almost be on par with the average of 13.8 metric tons for Malawi. Improvements in yields will also impact total agricultural production. In the Agriculture scenario, total agricultural production will rise to 19.9 million tons — 5.6 million metric tons, or 40%, more than the Current Path by 2043. Annual crop production in Rwanda will increase to 17.8 million tons in the Agriculture scenario by 2043. This will be 5.1 million tons, or 40%, higher than the Current Path for that year. Meat production will increase to 2.1 million tons from 2019 to 2043 in the scenario, representing a 35% increase above the Current Path.
Demand for agricultural products will rise significantly to 27.3 million metric tons by 2043, constituting an increase of 32% above the Current Path of 20.7 million metric tons. Demand for crops in the scenario will reach 18.7 million metric tons, resulting in 32% growth above the Current Path in 2043. Likewise, meat demand will grow to 2.1 million metric tons, representing 35% more than the Current Path. Fish demand will also increase to 591 000 tons in the scenario compared to 437 000 tons on the Current Path by 2043. The Agriculture scenario reduces crop import dependency to 29% by 2043. This will be almost on par with the Current Path average of 28% for low-income countries in Africa.
Chart 21 presents the structure of the Manufacturing scenario.
Historically, the manufacturing sector is a key job creator and export promotion sector. It allows for the structural transformation of economies towards higher productivity, with spillover effects to other sectors due to its backward and forward linkages with the agriculture sector and the service sector.
The Rwandan government recognises the importance of the manufacturing sector in job creation and skills development. However, growth in the sector has been slow as its contribution to exports and GDP remain small. Rwanda’s manufacturing industry is concentrated in seven sub-sectors: food; beverages and tobacco; textiles and clothing; wood, paper and printing; chemicals, rubber and plastics; non-metallic minerals; and furniture. Over 70% of its manufacturing output comes from food, beverages and tobacco production alone.
The manufacturing sector is confronted with several challenges. Key among them include real constraints such as transport costs and its landlocked geography as well as economic and financial constraints. Also, there is a low level of human resource development due to a shortage of skilled workers with technical know-how. To boost the sector, the government has increased the allocation to the economic recovery fund from US$102 million to US$358 million, aimed at supporting businesses in the manufacturing, education, tourism and hospitality, agro-processing, and the transport and logistics sectors that were severely affected by the COVID-19 pandemic. It has also embarked on some privatisation of state-owned enterprises. For instance, major tea and coffee factories have been privatised as well as public utilities and state-owned telecommunications. As it transitions into greater private sector participation in the economy, there are several challenges that need to be addressed. Low domestic savings and the shortage of skills and high cost of energy are some of the key challenges hindering private investment identified by the World Bank.
By 2019, the service sector contributed US$6.9 billion, equivalent to 52.9% of GDP. The agriculture sector, currently the second-largest contributor to GDP, contributed US$3.3 billion, equivalent to about 25.7% of GDP. The manufacturing sector contributed US$1.5 billion, representing 11.5% of GDP in 2019, while the ICT sector contributed US$566.8 million, constituting 4.4% of GDP. The contributions of the energy and materials sectors in 2019 were valued at US$345.5 million (2.6% of GDP) and US$365.2 million (2.8% of GDP), respectively.
The country is also gradually diversifying its economy from its initial dependence on agriculture. Emerging sectors such as tourism, electricity, infrastructure and construction, together with the traditional agriculture and service sectors, are the drivers of GDP growth. For instance, tourism currently contributes about 10% to GDP.
On the Current Path, the service sector will more than quintuple in size to US$36.8 billion by 2043, which corresponds to 61.8% of GDP. By 2043, the manufacturing sector will overtake the agriculture sector as the second-largest contributor and contribute about 9 percentage points more than agriculture to the economy. This will correspond to contributions of US$9.7 billion and US$4.3 billion for the manufacturing and agriculture sectors, respectively. The growth in the share of the manufacturing sector relative to the agriculture sector is associated with the structural transformation of an economy, which can lead to job creation. By 2043, the materials sector in Rwanda will overtake the ICT sector as the fourth largest contributor to GDP with a share of 6.7% of GDP, valued at US$4.1 billion. The ICT and energy sectors’ contributions will be valued at US$3.8 billion and US$995 million corresponding to 6.4% and 1.7% of GDP, respectively.
At the initial stages of manufacturing, unskilled labourers are usually negatively affected. As the economy shifts towards aggressive manufacturing, businesses begin to move from labour-intensive manufacturing towards capital intensive manufacturing. Ultimately, labour, particularly unskilled labour, is displaced by capital, which may worsen poverty and inequality.
Welfare losses are usually compensated for with social grants such as welfare transfers to compensate for the loss in income, especially to unskilled labour in the short term. These transfers could ease the disruption and displacement of labour caused by a transition towards aggressive manufacturing in the economy.
Welfare transfers in Rwanda are low compared to its income peers on the continent. In 2019, the total welfare transfers to Rwandan households amounted to 1.5% of GDP, which is below the average of 2% for low-income African countries. On the Current Path, government welfare transfers to households will increase to about 4% of GDP. Despite this increase, it will still be below the projected average of 6% of GDP for its income peers in Africa.
With weak manufacturing growth in Rwanda, the Manufacturing scenario models robust manufacturing growth through greater investments in R&D and investment in the manufacturing sector. It is also accompanied by an increase in welfare transfers (social grants) to moderate increases in inequality that are often associated with the initial stages of industrialisation due to an initial consumption crunch caused by a reallocation of resources to push the manufacturing sector.
Chart 22 presents the value added by the manufacturing sector in the Current Path forecast vs Manufacturing scenario, from 2019 to 2043.
In the Manufacturing scenario, the manufacturing sector’s contribution to GDP significantly increases. By 2043, the manufacturing sector will contribute about 36% of GDP, equivalent to US$21.7 billion, in the Manufacturing scenario, almost twice its contribution in the Current Path. The service sector will continue to dominate GDP contribution (47% or US$28.1 billion), albeit at a lower level than the Current Path. On the Current Path, the service sector will contribute 62% (valued at US$36.8 billion). Likewise, the share of agriculture in this scenario will marginally decline from 6.9% of GDP (US$4.2 billion) relative to the projected 7.1% (US$4.2 billion) in the Current Path.
The materials, energy and ICT sectors will also witness a decline in their performance in the scenario compared to the Current Path. By 2043, the materials sector’s share to GDP of 4.6% (valued at US$2.7 billion) in the scenario will be 2.2 percentage points less than the Current Path. Similarly, the shares of GDP by ICT and energy will also be 1.7 and 0.1 percentage points lower relative to the Current Path, respectively. Thus, the Manufacturing scenario has the potential to change the structure of the economy from over-reliance on low-end services and agriculture to manufacturing, which is the catalyst for industrial revolution and job creation.
Chart 23 shows employment in the manufacturing sector in the Current Path forecast vs the Manufacturing scenario, from 2019 to 2043.
One of the problems facing many African economies is the inability of economic growth to translate into job creation, which leads to jobless growth. The manufacturing sector is at the heart of economic transformation and job creation. In 2019, 1.4 million people were employed in the manufacturing sector in Rwanda. The Manufacturing scenario will almost double this estimation to 4.7 million by 2043. This constitutes almost 2 million additional jobs compared to the Current Path for the same year. It means that the Manufacturing scenario can increase employment in the manufacturing sector by about 73% compared to the Current Path.
Chart 24 shows the structure of the AfCFTA scenario.
The benefit of trade is to enable countries to specialise in the production of commodities they have a comparative advantage in and export them while importing those that are relatively costly to produce or unavailable in their home countries. Trade also opens up factors of production to be distributed more efficiently and increases the total factor productivity of firms through competition and increased knowledge transfers.
The Rwandan government aims to turn the country into a regional trade hub. To achieve this, it has invested in the construction of several international business-class hotels, a convention centre, an inland water container terminal and a bonded warehouse. In addition, there is the ongoing construction of Bugesera International Airport, expansion in the fleet for RwandaAir, the national carrier, which is in the process of securing a permit for a direct flight from Kigali to the US.
Rwanda belongs to several custom and market unions. It is a member of the East African Community (EAC), the Common Market for Eastern and Southern Africa (COMESA) and has ratified the African Continental Free Trade Area (AfCFTA). In 2009, Rwanda became a member of the Commonwealth, and the country joined the OECD Development Centre in 2019. In addition to the above, it has concluded a Trade and Investment Framework Agreement (TIFA) with the US as well as a Bilateral Investment Treaty (BIT). Rwanda also belongs to the Northern Corridor initiative together with surrounding and nearby countries, such as Kenya, Uganda, South Sudan and Ethiopia, and is a leader of the Central Corridor initiative, which includes Burundi, DR Congo, Tanzania and Uganda. The large infrastructure projects proposed under these initiatives will reduce transportation and business costs across the region.
Moreover, the country enjoys preferential access to developed markets, and it is allowed to export duty-free and quota-free products to the European market. Rwanda can also export under the Africa Growth and Opportunity Act (AGOA), which gives duty-free access to the US market for 6 400 products until 2025. Despite these advantages, because of its landlocked position, Rwanda has larger transport costs than its neighbours that are closer to the coast. Its distance from the ports of Mombasa and Dar es Salaam make it expensive to import and export goods.
Like many of its low-income African peers, Rwanda generally has a weak export sector albeit with large potential. Rwanda’s principal exports include coffee, hides and skins, gold, tin, tantalum, tungsten, tea, cassiterite, coltan, wolfram and pyrethrum. The major export destinations for Rwanda’s coffee are the US and Europe and that of tea are Pakistan and Middle Eastern countries. In 1990, the total volume of export in Rwanda was at US$175.5 million, constituting 5.6% of GDP, lower than the average of 16.9% for its income peers. It has since grown significantly.
By 2019, the value of Rwanda’s exports stood at US$2.5 billion, equivalent to 21.8% of GDP, overtaking the average of 18.4% for low-income African countries. Almost 45% of Rwanda’s export is from the service sector, constituting about 9.1% of GDP, followed by the manufacturing sector, which contributes about 19%, valued at about 4% of GDP. Export of agriculture and materials represent 3.2% and 3.5% of GDP, respectively, equivalent to 16% and 17% of total export, respectively, with the remainder sourced from ICT and energy. On the Current Path, total exports will equal 27.1% of GDP, equivalent to US$16.1 billion, in 2043, almost on par with the average of its income peers in Africa.
Total imports grew from US$441.5 million, equivalent to 14.1% of GDP, in 1990 to reach US$4.7 billion, representing 36.1% of GDP, in 2019. At that rate, Rwanda’s total import as a proportion of GDP was higher than the estimated 28.7% average of low-income African countries in the same year. Rwanda’s import growth is estimated at 20% per annum. The main imports of Rwanda include electrical machinery and parts; electronic equipment and parts; machinery appliances and parts; vehicles and accessories; cereals and other foodstuffs; pharmaceutical products; construction equipment, including iron and steel; and energy and petroleum products. These imports are mostly sourced China, Europe, the US, Kenya, India, the United Arab Emirates and Tanzania. On the Current Path, total import value will rise to US$21.3 billion, representing 35.7% of GDP, by 2043 by which time it will be almost equal to the 36% of GDP for its income peers on the continent.
Chart 25 depicts the trade balance in the Current Path forecast and AfCFTA scenario, from 2019 to 2043.
Rwanda imports more than it exports and therefore has a trade deficit. While the country imports large volumes of mostly finished or processed goods, its export quantities are small, and most of it is raw materials, with little or no value addition occurring within the country. This results in low export revenues and higher import expenditure. Rwanda’s trade deficit in 2019 represented 14.3% of GDP, above the average of 10.3% for low-income African countries on the Current Path.
Thus, although Rwanda’s economy is open to trade, its trade with other African countries is limited compared to China, the EU and the US. The country has ratified the AfCFTA agreement, which is expected to improve its trade relations with the rest of the continent.
The AfCFTA scenario represents the impact of the full implementation of the agreement by 2043 through increases in exports, improved productivity, increased trade and reduced tariffs.
Throughout the forecast period, the AfCFTA scenario leads to a faster improvement in Rwanda’s trade balance than the Current Path. By 2043, Rwanda’s trade deficit in the Current Path will constitute about 8.5% of GDP, whereas in the same year, the AfCFTA scenario will mitigate this situation leading to a deficit of 7.6% of GDP. These figures suggest that Rwanda stands to benefit from trade liberalisation through the full implementation of the AfCFTA that will improve competitiveness, particularly in growing the country’s manufacturing sector.
Chart 26 presents the structure of the Financial flows scenario.
Rwanda's clear commitment to development means that it receive significant levels of support from international donor agencies, such as the World Bank, for public investment in several sectors such as education and renewable energies. For instance, the World Bank-supported Urban Development Project has led to an increase in urban roads and stand-alone drainage for six cities.
A key contributor to the success of Rwanda has been government’s policies that have facilitated a good investment climate and have resulted in rapid increases in FDI. Over the last decade, the country has moved by 100 places to the second best place to do business in Africa and 38th globally, according to the World Bank Doing Business 2020 report. The successful implementation of doing-business reforms have created an enabling, competitive and favourable business environment. The establishment of the Rwanda Development Board (RDB), a one-stop investment promotion centre and a new investment code, has helped to improve the business environment. In Rwanda, registering a company only takes a few hours and obtaining an investment certificate takes two days. Permits and documents are obtained from the reliable and efficient RDB without much difficulty. There are also government-initiated loan guarantees and liberalisation of selected economic sectors meant to encourage investment.
The Investment Promotion Law further provides incentives to investors in export-oriented activities and industrial manufacturing. These consist of a preferential income tax rate, a corporate income tax holiday of up to seven years, exemption from customs tax for products used in export processing zones, exemption from capital gains tax, value-added tax refunds, accelerated depreciation at a rate of 50% for the first year for new and used assets, and immigration incentives, such as issuance of residence permits to investors and dependants. As a result, the value of registered investment increased by 515% from US$400 million in 2010 to US$2.006 billion in 2019.
However, though FDI inflows in absolute terms have been increasing, FDI as a percentage of GDP to Rwanda, like most low-income countries, remains low. Between 1990 and 2019, FDI inflows ranged from 0.1% of GDP to 4% of GDP. The total amount of FDI received by Rwanda in 2019 was equivalent to 2.5% of GDP, which was below the average of 3.8% of GDP for low-income African countries. The energy sector accounts for 45% of all registered investment and manufacturing accounts 30% of the registered investment. The remaining 25% is in agriculture, construction, services, ICT and mining.
On the Current Path, FDI inflows are expected to marginally rise to 2.9%, significantly below the Current Path average of 5.2% for low-income countries on the continent by 2043.
On a per capita basis Rwanda is one of the highest recipients of foreign aid in Africa. With a strong record of using aid effectively to achieve set objectives, the country receives the largest amount of donor aid in the region. Over 40% of the national budget is funded by foreign aid. Rwanda has the highest donor aid per capita of about US$85 in East Africa, above countries like Uganda at US$43 and Kenya at US$60. This effectively means that the denial or absence of aid could be detrimental to the economy in the short term.
In 1990, the total aid received by Rwanda constituted 14.2% of GDP, compared to 11.3% received by low-income African countries in the same period. By 2019, total aid as a percentage of GDP was 14.8% (equivalent to US$2 billion). This was significantly higher than the average of 9.2% for low-income countries in Africa. On the Current Path, aid willdecline to constitute 7% of GDP although the absolute value will increase to US$4.1 billion. Even at the rate, it will still be higher than the average of 4.6% of GDP for its peers in Africa.
Remittances in Rwanda are low compared to its income peers in Africa. This can be as a result of the 1994 genocide that caused many Rwandans to flee the country to live as refugees in neighbouring countries. As such, there were outflows from Rwanda to support these refugees, especially from family members. However, this trend of outflows reversed in 2009 such that in 2019 Rwanda received US$113.4 million in remittances, which constituted 0.9% of GDP. However, this was lower than the average of 2.5% for low-income African countries. On the Current Path, it will increase to US$541.7 million by 2043 (0.9% of GDP), exceeding the 0.4% of GDP average for low-income countries.
The Financial Flows scenario represents a reasonable but ambitious increase in worker remittances and aid flows, increases in the stock of FDI and additional portfolio investment inflows as well as representing a decline in outward financial flows that emulates a reduction in illicit financial outflows.
Chart 27 presents government revenue in the Current Path forecast and Financial Flows scenario, from 2019 to 2043.
Higher external inflows in the form of FDI, aid and remittances are likely to increase government revenue. For instance, increased FDI means higher GDP growth which in turn increases revenues accrued to the government through corporate and income taxes, royalties and indirectly through valued-added tax. In 2019, the government’s total revenue in Rwanda was US$3.4 billion, equivalent to 26.3% of GDP — higher than the average of its income peers in Africa. Similarly, Rwanda’s revenue without aid at 11.5% of GDP is above the average of 9.7% for low-income countries in Africa. Relative to its peers, the higher revenue-to-GDP ratio in Rwanda demonstrates the higher government capacity and effectiveness and low corruption among state institutions which enables it to collect more revenue than its peers.
In the Financial Flows scenario, government revenue will rise to US$18.7 billion in 2043, representing 27.1% of GDP below the average of 21.5% for low-income countries in Africa in the same year. Compared to the Current Path, the Financial Flows scenario will improve government revenue in Rwanda by almost an additional US$3.3 billion by 2043.
Chart 28 presents GDP per capita in the Current Path forecast and all scenarios, from 2019 to 2043.
The GDP per capita is generally used to measure the standard of living and is the most widely used and accepted index used to compare welfare among countries. This study uses GDP per capita measured in purchasing power parity (PPP) for this analysis. Rwanda’s GDP per capita of US$2 219 in 2019 is the fifth largest GDP per capita among the 23 low-income countries in Africa and 21% higher than the group average of US$1 832 for low-income countries in Africa. This figure represents a tremendous improvement of about 140% from the US$933 it recorded in 1990, which made it the eighth lowest among the low-income group in Africa. Between 2009 and 2019, GDP per capita grew at an average of 5%.
On the Current Path, GDP per capita in Rwanda will reach US$4 937 by 2043, making it the second largest among the low-income African countries, only lower than Uganda. At this rate, the country’s GDP per capita will be 41.3% higher than the average of US$3 494 for its income peers in Africa. Indeed, by 2050, which marks the end of the implementation of Rwanda’s Vision 2050, the country’s GDP per capita of US$6 691 on the Current Path will be the highest among the low-income countries in Africa. However, this will be about half the target of US$12 476 by 2050 expected by the Rwandan authorities.
The scenarios with the greatest impact on GDP per capita by 2043 will be the Governance scenario, followed by the AfCFTA scenario and the Large Infrastructure and Leapfrogging scenario. In the Governance scenario, GDP per capita will rise to US$6 010 by 2043, representing a 21.7% increase over the Current Path for that year. It means that the Governance scenario can raise GDP per capita in Rwanda by an additional US$1 073 by 2043. Regime stability and good governance in the form of adherence to the rule of law, reduced corruption and improved transparency and accountability lead to more rapid economic growth.
In the AfCFTA scenario, Rwanda’s GDP per capita will increase to US$5 546 by 2043, which represents an increase of US$609 (or 12.3%) compared to the Current Path in 2043. This indicates that Rwanda has considerable potential to increase GDP if it takes advantage of the full implementation of the AfCFTA. Trade between African countries has the benefit of increasing Rwanda’s exports, as it provides access to a much larger market and can also improve the country’s manufacturing sector. This could lead to more rapid economic growth and increased employment in key sectors.
In the Large Infrastructure and Leapfrogging scenario, Rwanda’s GDP per capita will increase to US$5 473 by 2043. This is an increase of US$536 (or 10.9%) compared to the Current Path of US$4 937 for 2043. Broadband accessibility and use have the potential to increase GDP through its effect on reducing transaction costs for businesses. It can also help firms adopt efficient technologies, which can improve productivity and ultimately lead to growth. This also means that if Rwanda’s huge informal sector is formalised it can increase GDP, government revenue and productivity.
The Agriculture scenario will increase GDP per capita to US$4 981, US$44.3 more than the country’s Current Path by 2043. The marginal impact of the Agriculture scenario on GDP per capita reflects the declining share of agriculture’s contribution to GDP expected to occur over the period.
Chart 29 depicts poverty in the Current Path forecast and all scenarios, from 2019 to 2043.
There are numerous methodologies for and approaches to defining poverty. We measure income poverty and use GDP per capita as a proxy. In 2015, the World Bank adopted the measure of US$1.90 per person per day (in 2011 international prices), also used to measure progress towards achieving SDG 1 of eradicating extreme poverty. To account for extreme poverty in richer countries at slightly higher levels of income than in poor countries, the World Bank introduced three additional poverty lines in 2017:
- US$3.20 for lower-middle-income countries
- US$5.50 for upper-middle-income countries
- US$22.70 for high-income countries[2In May 2022, the World Bank announced that it would be using US$2.15 in 2017 prices as the new international poverty line (to measure progress towards the Sustainable Development Goals) instead of US$1.90. Instead of the previous US$3.20 for low-middle-income countries, the adjusted poverty line is now $3.65, and $6.85 for upper-middle-income countries (instead of $5.50 in 2011 prices). The World Bank has not yet announced the new poverty line for high-income countries, previously set at $22.70 in 2011 prices. The World Bank intends to release the associated poverty estimates in 2023. In the meanwhile, this site continues to use the US$1.90, US$3.20, US$5.50 and US$22.70 poverty lines.]
As a low-income country, Rwanda uses the US$1.90 benchmark for extreme poverty. Post-genocide, the government of Rwanda has worked hard to eliminate extreme poverty in the country. In 1990, 5.6 million Rwandans, representing almost two-thirds of the population, lived below the poverty line of US$1.90, though above the average of 69.2% for low-income countries in Africa. Rwanda has relatively higher poverty rates than its continental peers with similar income per capita, as poverty reduction has become less responsive to growth in recent years.
Through the Vision 2020 Umurenge Programme (VUP), poor and elderly people in Rwanda receive cash transfers and public work payments as part of measures to tackle poverty. However, this programme has been criticised for not tackling the root causes of poverty that is widespread in rural areas. Also, these welfare programmes have been criticised for being concentrated mainly in Kigali.
The private sector, which is supposed to be the engine of growth, has limited economic participation partly due to low domestic savings. In addition to this, many of the rural farmers still practise subsistence agriculture, which earns them little disposable income. Moreover, overpopulation and underemployment as a source of poverty will remain the main socio-economic challenges for the next decade.
By 2019, 6.4 million Rwandans lived below this threshold, equivalent to 52.4% of the population, 6.6 percentage points below the average of low-income countries. The decline in poverty over the years can partly be attributed to the effective implementation of social protection programmes that have contributed to improving the standard of living and livelihood opportunities for many Rwandans.
On the Current Path, the number of people living in poverty in Rwanda will stand at 3.5 million, constituting 17.6% of the population, by 2043. This corresponds to a decrease of 32.4 percentage points in the extreme poverty rate over 24 years. By this time, the poverty rate in Rwanda will be slightly (0.53 percentage points) lower than the average of its income peers in Africa.
The Governance scenario has the greatest potential to reduce extreme poverty in Rwanda. In the Governance scenario, the number of poor people will decline to 2.4 million (equivalent to 12% of the population), compared to the Current Path of 3.5 million people (17.6%) by 2043. It means that improved governance in the form of greater transparency and accountability for public resources has the potential for 1.1 million fewer people to live in extreme poverty by 2043.
In the Financial Flows scenario, 2.8 million Rwandans (25% of the total population) will be living in extreme poverty by 2043 making it the scenario with the second-largest impact on poverty reduction. This means that there will be 705 000 fewer poor people in this scenario (or 3.7 percentage points below the Current Path) compared to the Current Path. The huge impact of the scenario on poverty reduction in Rwanda demonstrates the importance of financial flows particularly aid in fighting extreme poverty in the country.
The AfCFTA scenario has the third-largest impact on poverty reduction in Rwanda. In the scenario, 2.85 million people will live in extreme poverty by 2043, constituting 14.1% of the population. This will be 3.6 percentage points lower than the Current Path, and equivalent to a reduction of about 655 000 people living in extreme poverty. Trade openness will reduce poverty in the long term after initially increasing it due to the redistributive effects of trade. Therefore, a continental free trade agreement that reduces tariffs and non-tariff barriers for Rwanda could increase the country’s competitiveness especially in sectors in which it has comparative advantage. In the long term, as the economy adjusts and it produces and exports its comparatively advantaged (lower relative cost) goods and services, poverty rates will decline.
The Combined scenario combines all eight sectoral scenarios, namely Governance, Demographics and Health, Education, Large Infrastructure and Leapfrogging, Agriculture, Manufacturing, AfCTA and Financial Flows.
In this section, the study compares the Combined scenario with the Rwanda Vision 2050 targets for 2035 and 2050.
Chart 30 shows GDP in Current Path forecast and Combined scenario, from 2019 to 2050.
Rwanda’s GDP will rise to US$126.7 billion in the Combined scenario, which is more than twice the US$59.6 billion in the Current Path by 2043. By 2050, total GDP will rise further to US$267.1 billion. This will exceed the Current Path of US$97.2 billion, meaning that the Combined scenario will increase the size of the economy by an additional US$169.9 billion by 2050 — an increase of 174.8% compared to the Current Path.
Chart 31 shows GDP per capita in the Current Path forecast and the Combined scenario, from 2019 to 2050.
In the Combined scenario, Rwanda’s GDP per capita will increase to US$5 109 by 2035. This will be US$1 565, or 44%, higher than the US$3 544 on the Current Path and US$1 073, or 26.6%, more than the target of US$4 036 set for 2035 indicated in the Vision 2050 blueprint. By 2050, Rwanda’s GDP per capita in the scenario will reach US$16 262, almost 30.3% more than its target of US$12 476 and more than twice the amount of US$6 691 projected on the Current Path.
The Combined scenario can lead to additional US$3 786 by 2050 compared to the Vision 2050 target and additional US$9 570 compared to the Current Path in the same year. It means that Rwanda has the potential to become a high-income country by 2050 as stipulated in the Vision 2050 document; however, this will require targeted intersectoral policy interventions which are necessary for achieving sustainable development in Rwanda.
Chart 32 presents the value added by sector in the Current Path forecast and Combined scenario; for 2019, 2035 and 2050.
The structure of the Rwandan economy will undergo significant transformation in the Combined scenario. By 2035, the service sector will still be the largest contributor to GDP at 54% although this will be lower than the Current Path of 59.8% but higher than the target of 49% in the Vision 2050. The manufacturing sector will be the second-largest contributor to GDP in the scenario by 2035 with a share of 21.8% — higher than the Current Path of 14.3% but below the 24% target in the Vision 2035. The share of the agriculture sector will decline to 10.6% in the Combined scenario compared to 11.6% in the Current Path in 2035. However, this will be lower than the 21% target in the Vision 2050 for the same year. In the Combined scenario, the materials, ICT and energy sectors will constitute 5.9%, 5.5% and 2.1%, respectively.
Manufacturing will overtake the service sector to be the leading contributor to GDP by 2050, contributing about 62.2% instead of 17.1% in the Current Path. At this rate, it will be almost twice the target of 33% in the Vision 2050. The share of the service sector in the Combined scenario will decline to 25.7% compared to the Current Path of 62.6% and the Vision 2050 target of 42% by 2050. The contribution of the agriculture sector will significantly decline to about 3% of GDP in the scenario against the 4.5% in the Current Path. This will be 18 percentage points below the target of 21% stated in the Vision 2050 document in 2050. The materials sector will contribute 4.7% to GDP, while the ICT and energy sectors will contribute 3.8% and 0.7%, respectively, to GDP in the scenario by 2050.
Chart 33 presents poverty in the Current Path forecast and the Combined scenario, from 2019 to 2050.
In the Combined scenario, both the number and proportion of poor people in Rwanda will significantly decline. By 2043, about 403 000 people in the country will be living in extreme poverty. This means that, compared to the Current Path, 3.1 million more people could be lifted out of poverty by 2043 in this scenario. This is equivalent to a decline of 15.5 percentage points compared to the Current Path of 2.1% in 2043. In addition, the proportion of poor people in Rwanda in the Combined scenario is 16.1 percentage points lower than the average (18.1%) for low-income African countries by 2043. Indeed, by 2050 only about 9 000 people, equivalent to 0.04% of the population, will be living in extreme poverty meaning the country can meet its target of eliminating poverty in the Combined scenario.
Chart 34 shows life expectancy in the Current Path forecast and the Combined scenario, from 2019 to 2050.
The Combined scenario will reduce Rwanda’s infant mortality rate to 6.6 deaths per 1 000 live births in 2035 and to 4.2 deaths per 1 000 live births by 2043. It means that Rwanda will surpass its Vision 2050 target of 25 deaths per 1 000 live births by 2035 and 18 deaths per 1 000 live births by 2050 in both the scenario and Current Path. The infant mortality rate will decline further reaching 11.7 deaths per 1 000 live births in the Current Path compared to 4.2 deaths per 1 000 live births in the scenario by 2043. Indeed, by 2050, marking the end of the implementation of the Vision 2050, the infant mortality rate will decline to 2.3 deaths per 1 000 live births. This will be about seven fewer deaths per 1 000 live births than in Rwanda’s Current Path and about 16 fewer deaths than the Vision 2050 target.
In the Combined scenario, life expectancy will increase to 75.2 years by 2035, which will be 1.5 years higher than the country’s Current Path in the same year and about 3.5 years higher compared to the target of 73.1 years set in the Vision 2050. By 2050, the average life expectancy will rise to 78.7 in the scenario, which will be about two years more than the Current Path and almost six years more than the target of 73 years in the Vision 2050. In fact, in the Combined scenario, Rwanda achieves its Vision 2050 target on life expectancy as early as 2029.
Chart 35 presents domestic Gini coefficient in the Current Path forecast and the Combined scenario, from 2019 to 2050.
The benefits of economic growth may not be evenly distributed in a country due to inequality. High levels of inequality have many negative effects including a breakdown of social structure and cohesion, which can result in instability. The Gini coefficient is the standard measure of the level of inequality in a country. A higher score depicts greater inequality while a lower score shows a more equal country. Historically, Rwanda has had high levels of inequality despite improvements over the years.
In 2019, Rwanda’s Gini coefficient was 0.44 compared to the score of 0.40 for the average low-income country in Africa. This makes Rwanda the seventh most unequal country among the 23 low-income countries in Africa and the 21st most unequal in Africa. By 2035, Rwanda’s Gini coefficient will improve to 0.42 and further reach 0.41 by 2050 on the Current Path. In the Combined scenario, inequality in Rwanda will reduce more rapidly than on the Current Path, reaching 0.36 by 2035 and 0.32 by 2050, which means that the Combined scenario has the potential to reduce inequality in Rwanda by 28% relative to the Current Path in 2043. Despite this improvement in inequality in the Combined scenario, it will not be enough to achieve the target of 0.35 by 2035 and 0.3 by 2050 as stipulated in the Vision 2050 strategy document.
Chart 36 presents carbon emissions in the Current Path forecast and the Combined scenario, from 2019 to 2050.
Carbon is released in many ways, but the three most important contributors to greenhouse gases are carbon dioxide (CO2), carbon monoxide (CO) and methane (CH4). Since each has a different molecular weight, we use carbon. Many other sites and calculations use CO2 equivalent.
Environmental sustainability in Rwanda continues to be a challenge with increasing population density and deforestation, among other factors. The country was ranked 124th out of 182 countries on the 2020 Country Index of the Notre Dame Global Adaptation Initiative (ND-GAIN), which measures a country’s susceptibility to climate change. The cost of climate change to Rwanda will reach an additional 1% of GDP by 2030 and 4% of GDP by 2050. This emanates from shifts in seasonal variations in temperature, extreme weather conditions in the Northern Province and Western Province and droughts in the low-lying Eastern Province damaging infrastructure, health, agriculture and livelihoods. However, the country is taking steps to ameliorate the situation.
Rwanda’s attempt to control climate change by adopting the environment and climate change policy is in line with its National Strategy for Transformation. In its updated Nationally Determined Contributions (NDC), the country estimated a 38% reduction of greenhouse gas emissions, equivalent to 4.6 million tonnes of carbon dioxide equivalent, valued at US$11 billion, compared to business as usual scenario by 2030. To achieve this, the country has created the Rwanda Green Fund, which has raised US$217 million to finance investment in renewable energy, sustainable urbanisation and climate smart agriculture.
In 2019, Rwanda released about 1 000 tons of carbon, reflecting the low levels of carbon emissions in the country. This makes it the 38th-largest emitter of carbon in Africa and 13th-largest emitter among the 23 low-income African countries. On the Current Path, carbon emissions will quintuple to 5 000 tons by 2043 from its low base in 2019. In the Combined scenario, Rwanda’s total carbon emissions will rise to 14 000 tons and will be twice higher than what is estimated in the Current Path by 2050. It means that achieving sustainable economic development will come at the cost of environmental pollution in Rwanda. However, the country can rely on its renewable energy potential to reduce carbon emissions.
Rwanda has made substantive development strides over the last three decades, driven by strong and visionary leadership and the implementation of strategic development plans. This progress has been marked by dynamic economic growth, improved governance and significant investments in key sectors such as education, health and infrastructure. Rwanda's Vision 2050 sets ambitious goals for achieving upper-middle-income status by 2035 and high-income status by 2050, aiming to provide a high quality of life for all citizens.
Despite these achievements, Rwanda still faces considerable challenges. Structural economic issues include a balance of payments deficit, rising foreign debt, a small industrial sector and a large informal sector. The Current Path analysis indicates that Rwanda may not fully achieve its Vision 2050 targets of high-income status, the elimination of extreme poverty and high quality of life by 2050 without further policy interventions.
However, the Combined scenario shows that with the right set of targeted intersectoral policies, Rwanda can substantially advance in human and economic development. By integrating improvements across governance, health, education, infrastructure, agriculture, manufacturing, trade and financial flows, Rwanda's GDP will reach US$267.1 billion by 2050, with GDP per capita rising to US$16 262. This would position Rwanda as a high-income country, far exceeding the Current Path.
In this scenario, Rwanda can significantly reduce extreme poverty, potentially lowering the rate to just 0.04% of the population (about 9 000 people) by 2050. The country’s efforts in enhancing governance, boosting trade, investing in renewable energy and promoting inclusive growth are crucial to achieving these targets. Moreover, transitioning fully to renewable energy sources could make these advancements more sustainable and cost-effective.
In conclusion, while Rwanda has achieved remarkable progress, continued and enhanced policy efforts are essential to overcome ongoing challenges and realise the Vision 2050 goals. By implementing comprehensive and targeted interventions across all sectors, Rwanda can ensure sustainable development, economic resilience and improved living standards for all its citizens by 2050.
Specifically, policymakers in Rwanda should:
- Invest in education and health to leverage the youth bulge and increase the working-age population. Enhance vocational training, science and engineering education to improve workforce skills and address the low secondary completion rates and inadequate facilities.
- Foster innovation and technology adoption by supporting initiatives like the Kigali Innovation City project which aims to create a vibrant ecosystem for innovation and entrepreneurship, attracting tech startups, research institutions and investors to Rwanda.
- Formalise the informal sector, which employs over 75% of the workforce, to increase economic resilience and improve government revenue. Implement policies to achieve macroeconomic stability including increasing domestic savings and prudent debt management.
- Increase adoption of modern farming technology and irrigation to reduce reliance on rain-fed agriculture and vulnerability to climate change. Promote advanced seed and fertiliser technology, better land management and reduced waste to meet growing food demand.
- Expand the road network and increase electricity access for the population, with a focus on rural areas. Improve urban planning and service delivery in Kigali to manage rapid urbanisation challenges.
- Strengthen democratic processes and anti-corruption measures to improve governance in the country. Invest in renewable energy technologies to increase electricity access and improve government efficiency. Increase R&D and investment in the manufacturing sector to boost its GDP contribution. Address challenges such as high transport costs, economic and financial constraints and skills shortages.
- Leverage Rwanda's membership in regional and international trade organisations to boost exports and reduce the trade deficit. Implement AfCFTA to enhance competitiveness and support the manufacturing sector's growth.
- Develop policies to manage the environmental impact of economic growth. Support climate-smart agriculture and renewable energy projects, for example through the Rwanda Green Fund.
- Expand and improve the Vision 2020 Umurenge Programme (VUP), focusing on both urban and rural areas. This investment is crucial for reducing extreme poverty substantially to only 0.04% of the population by 2050.
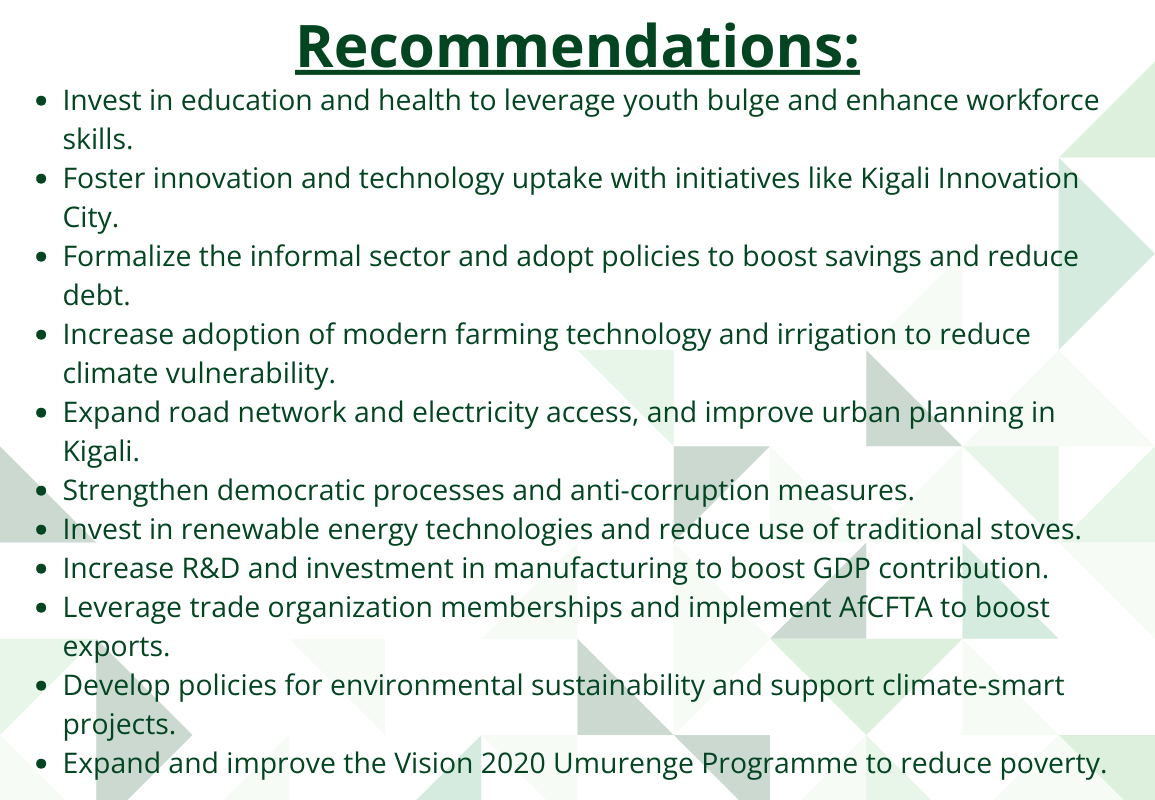
Endnotes
Fixed broadband includes cable modem Internet connections, DSL Internet connections of at least 256 KB/s, fibre and other fixed broadband technology connections (such as satellite broadband Internet, ethernet local area networks, fixed-wireless access, wireless local area networks, WiMAX, etc.).
In May 2022, the World Bank announced that it would be using US$2.15 in 2017 prices as the new international poverty line (to measure progress towards the Sustainable Development Goals) instead of US$1.90. Instead of the previous US$3.20 for low-middle-income countries, the adjusted poverty line is now $3.65, and $6.85 for upper-middle-income countries (instead of $5.50 in 2011 prices). The World Bank has not yet announced the new poverty line for high-income countries, previously set at $22.70 in 2011 prices. The World Bank intends to release the associated poverty estimates in 2023. In the meanwhile, this site continues to use the US$1.90, US$3.20, US$5.50 and US$22.70 poverty lines.
Page information
Contact at AFI team is Enoch Randy Aikins and Alize le Roux
This entry was last updated on 15 June 2026 using IFs v7.84.
Donors and sponsors


Reuse our work
- All visualizations, data, and text produced by African Futures are completely open access under the Creative Commons BY license. You have the permission to use, distribute, and reproduce these in any medium, provided the source and authors are credited.
- The data produced by third parties and made available by African Futures is subject to the license terms from the original third-party authors. We will always indicate the original source of the data in our documentation, so you should always check the license of any such third-party data before use and redistribution.
- All of our charts can be embedded in any site.
Cite this research
Enoch Randy Aikins and Alize le Roux (2026) Rwanda Development Futures. Published online at futures.issafrica.org. Retrieved from https://futures.issafrica.org/geographic/countries/rwanda/ [Online Resource] Updated 15 June 2026.