 Egypt
Egypt
Feedback welcome
Our aim is to use the best data to inform our analysis. See our Technical page for information on the IFs forecasting platform. We appreciate your help and references for improvements via our feedback form.
This page explores Egypt’s current and projected future development, examining various sectoral scenarios and their potential impacts on the country's growth. It provides an in-depth analysis of eight sectors including demographic, economic and infrastructure-related outcomes for Egypt up to 2043. The assessment also considers the implications of the Agenda 2063 goals, aiming to offer insights into policy actions that could enhance the country's developmental trajectory.
For more information about the International Futures modelling platform we use to develop the various scenarios, please see About this Site.
Executive Summary
We begin this page with an introduction and context to Egypt.
- Egypt is one of the 24 lower-middle-income countries in Africa. It is a transcontinental country spanning the northeast corner of Africa and the southwest corner of Asia. It is bordered by Israel, including the Gaza Strip after its occupation by Israel in 1967, Sudan and Libya, as well as the Mediterranean and the Red Sea. Egypt’s landscape is mostly desert with some oases, with averagely very little rainfall and a hot, sunny and dry climate, dominated by the Nile river and its extremely fertile delta. Its largest cities include Cairo, the capital, Alexandria and Giza, all popular tourist cities along the Nile.
The introductory section is followed by an analysis of the Current Path for Egypt which informs the country’s likely current development trajectory to 2043, mostly comparing Egypt with its income peers in Africa. It is based on current geopolitical trends and assumes that no major shocks would occur in a ‘business-as-usual’ future.
- Egypt is the most populous country in North Africa and the 3rd most populous country on the continent after Nigeria and Ethiopia. The total population increased from 57.2 million in 1990 to 113 million in 2023. By 2043, it will be 145.4 million.
- Egypt’s GDP measured in market exchange rates (MER) almost quadrupled from US$79.9 billion in 1990 to US$327.9 billion in 2023, making it the third-largest economy in Africa after Nigeria and South Africa. Its economy depends mainly on agriculture, telecommunication, petroleum exports, natural gas and tourism. By 2043, GDP will more than double to US$826 billion.
- Compared to most oil-rich Gulf countries, Egypt has a large informal sector but it is smaller than the average for Africa’s lower-middle-income countries. In 2023, the size of the informal sector was equivalent to 20.5% of GDP, representing US$67.2 billion. The average for lower-middle-income African countries is 29.2%. The size of the informal sector will slightly decline to 18.2% of GDP by 2043, equivalent to US$150.4 billion.
- Egypt has the highest GDP per capita among the 24 lower-middle-income countries in Africa. Using the purchasing power parity (PPP), it’s GDP per capita of US$12 070 in 2023 was almost twice the group average of US$6 127. By 2043, Egypt will still have the largest GDP per capita among its peers at US$17 190.
- In 2023, 18.8 million Egyptians, representing 16.7% of the population, lived below the poverty line of US$3.65, far below the average of 46.4% for lower-middle-income countries in Africa. By 2043, the poverty rate of 8.7% (equivalent to 12.6 million Egyptians) will be about 24 percentage points lower than the average for lower-middle-income countries in Africa.
- The Sustainable Development Strategy: Egypt Vision 2030 is the broad framework for attaining Egyptians' dreams and aspirations of an advanced and prosperous nation inspired by the ancient Egyptian civilization’s achievements. Its overall vision is: “By 2030, Egypt will be a country with a competitive, balanced, and diversified economy, depending on knowledge and creativity, and based on justice, social integration, and participation, with a balanced and varied ecosystem, a country that uses the genius of the place and the citizens in order to achieve sustainable development and improve the quality of the life for all.”
The next section compares progress on the Current Path with eight sectoral scenarios. These are Demographics and Health; Agriculture; Education; Manufacturing; the African Continental Free Trade Area (AfCFTA); Large Infrastructure and Leapfrogging; Financial Flows; and Governance. Each scenario is benchmarked to present an ambitious but reasonable aspiration in that sector.
- The Demographics and Health scenario will reduce the infant mortality rate from 11.6 deaths per 1 000 births in 2023 to 6.3 deaths by 2043, 1.4 deaths fewer than in the Current Path. The scenario pushes the ratio of the working-age population to dependants to 2.4-to-1 far above the ratio of 1.7-to-1 that is required to enter a potential demographic window of opportunity. In fact, Egypt achieves this minimum ratio as early as 2026.
- In 2023, Egypt’s net import of crops stood at 19% of total crop demand, which was more than the average of 13.4% for lower-middle-income countries in Africa. By 2043, net import of crops will reach 24.4% in the Agriculture scenario — six percentage points less than the Current Path and the average of its income-group peers in Africa.
- In 2023, the mean years of education attained by adults between 15 and 24 years in Egypt stood at 8.8 years — one year above the average of 7.8 years for lower-middle-income countries on the continent. In the Education scenario, the mean years of adult education in Egypt will increase to 9.5 by 2043, 0.5 years more than the Current Path and higher than the average for lower-middle-income countries in Africa. By 2043, the scenario further increases average test scores for primary and secondary school students by 46.1% and 51.8%, respectively.
- In the Manufacturing scenario, Egypt makes substantial progress in industrialisation such that, by 2043, the share of the manufacturing sector in GDP is about 27.8% equivalent to US$256.4 billion. This will be about 3.5 percentage points of GDP above the Current Path valued at US$56.4 billion.
- In the African Continental Free Trade Area (AfCFTA) scenario, Egypt’s trade deficit will constitute about 2.6% of GDP by 2043 instead of the 3.7% of GDP on the Current Path. Also, the sum of Egypt’s exports and imports as a percentage of GDP will reach 43.1% by 2043. This will be about 5.9 percentage points above the Current Path but 7.4 percentage points below the average of lower-middle-income African countries.
- Due to the universal electricity access rate in Egypt, all households in the country used modern stoves for cooking as of 2023. This trend will continue on the Current Path up to 2043. The Large Infrastructure and Leapfrogging scenario will lead to a larger increase in fixed broadband access, so that, by 2043, subscriptions will likely be at 50 per 100 people compared to 33.8 subscriptions on the Current Path.
- In 2023, the government’s total revenue amounted to US$64.6 billion, equivalent to 19.7% of GDP — higher than the average of its income-group peers in Africa. Government revenue will increase to US$210.0 billion in 2043, representing 24% of GDP above the average of 21.6% for lower-middle-income countries in the Financial Flows scenario. Compared to the Current Path, the Financial Flows scenario will improve government revenue in Egypt by an additional US$11.3 billion by 2043.
- In comparing governance across three dimensions, Egypt has significantly more security and capacity than lower-middle-income countries but much less inclusion. As a result Egypt’s score on the composite governance index of 0.48 in 2023 was 5.6% lower than the average for its income peers in Africa. In the Governance scenario, Egypt's score on the composite governance index will improve to 0.60, which is about 12% above the Current Path by 2043 and about 7.4% above the Current Path average of lower-middle-income Africa in the same year. The improvement is largely due to improvements in its score on democracy and gender inclusion which form part of the inclusion index.
In the third section, we compare the impact of each of these eight sectoral scenarios with one another and subsequently with a Combined scenario (the integrated effect of all eight scenarios). In our forecasts, we measure progress on various dimensions such as economic size (in market exchange rates), gross domestic product per capita (in purchasing power parity), extreme poverty, carbon emissions, the changes in the structure of the economy, and selected sectoral dimensions such as progress with mean years of education, life expectancy, the Gini coefficient or reductions in mortality rates.
- The scenario with the greatest impact on GDP per capita in Egypt by 2043 is the Manufacturing scenario, followed by the Governance and the AfCFTA scenarios. In the Manufacturing scenario, Egypt’s GDP per capita will witness an increase of US$1 390 or 8.1% more than the Current Path. The Governance and AfCFTA scenarios further raise GDP per capita for Egypt by an additional US$1 250 and US$780 by 2043.
- The Manufacturing scenario also has the largest potential to reduce extreme poverty, followed by the Governance and Education scenarios. The Manufacturing scenario has the potential to reduce extreme poverty in Egypt by an additional 4.8 million people. Similarly, the Education and Governance scenarios can lift about 2.3 and 1.8 million people out of extreme poverty respectively.
- In the Combined scenario, Egypt’s GDP will rise to US$1.3 trillion. This will exceed the Current Path of US$825.7 billion. Similarly, in the Combined scenario, GDP per capita for Egypt will increase to US$23 760 by 2043. This will be US$6 570 more than the projection of US$17 190 on the Current Path.
- By 2043, the service sector will still be the largest contributor to GDP at 53.6%. The manufacturing sector will be the second largest contributor to GDP in the scenario by 2043 with a share of 27.5%. The share of the agriculture sector will decline to 4.9% while the share of ICT will rise 8.3%.
- In the Combined scenario, both the number and portion of poor people will significantly decline. By 2043, only about 2% of Egyptians equivalent to 2.9 million people will be living in extreme poverty, meaning 9.7 million more people could be lifted out of poverty.
- In 2023, Egypt released about 82 million tons of carbon from fossil fuel use. In the Combined scenario, Egypt’s total carbon emissions will rise to 154 million tons — 23.2% higher than what is estimated in the Current Path in the same year.
- The Combined scenario shows an increase in energy demand, creating a larger energy deficit, with renewable energy becoming the dominant energy source, surpassing oil and gas. By 2043, the excess demand for energy in the scenario of 219 million BOE will be more than 6 times than the Current Path. In the Combined Scenario, gas production will still constitute 79.4% of total production followed by other renewable energy (11.8%) and oil (8.2%) of total production
We end this page with a summarising conclusion offering key recommendations for decision-making.
Egypt has made significant progress in advancing human development and its economic growth prospect is higher than its African income peers. However, it will still lag behind its Vision 2030 targets if it does not accelerate its development potential and harness its manifold economic opportunities. Therefore, a comprehensive and targeted set of socio-economic policy interventions across demographics, health, education, agriculture, infrastructure, manufacturing, trade, financial flows and governance is necessary to redirect the country’s current development trajectory towards a more sustainable and inclusive path.
All charts for Egypt Development Futures
-
Chart 1: Political map of Egypt
Chart 1: Political map of Egypt
- Chart 2: Population structure in the Current Path, 1990–2043
- Chart 3: Population distribution map, 2023
- Chart 4: Urban and rural population in the Current Path, 1990-2043
- Chart 5: GDP (MER) and growth rate in the Current Path, 1990–2043
- Chart 6: Size of the informal economy in the Current Path, 2019-2043
- Chart 7: GDP per capita in Current Path, 1990–2043
- Chart 8: Extreme poverty in the Current Path, 2019–2043
- Chart 9: National Development Plan of Egypt
- Chart 10: Relationship between Current Path and scenarios
- Chart 11: Mortality distribution in the Current Path, 2019-2043
- Chart 12: Infant mortality rate in Current Path and Demographics and Health scenario, 2019–2043
- Chart 13: Demographic dividend in the Current Path and the Demographics and Health scenario, 2019–2043
- Chart 14: Crop production and demand in the Current Path, 1990-2043
- Chart 15: Import dependence in the Current Path and Agriculture scenario, 2019–2043
- Chart 16: Progress through education funnel in the Current Path, 2019-2043
- Chart 17: Mean years of education in the Current Path and Education scenario, 2019–2043
- Chart 18: Value-add by sector as % of GDP in the Current Path, 2019-2043
- Chart 19: Value-add by the manufacturing sector in the Current Path and Manufacturing scenario, 2019–2043
- Chart 20: Exports and imports as % of GDP in the Current Path, 2000-2043
- Chart 21: Trade balance in the Current Path and AfCFTA scenario, 2019–2043
- Chart 22: Electricity access: urban, rural and total in the Current Path, 2000-2043
- Chart 23: Cookstove usage in the Current Path and Large Infra/Leapfrogging scenario, 2019–2043
- Chart 24: Access to mobile and fixed broadband in the Current Path and the Large Infra/Leapfrogging scenario, 2019–2043
- Chart 25: FDI, foreign aid and remittances as % of GDP in the Current Path, 1990-2043
- Chart 26: Government revenue in the Current Path and Financial Flows scenario, 2019–2043
- Chart 27: Government effectiveness score in the Current Path, 2002-2043
- Chart 28: Composite governance index in the Current Path and Governance scenario, 2019–2043
- Chart 29: GDP per capita in the Current Path and scenarios, 2019–2043
- Chart 30: Poverty in the Current Path and scenarios, 2019–2043
- Chart 31: GDP (MER) in the Current Path and Combined scenario, 2019–2043
- Chart 32: Value added by sector in the Current Path and Combined scenario, 2019–2043
- Chart 33: Informal sector in the Current Path and Combined scenario, 2019–2043
- Chart 34: Life expectancy in the Current Path and Combined scenario, 2019–2043
- Chart 35: Domestic Gini in the Current Path and Combined scenario, 2019–2043
- Chart 36: Carbon emissions in the Current Path and Combined scenario, 2019–2043
- Chart 37: Energy demand and production by type in the Current Path and Combined scenario, 2019-2043
- Chart 38: Policy recommendations
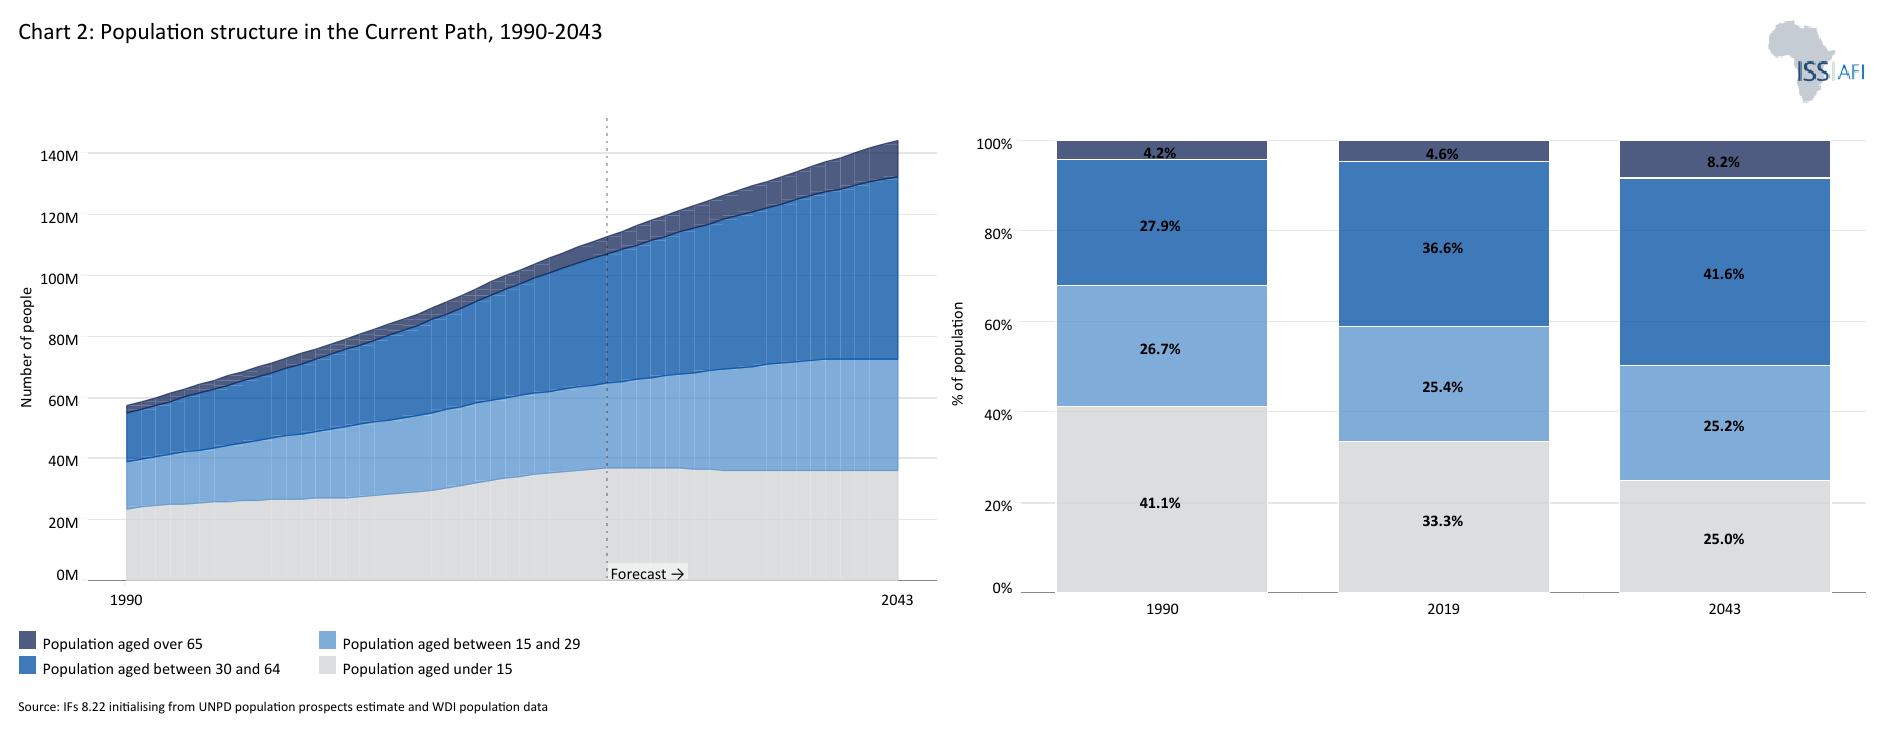
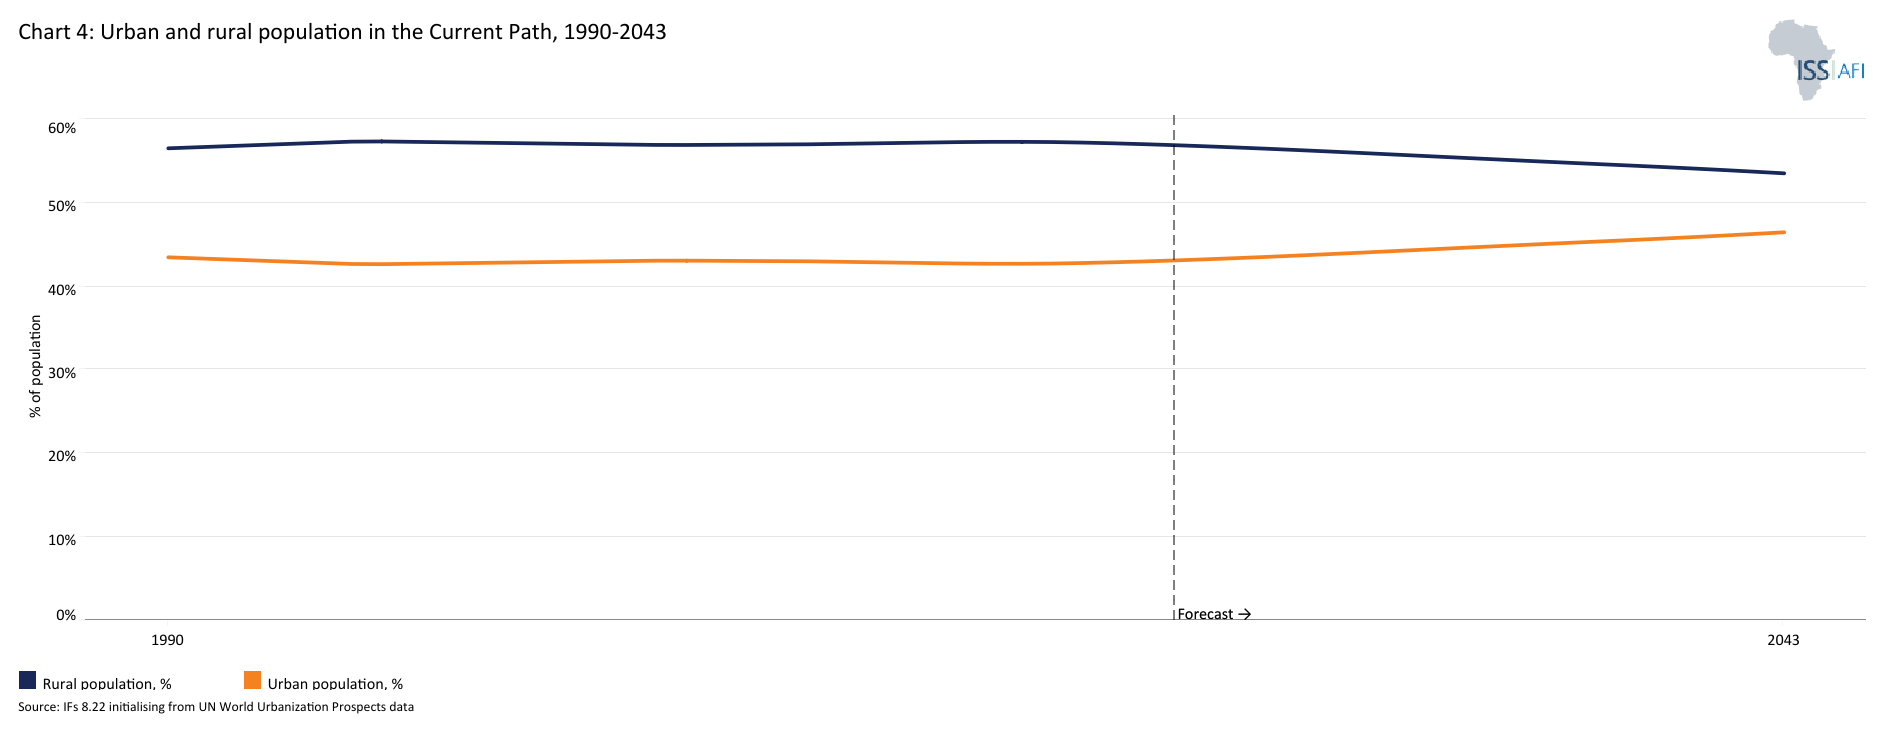
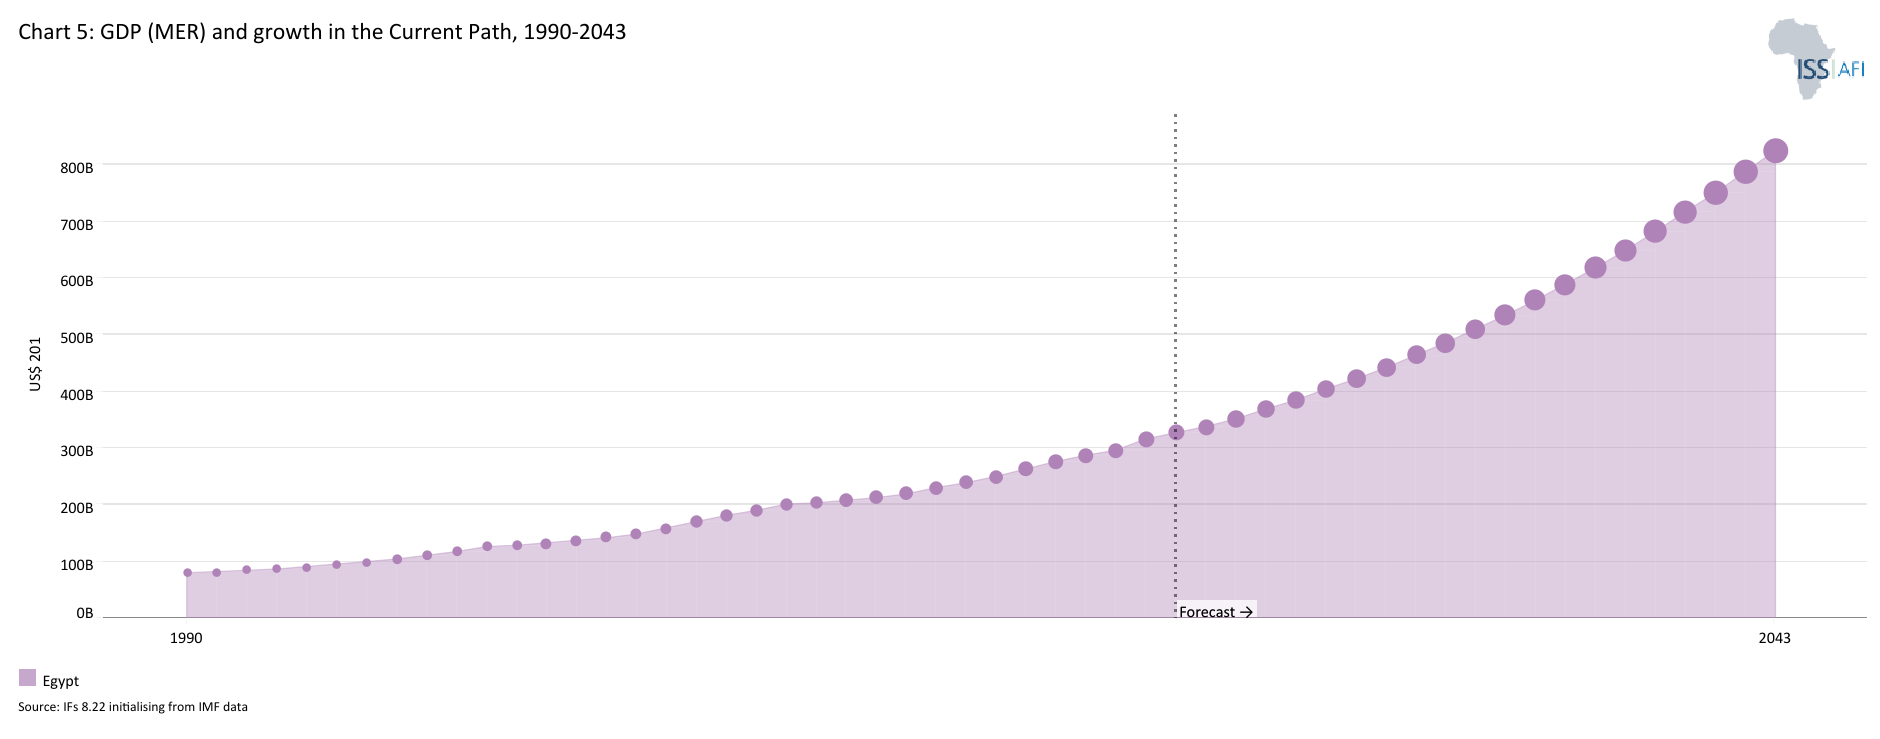
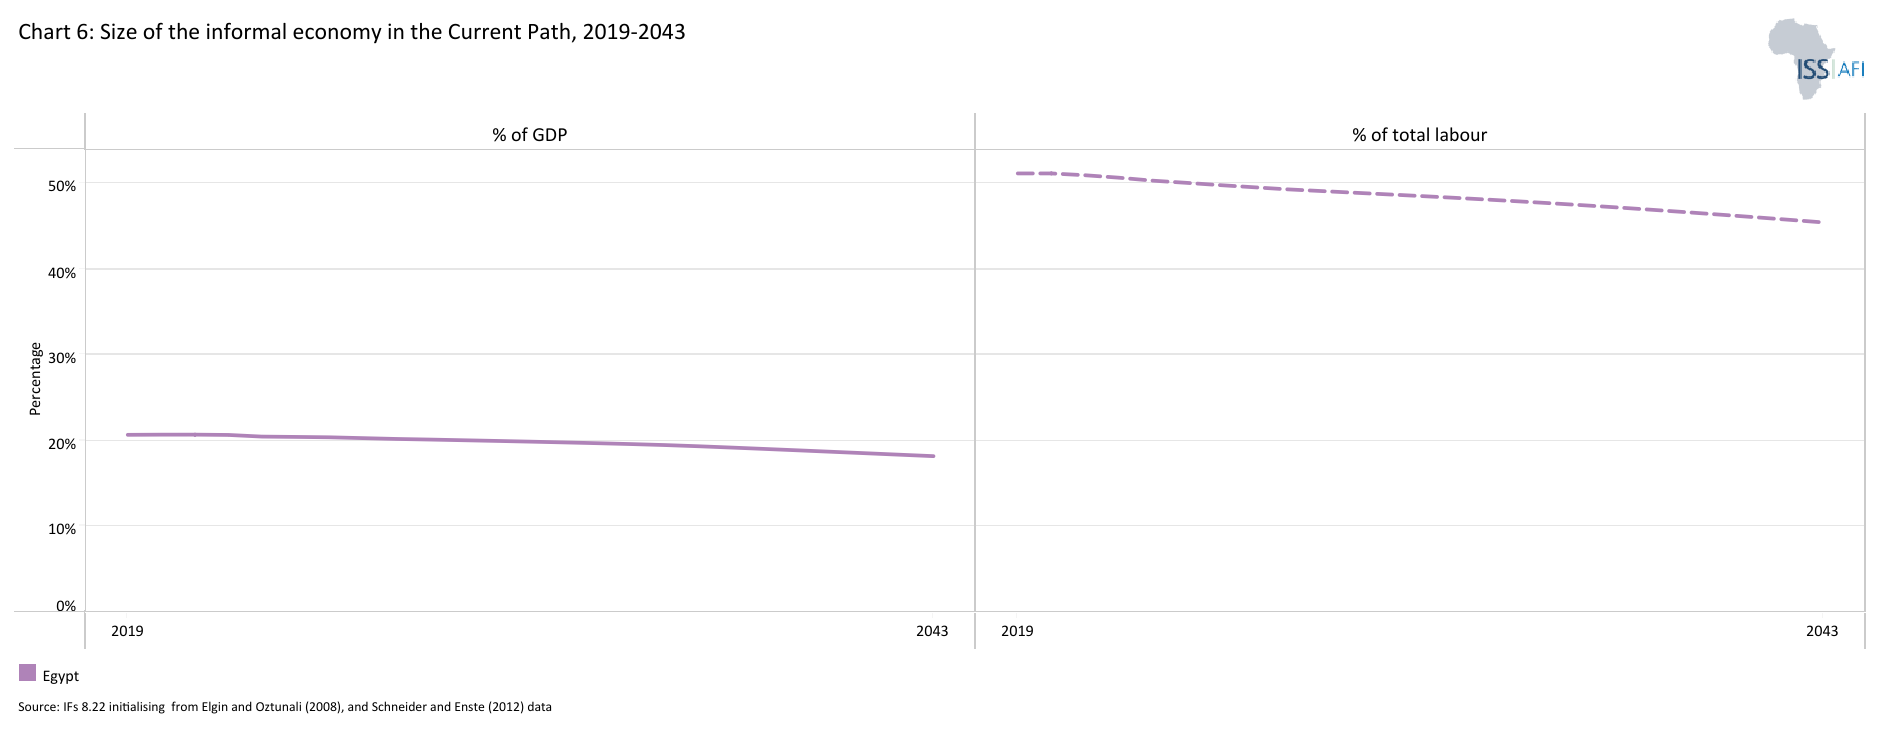
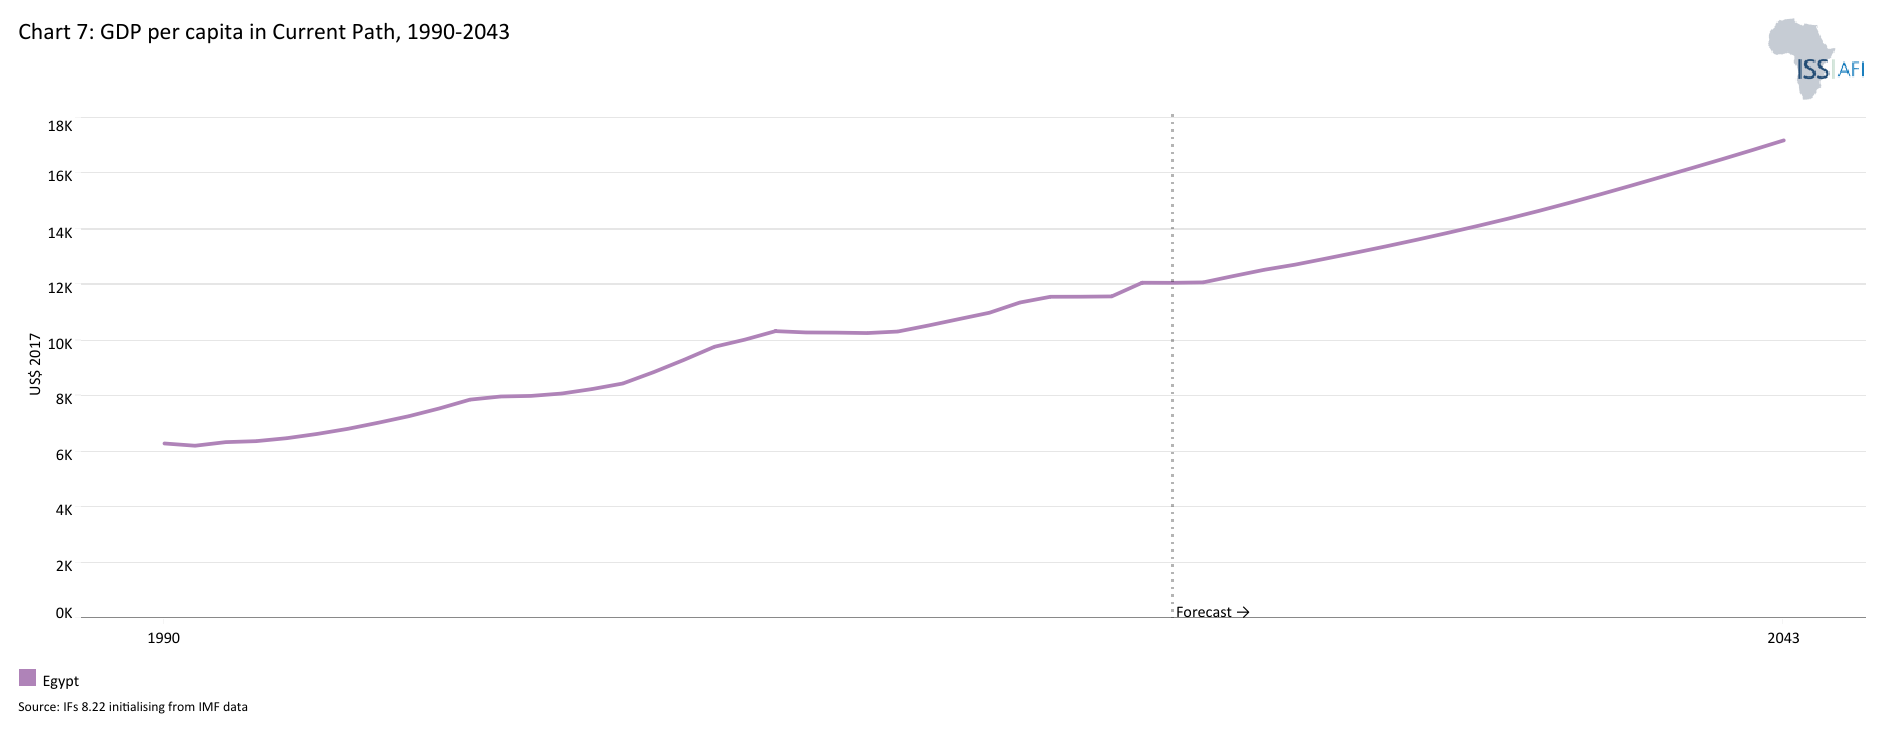
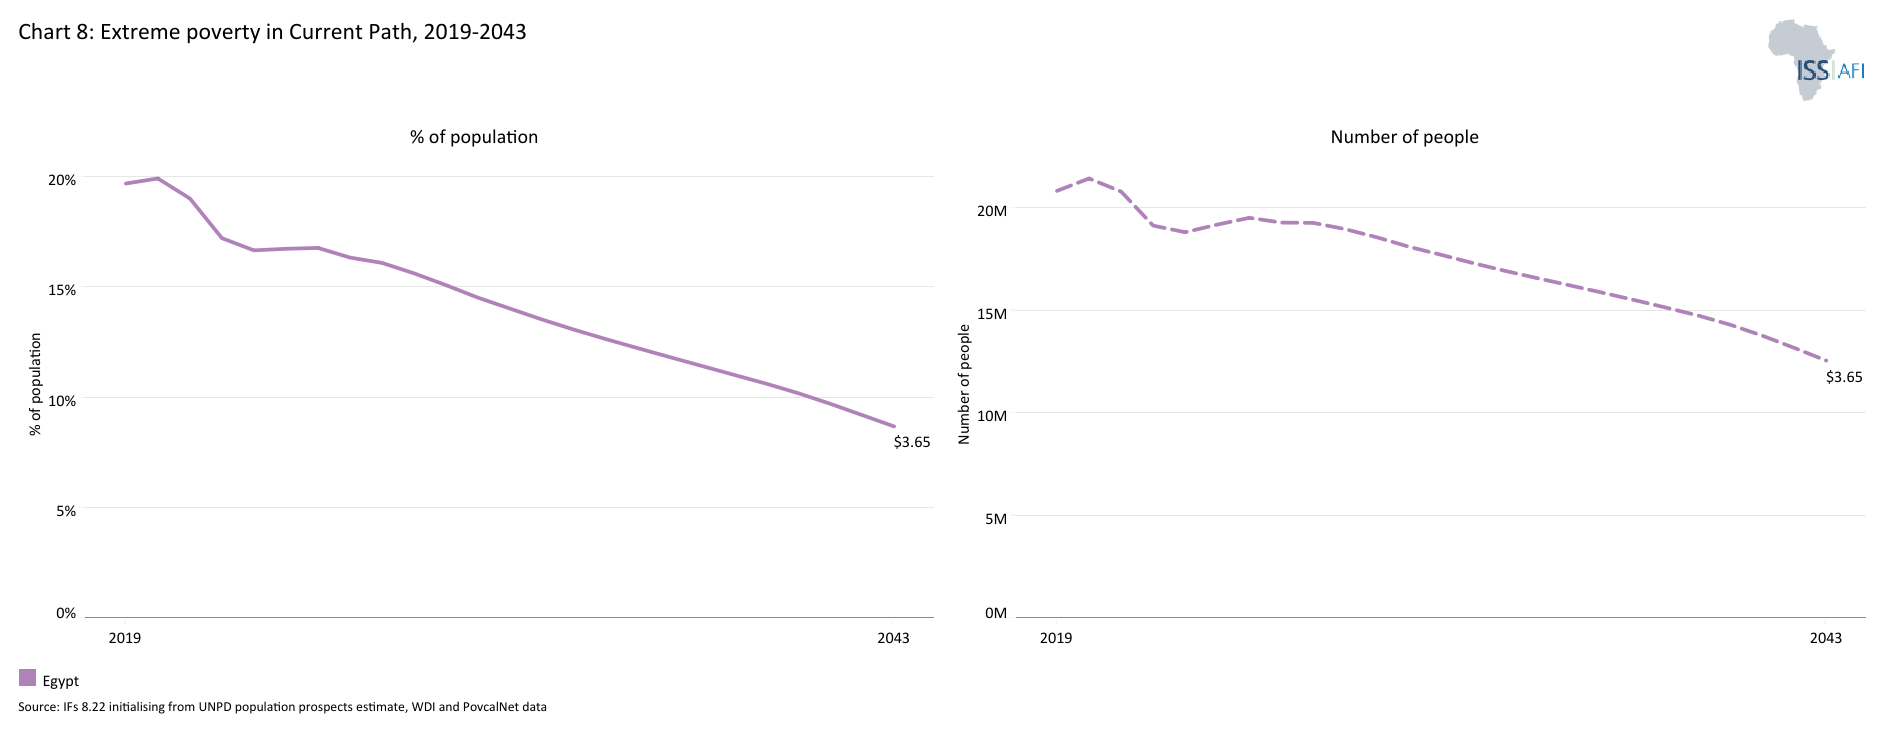
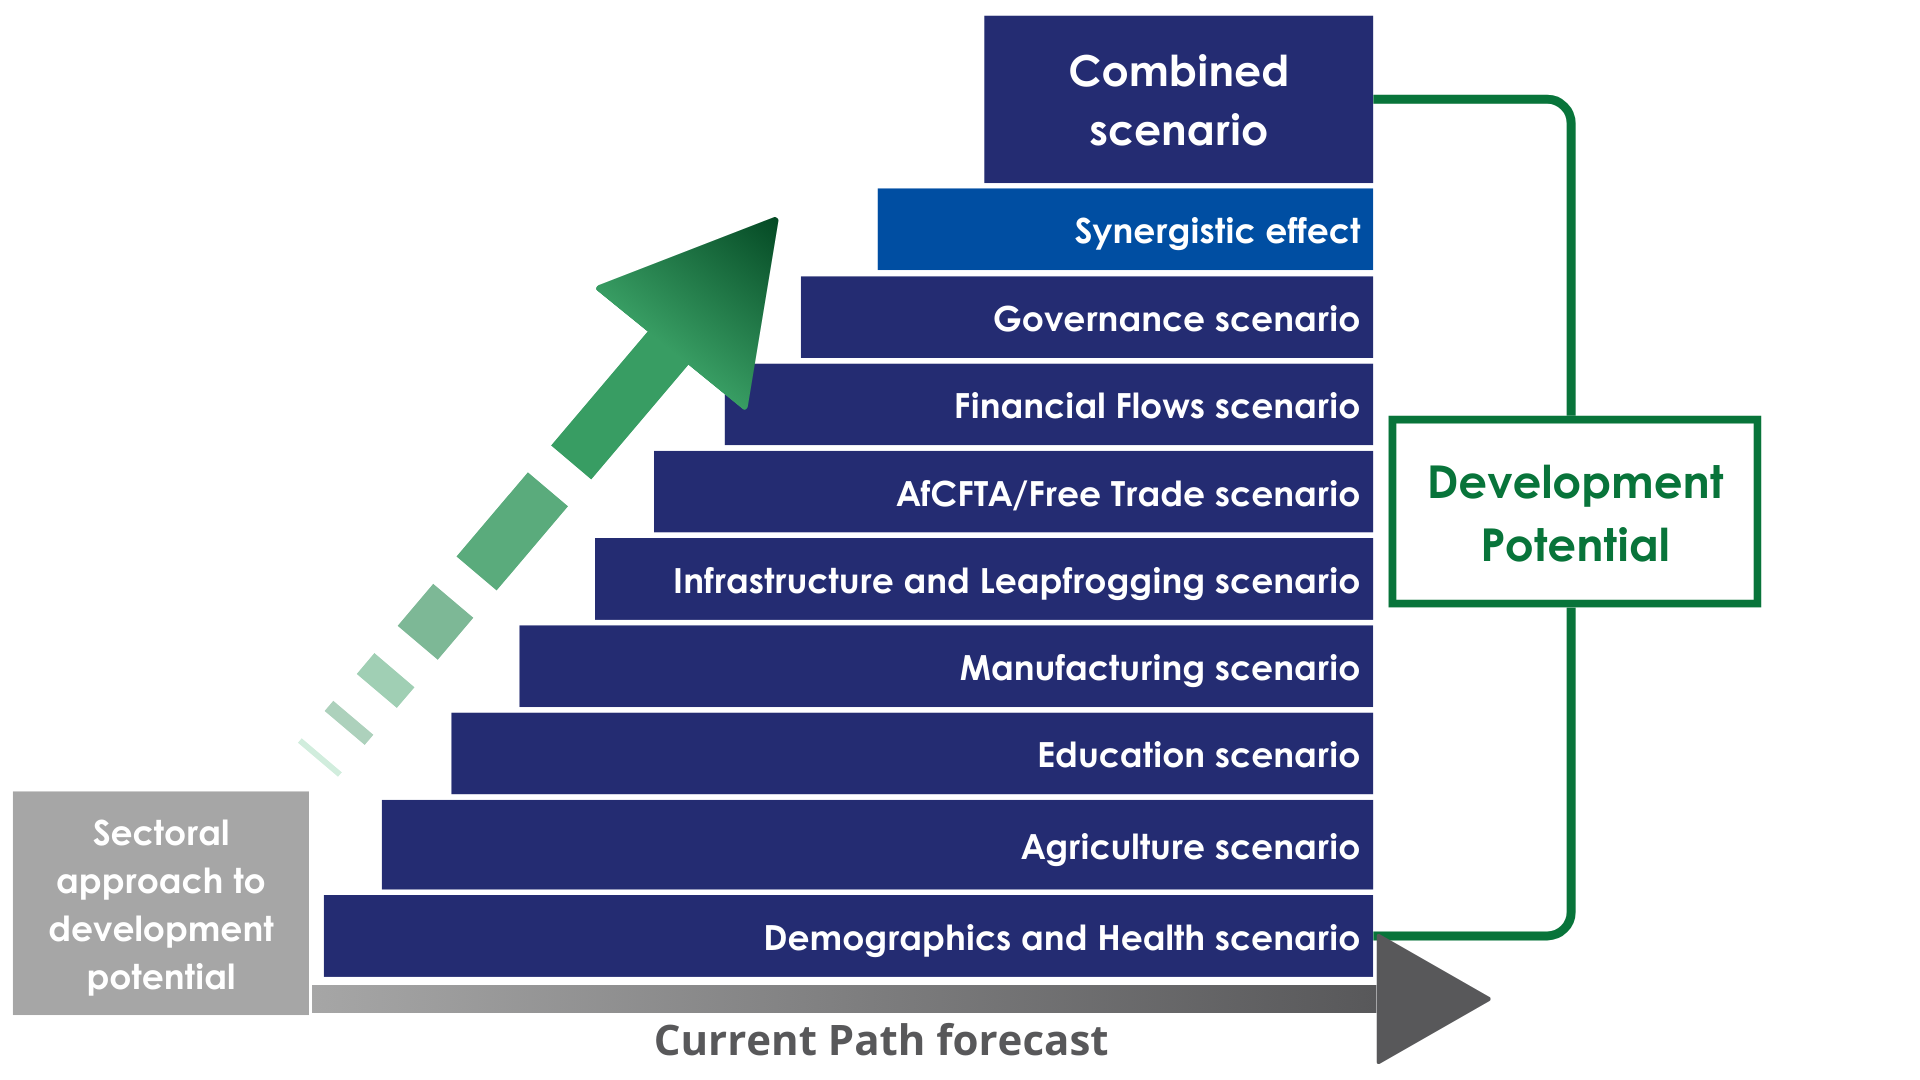
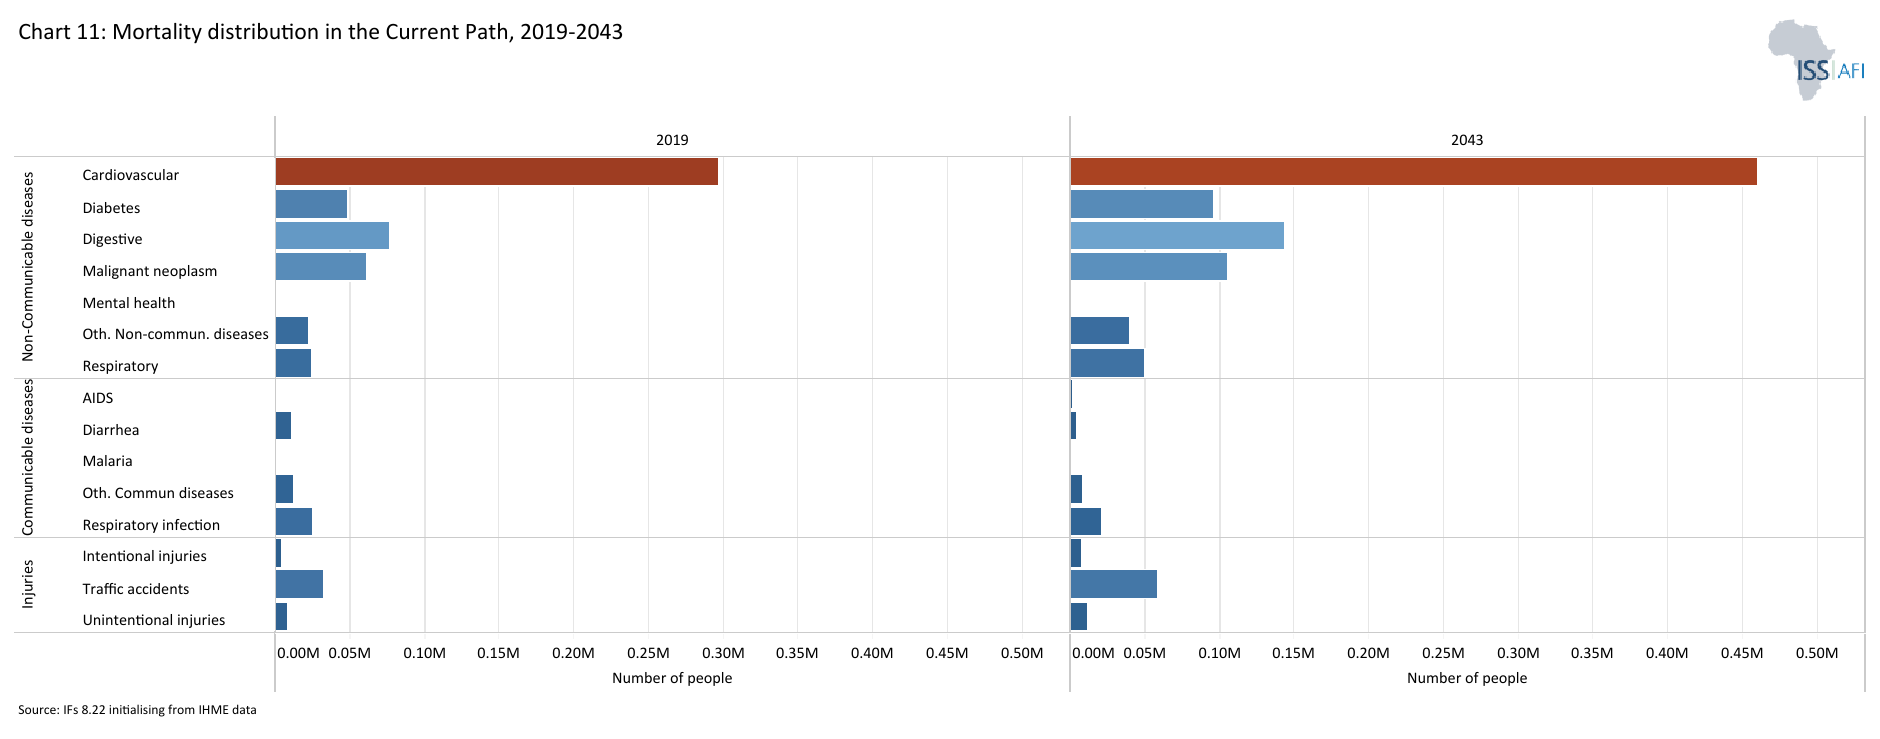
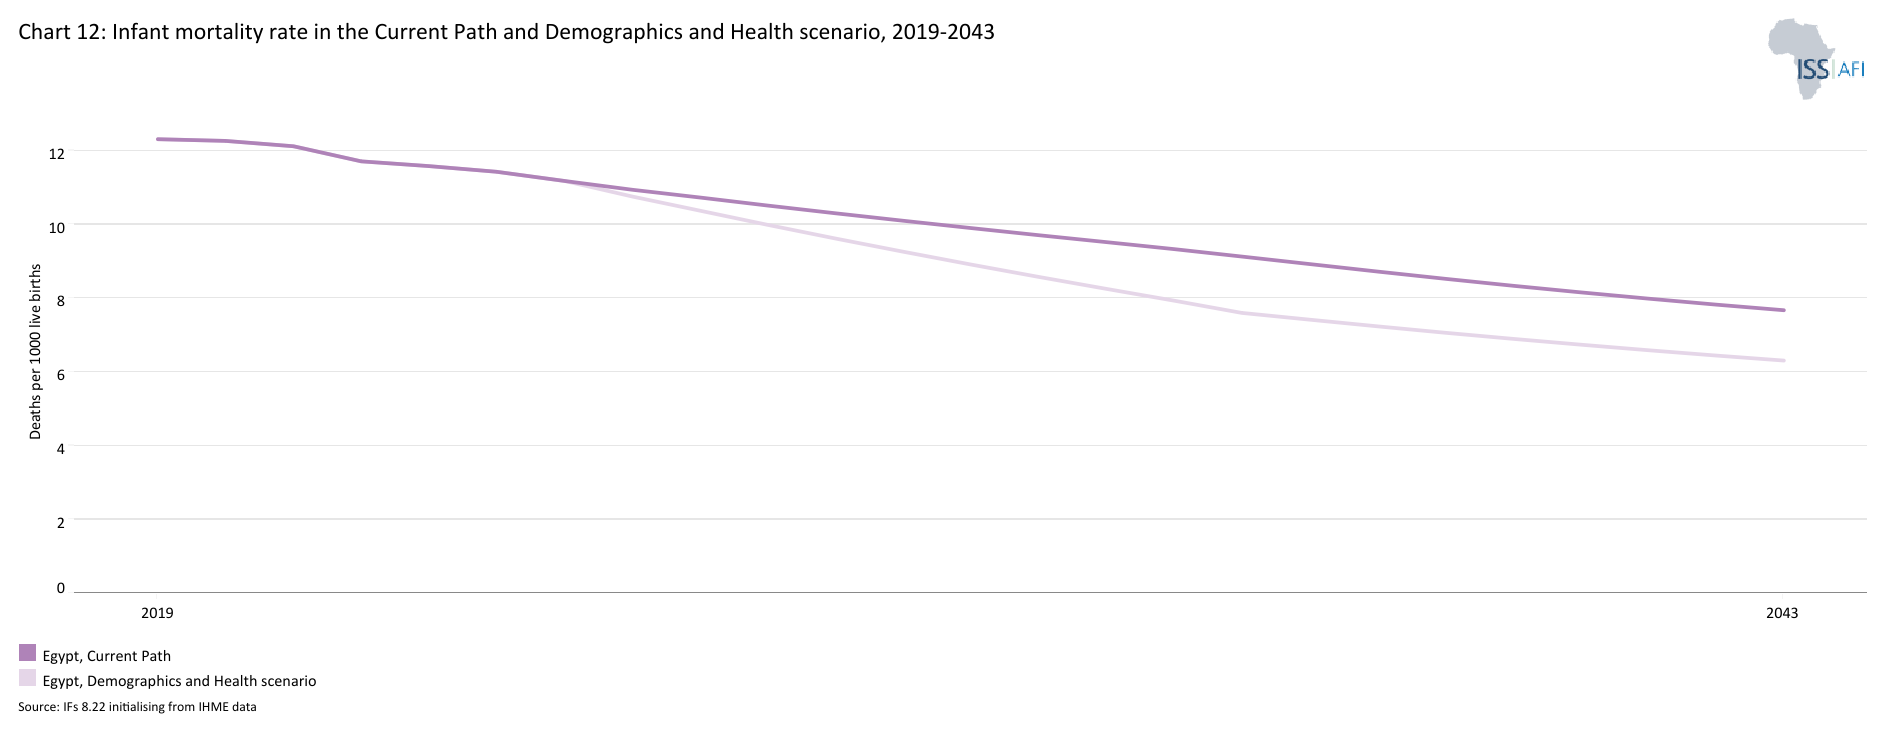
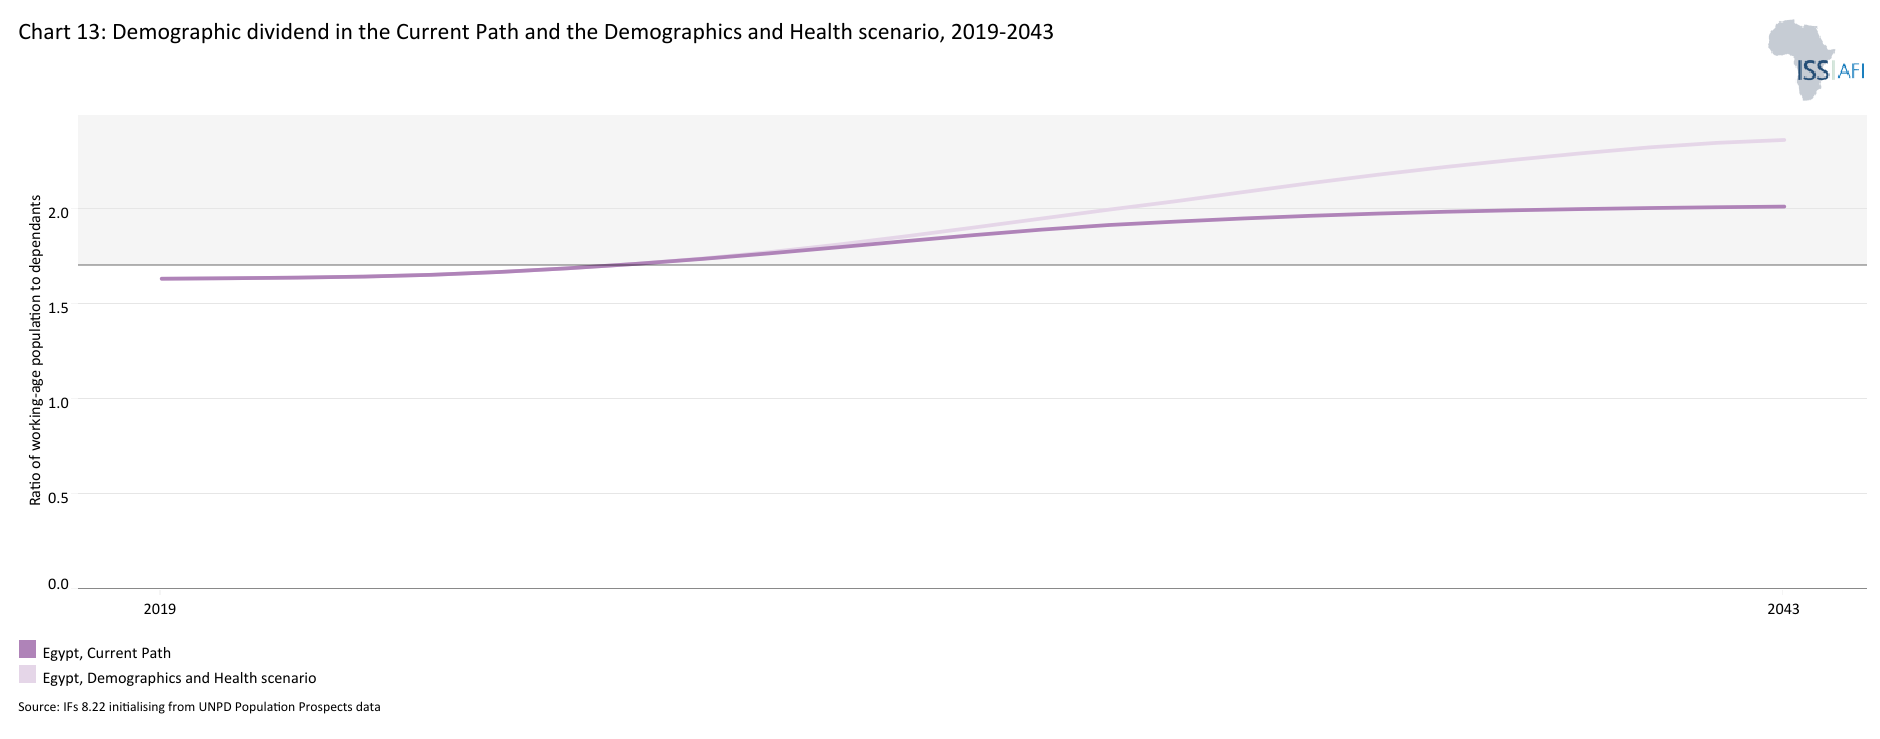
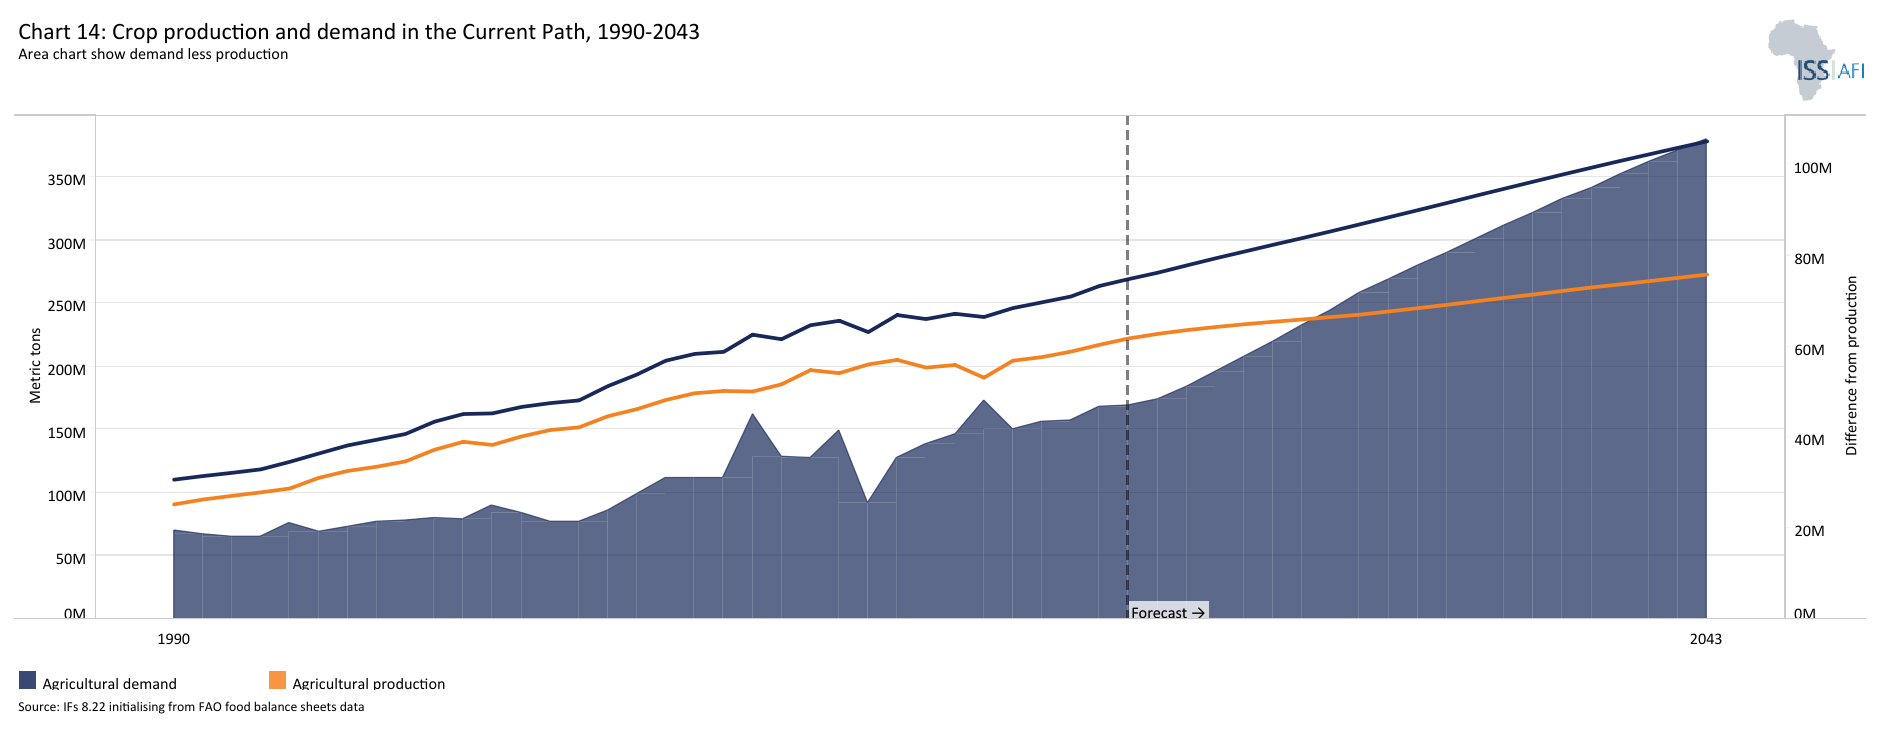
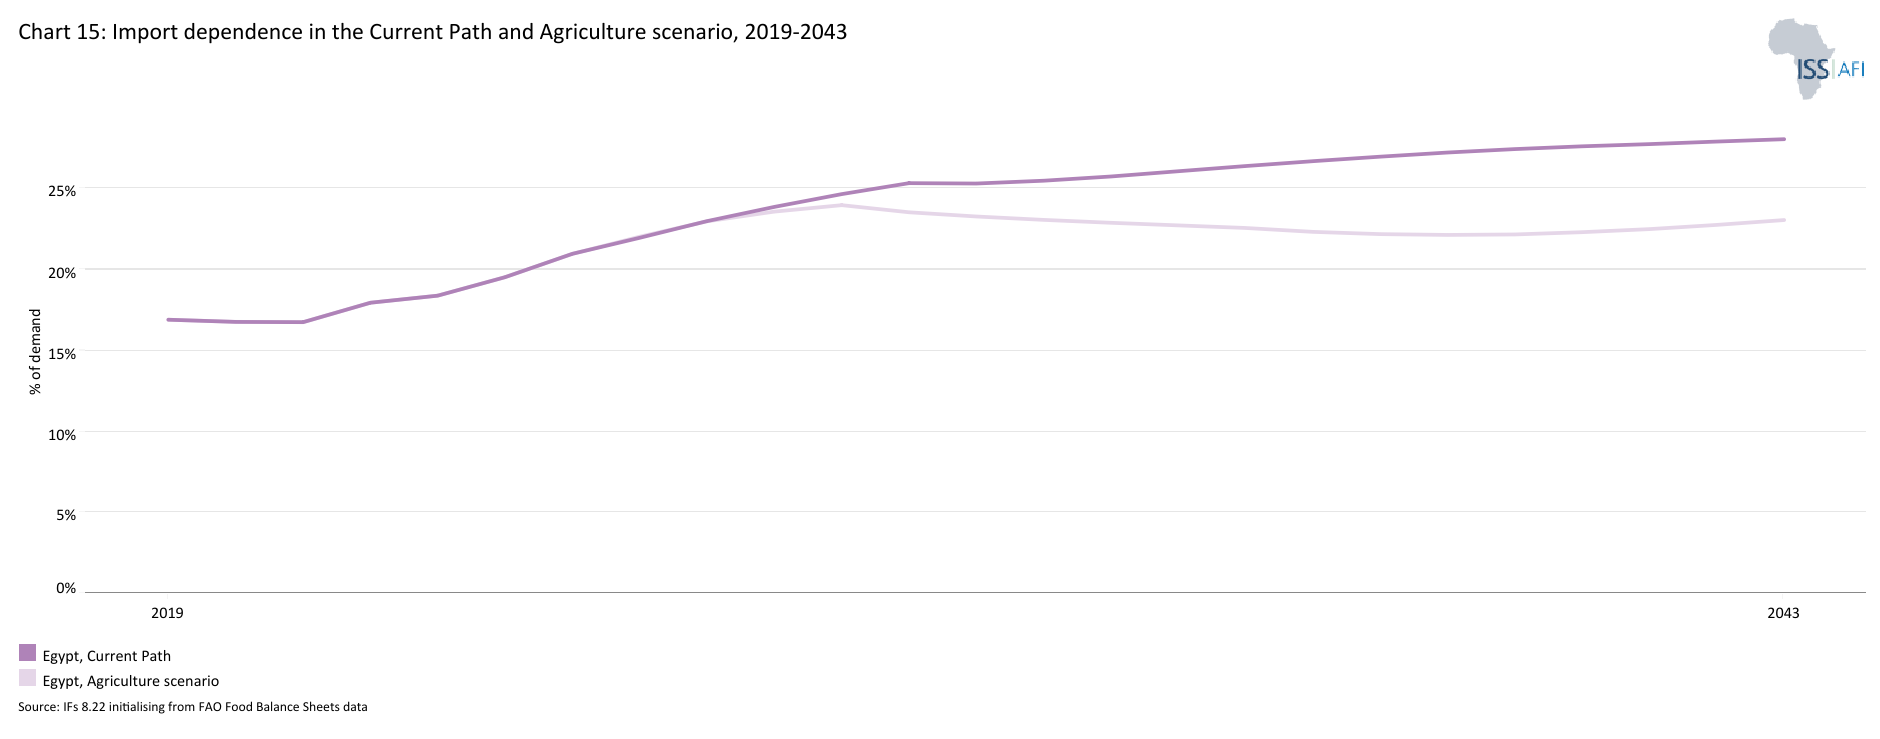
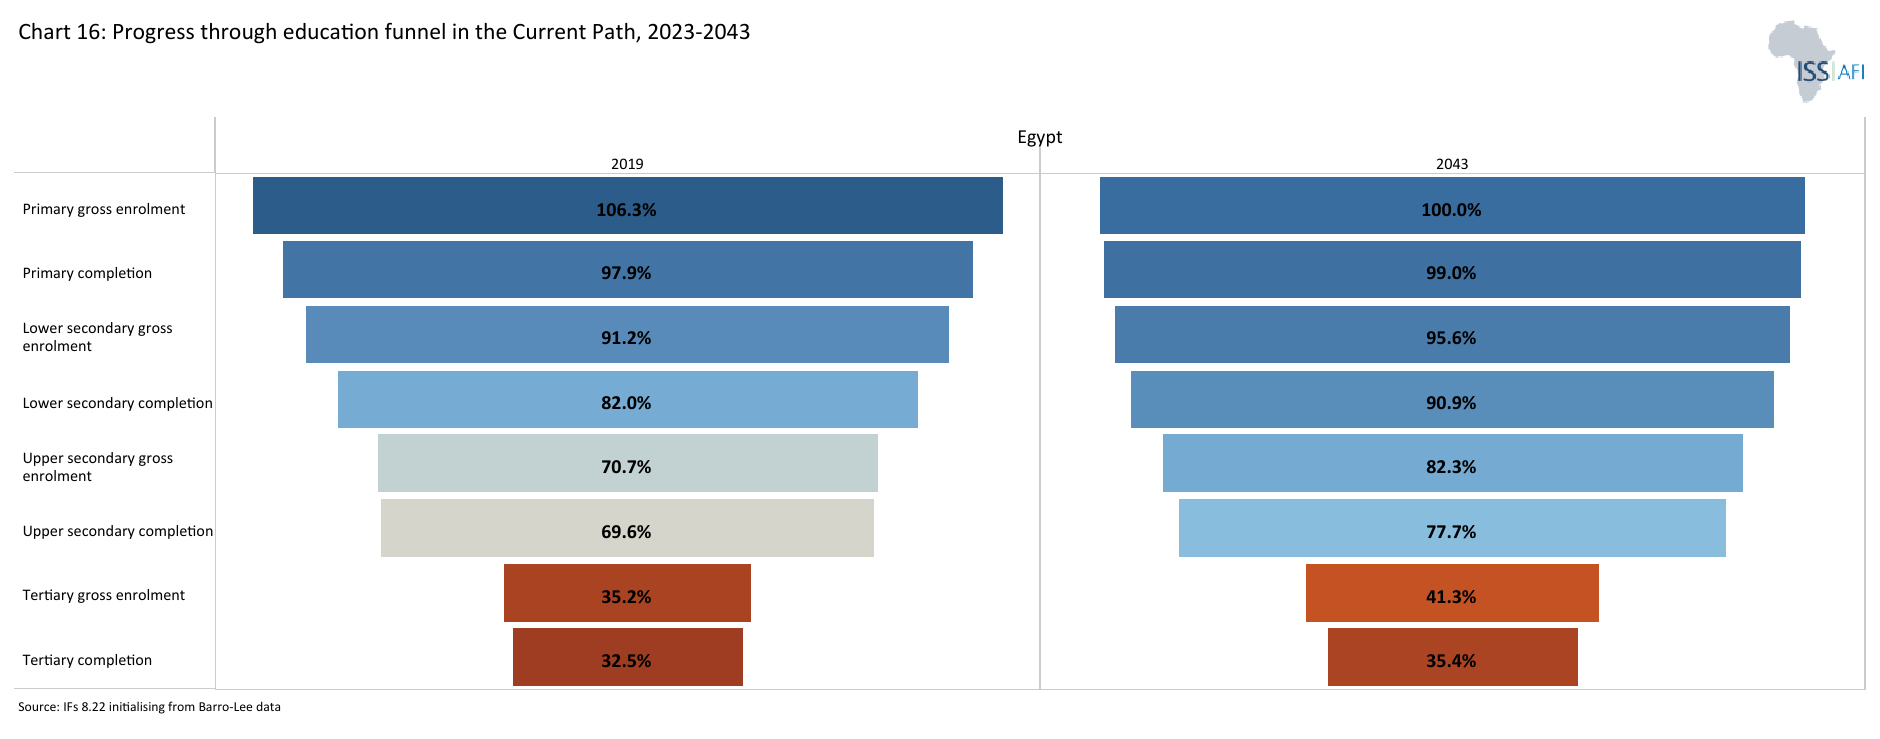
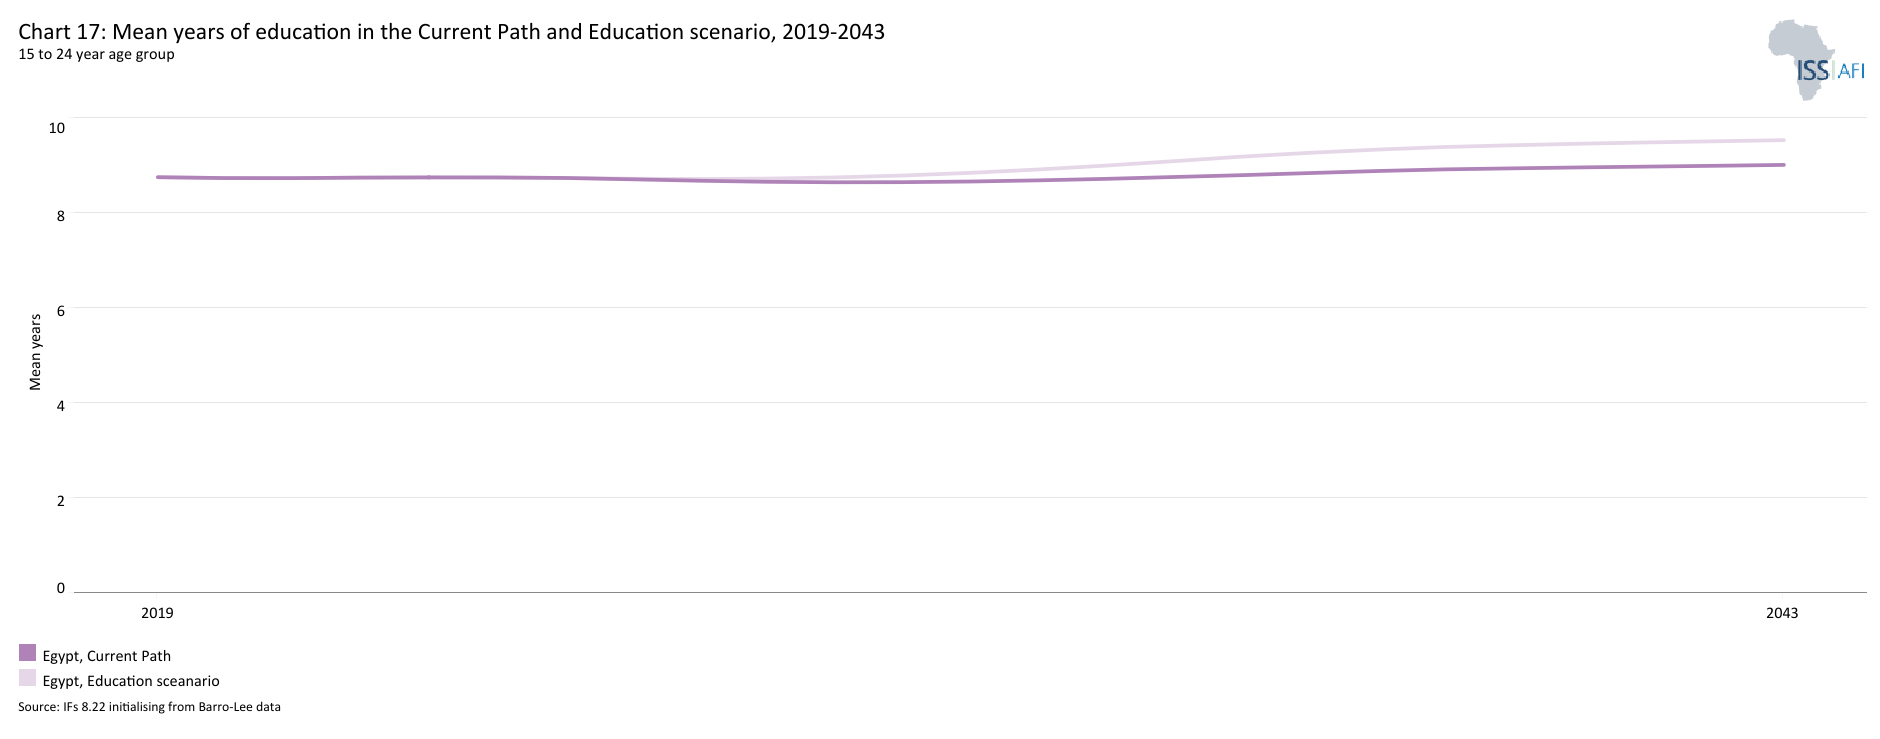
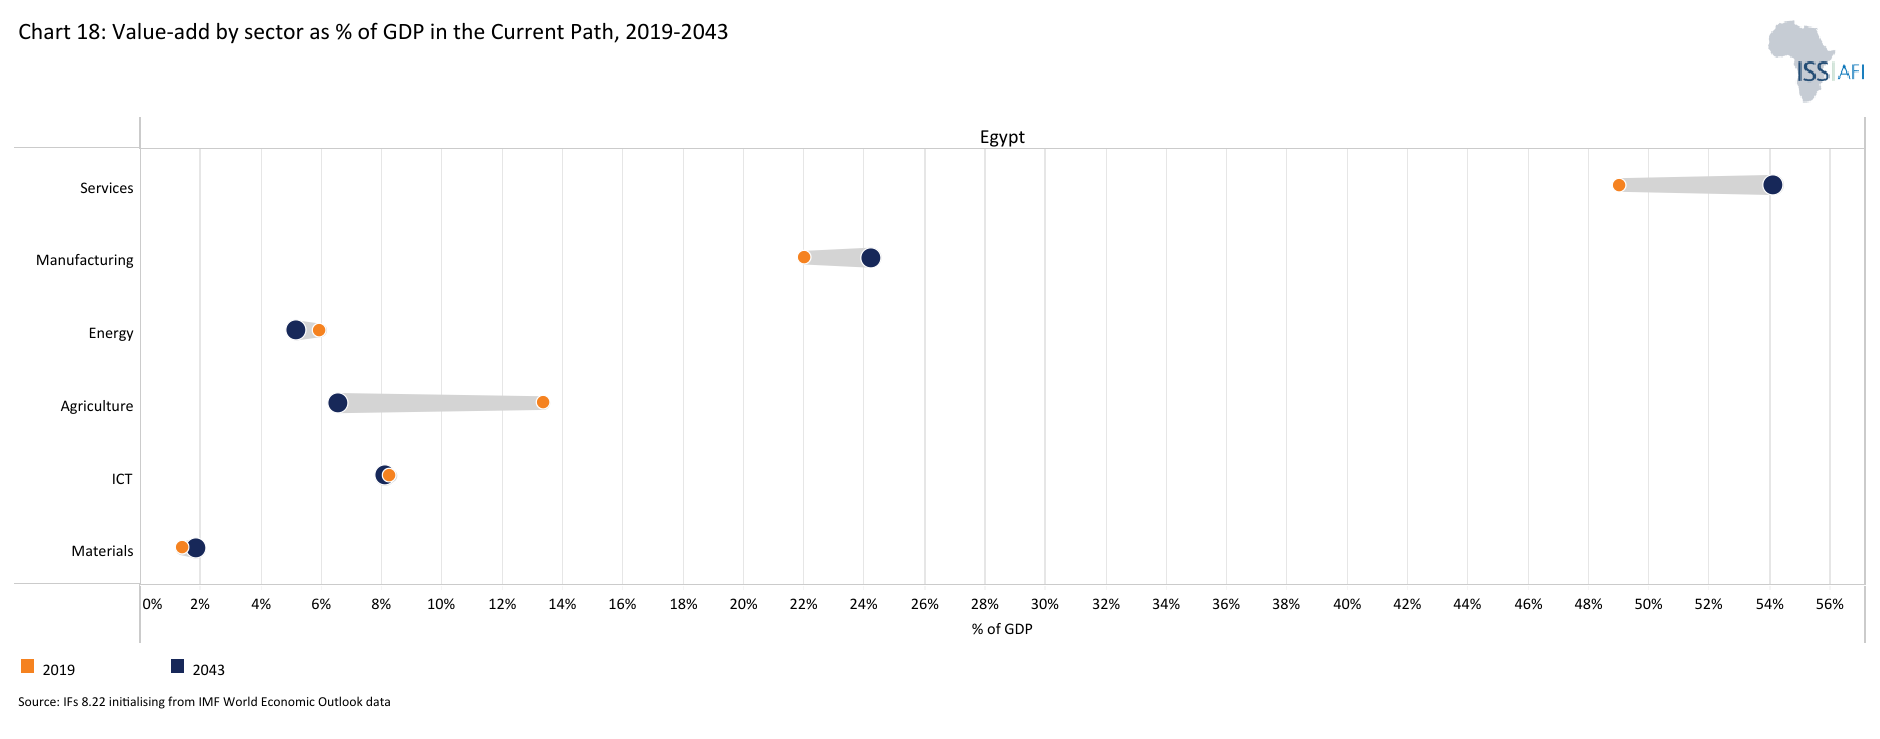
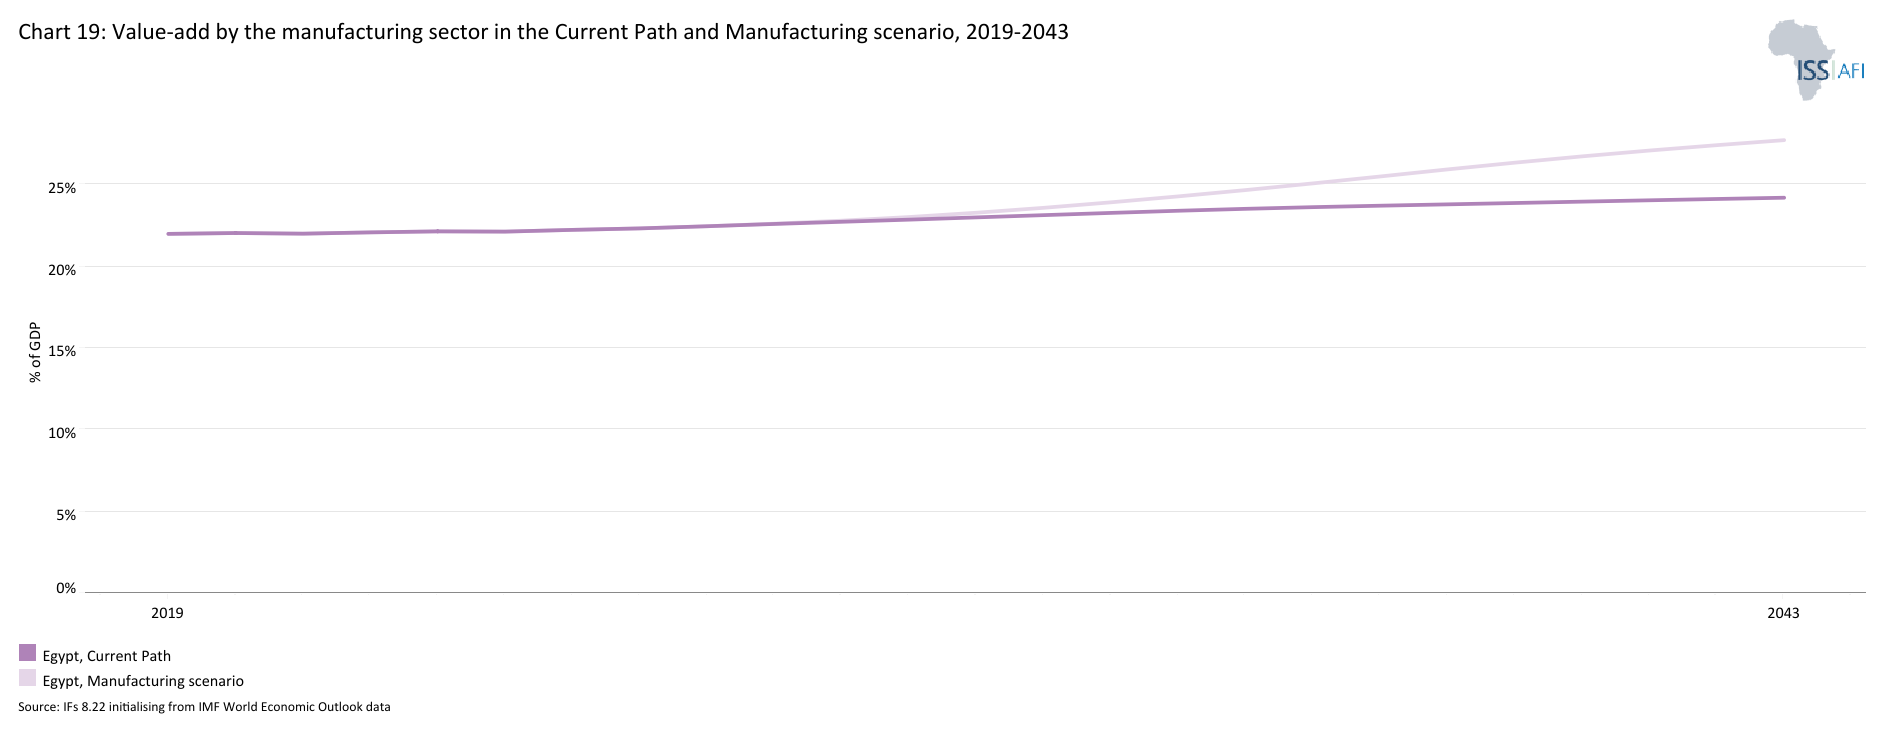
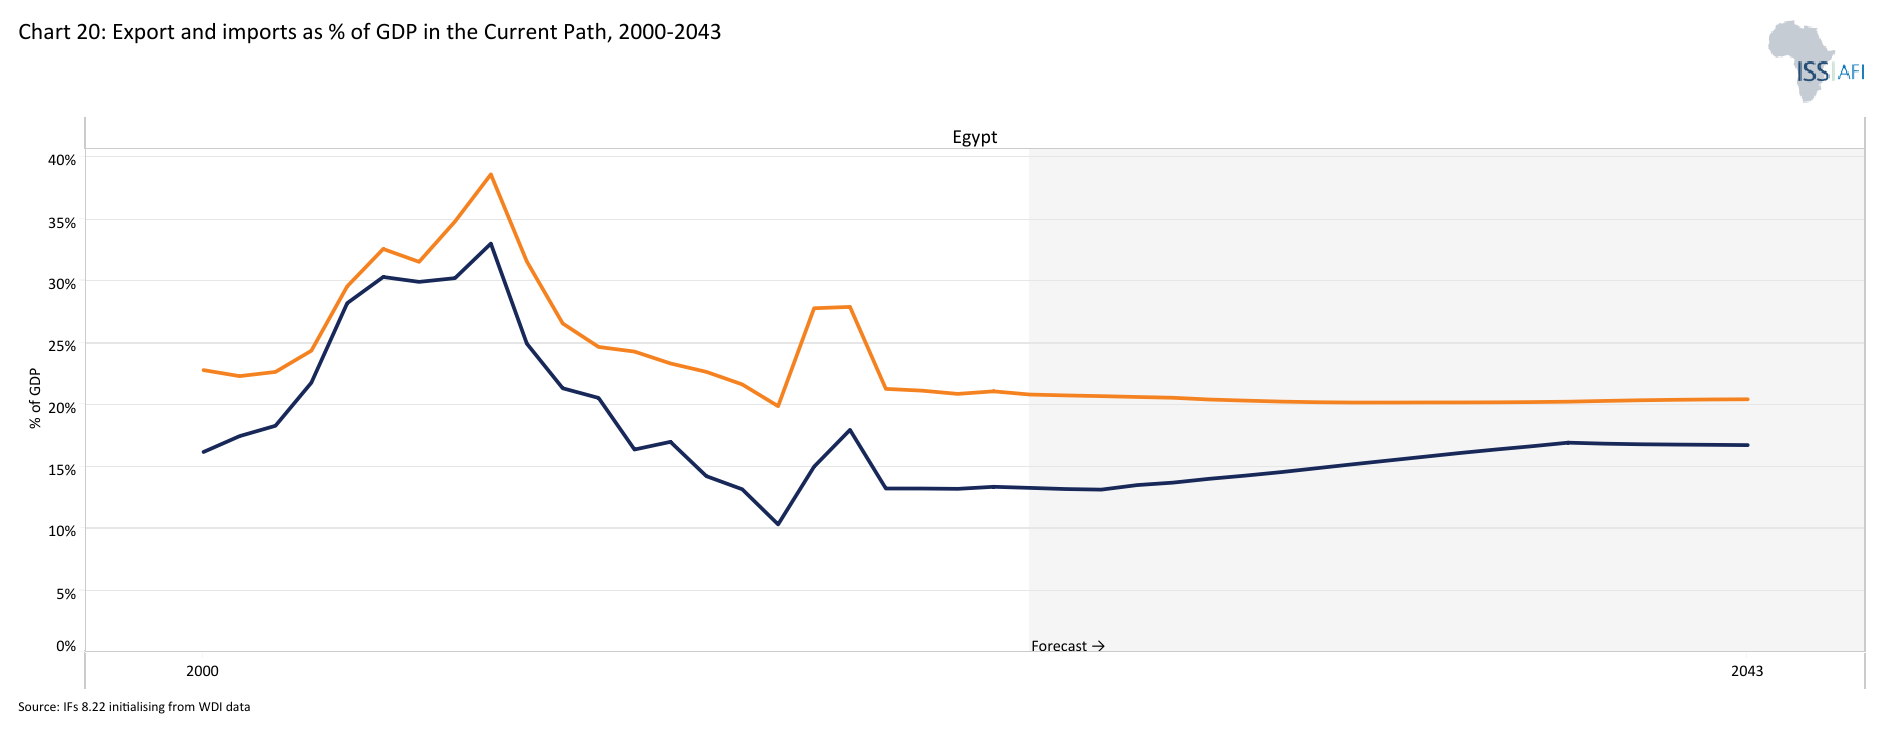
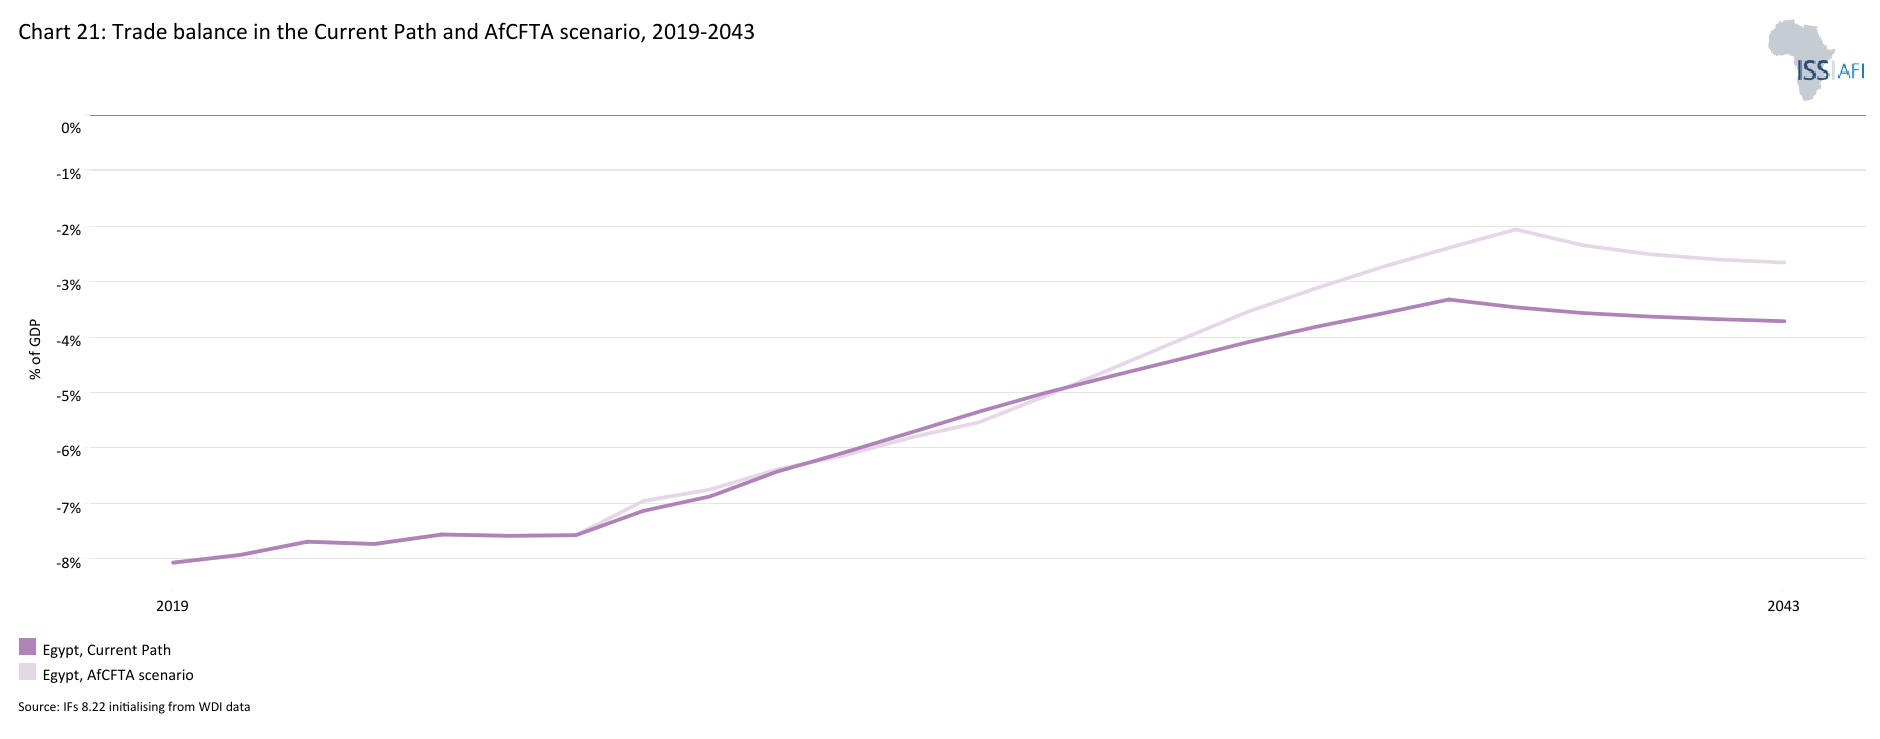
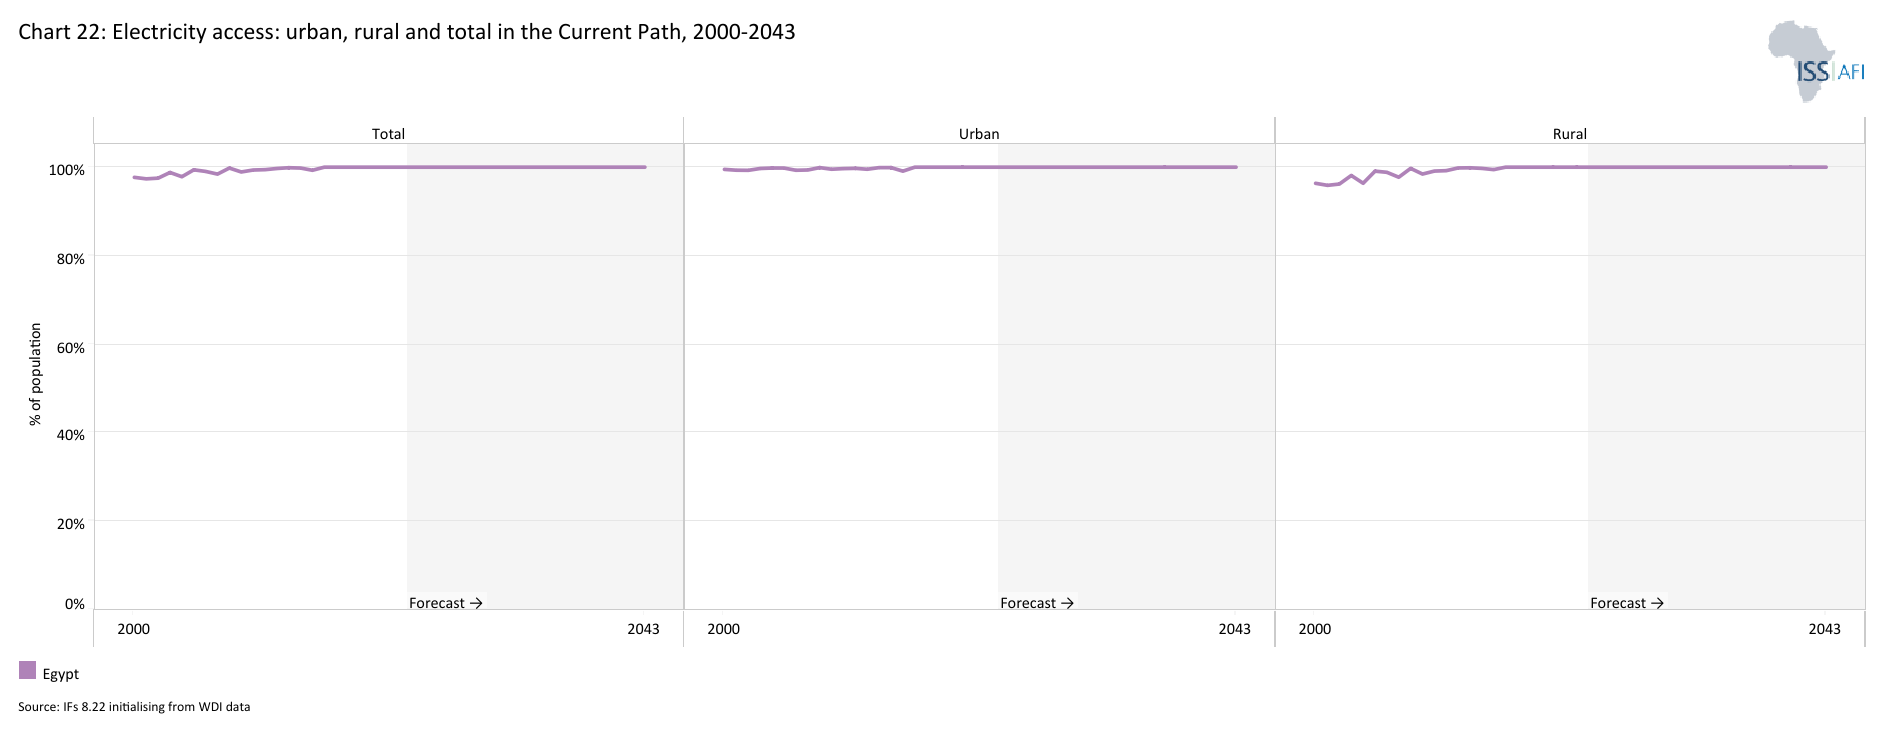
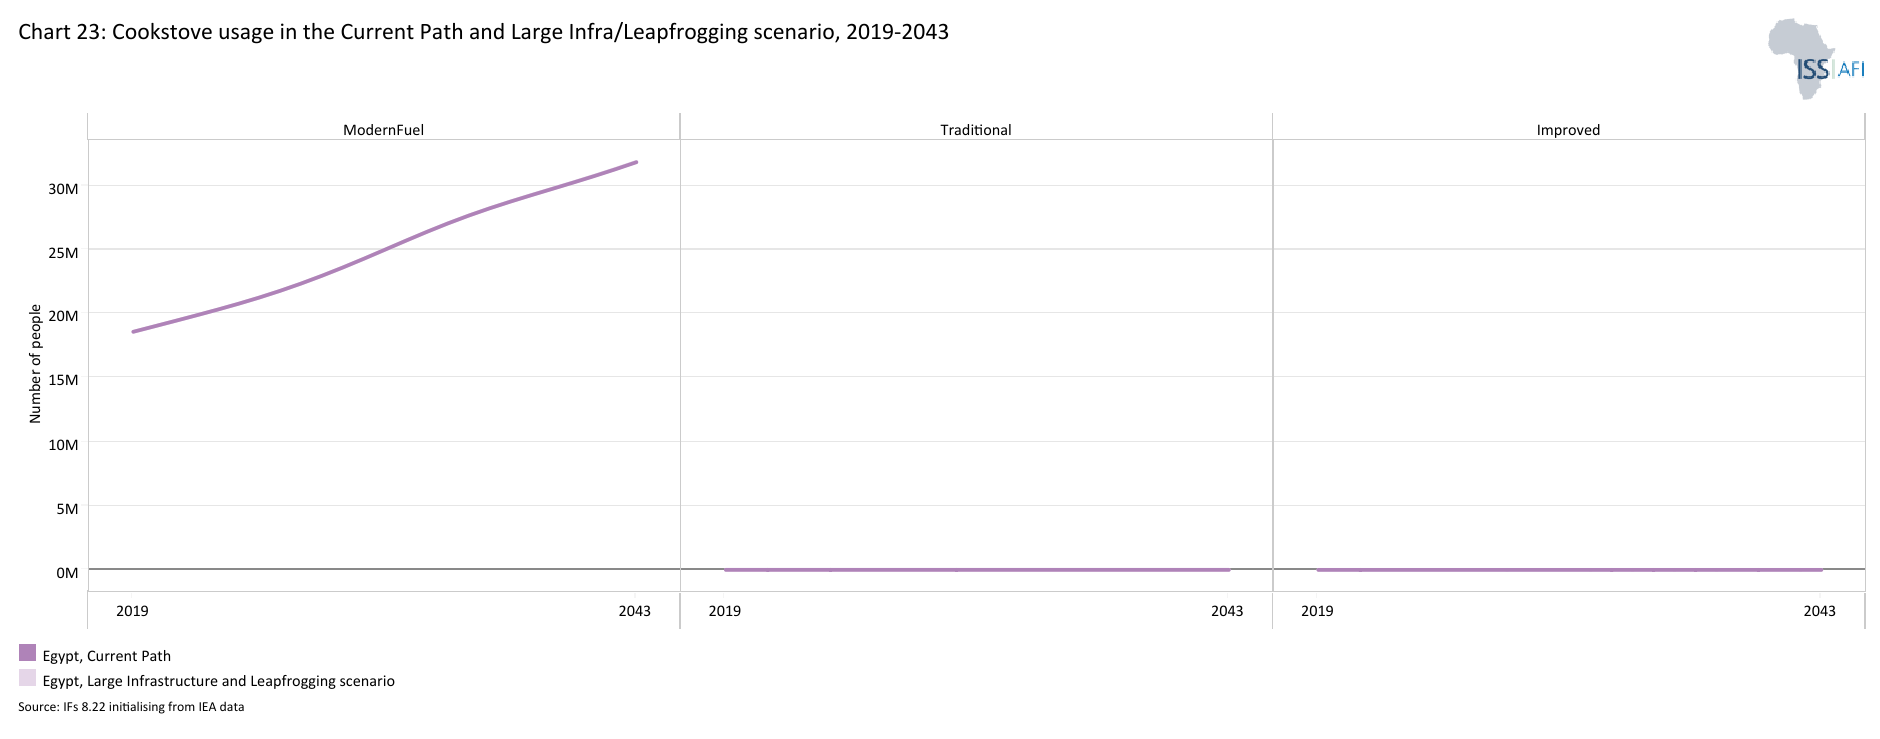
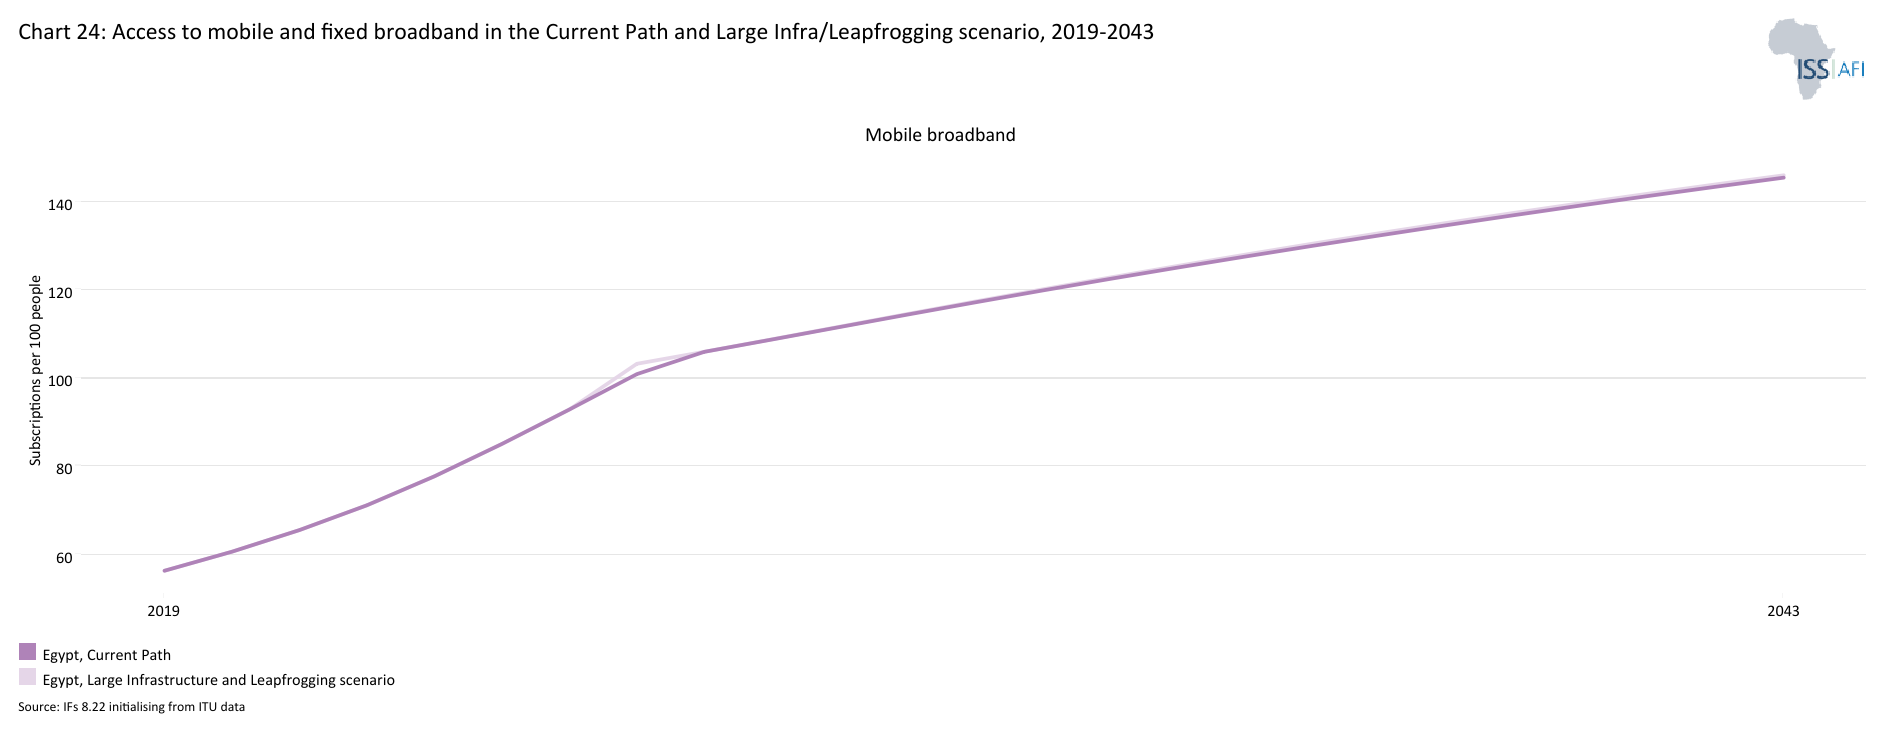
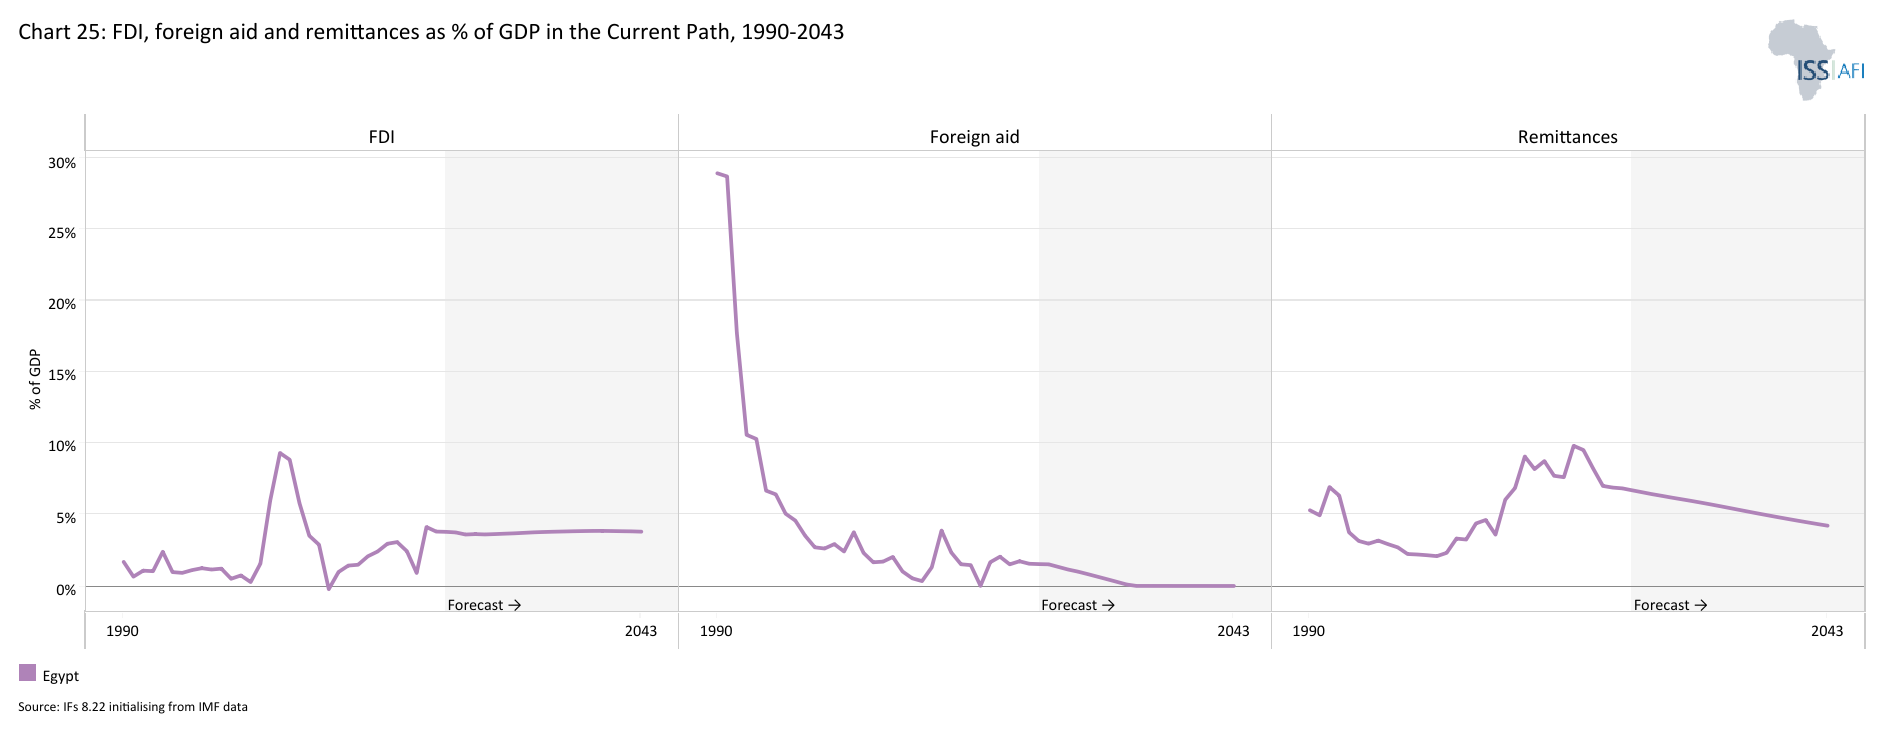
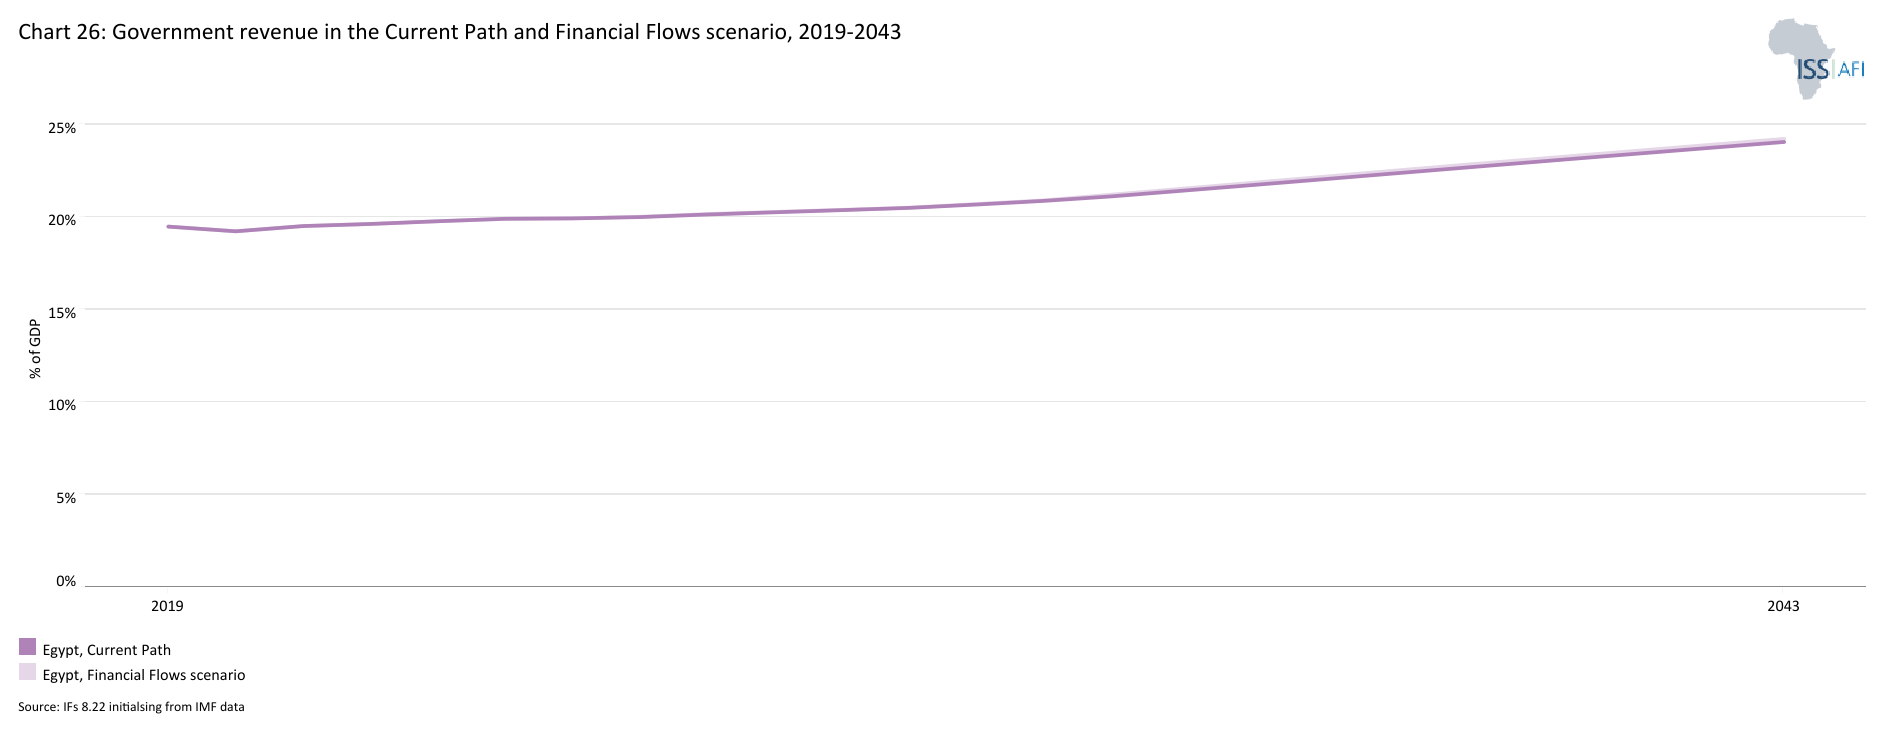
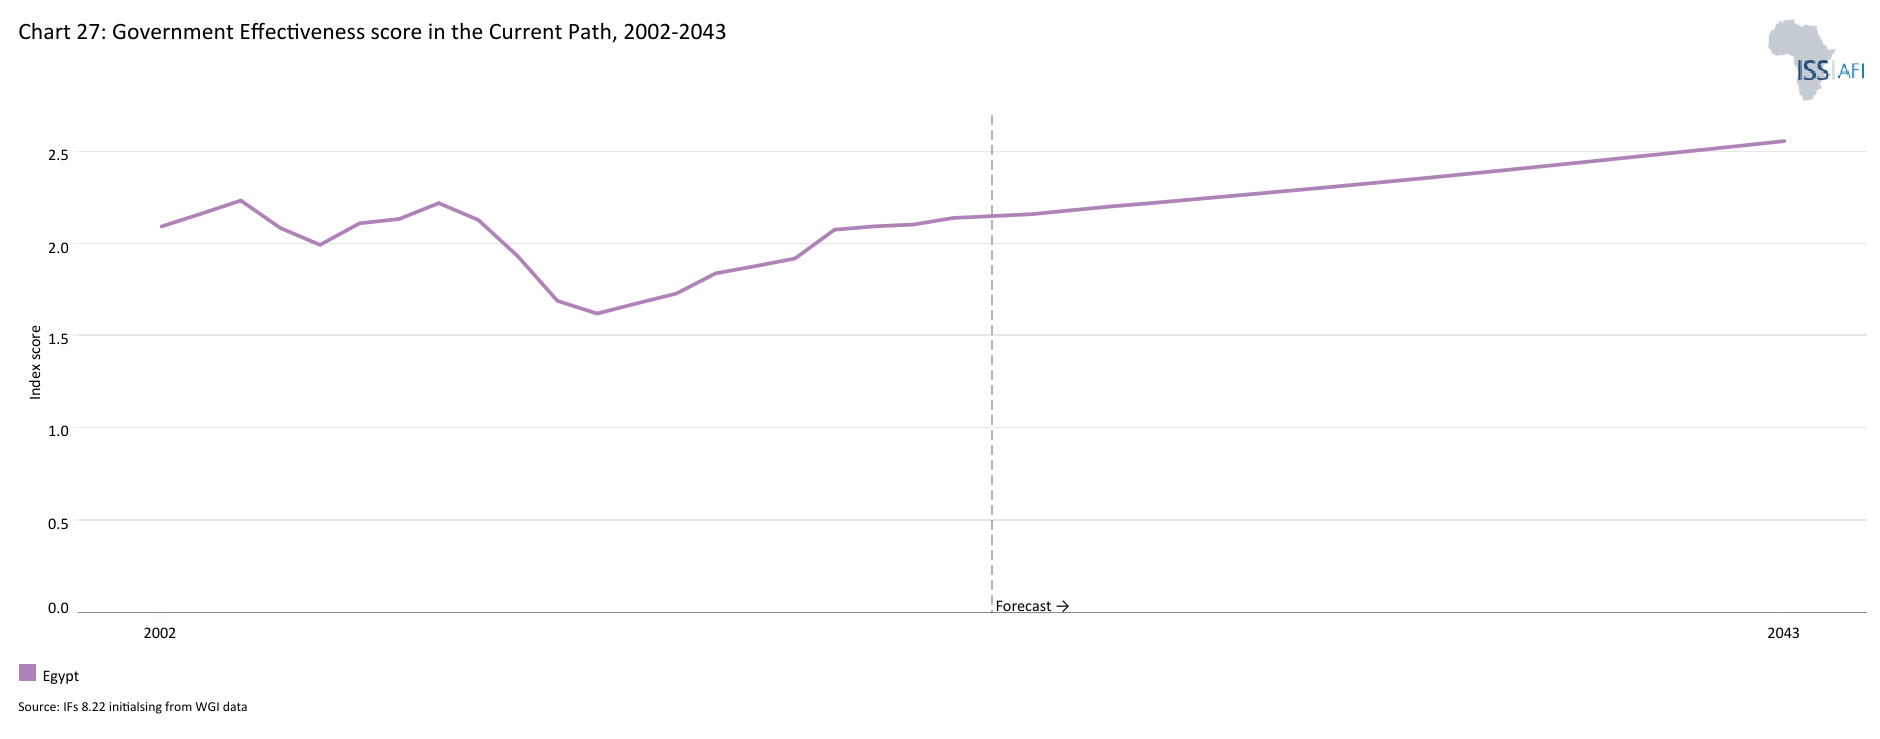
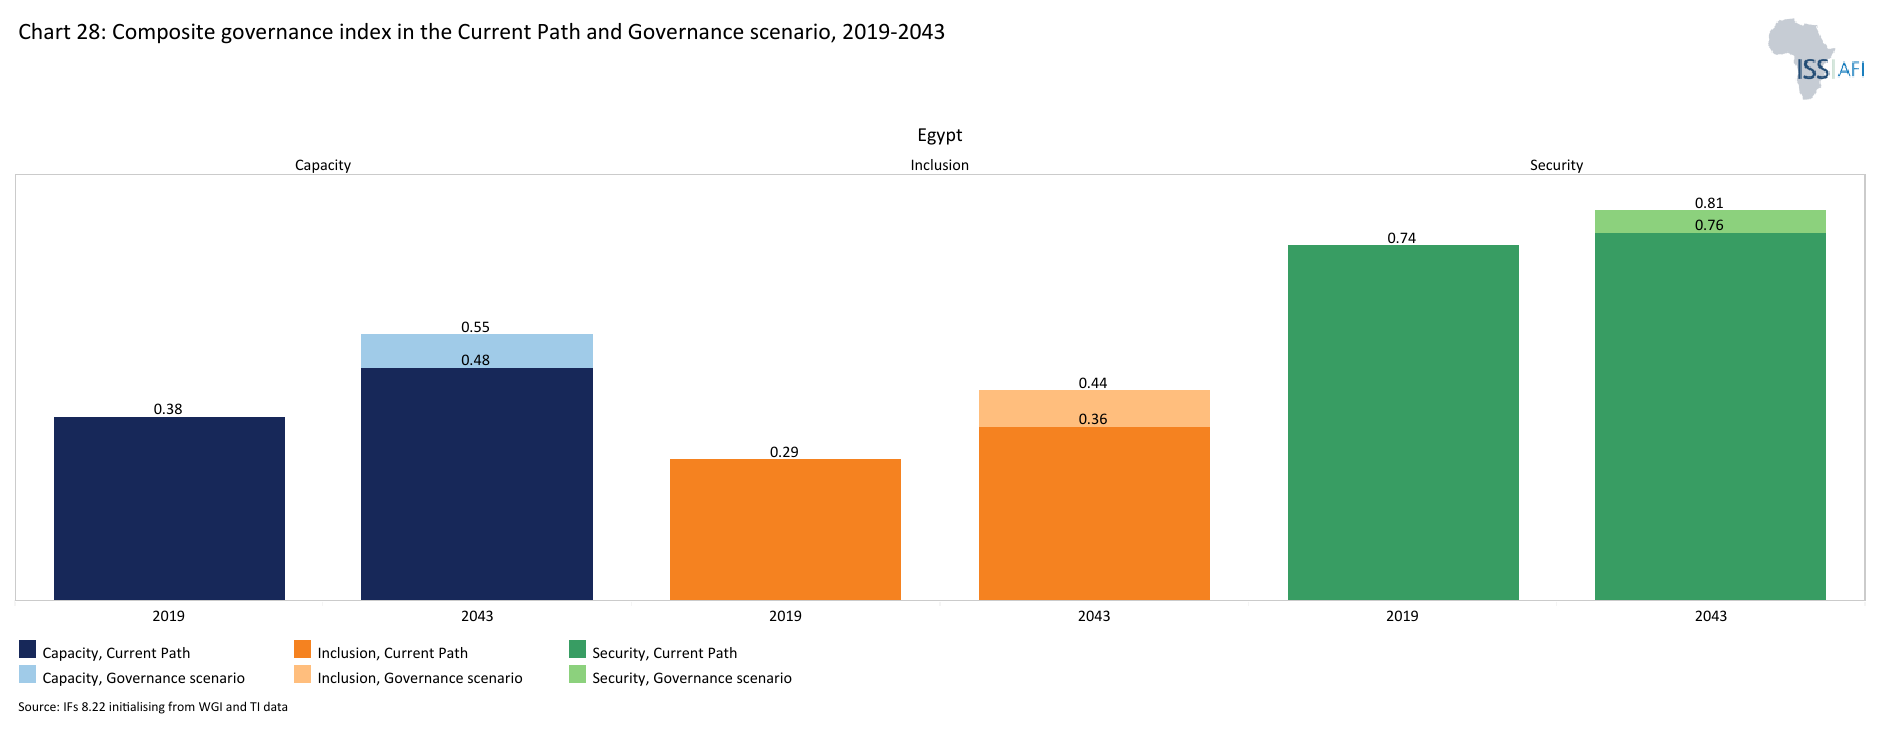
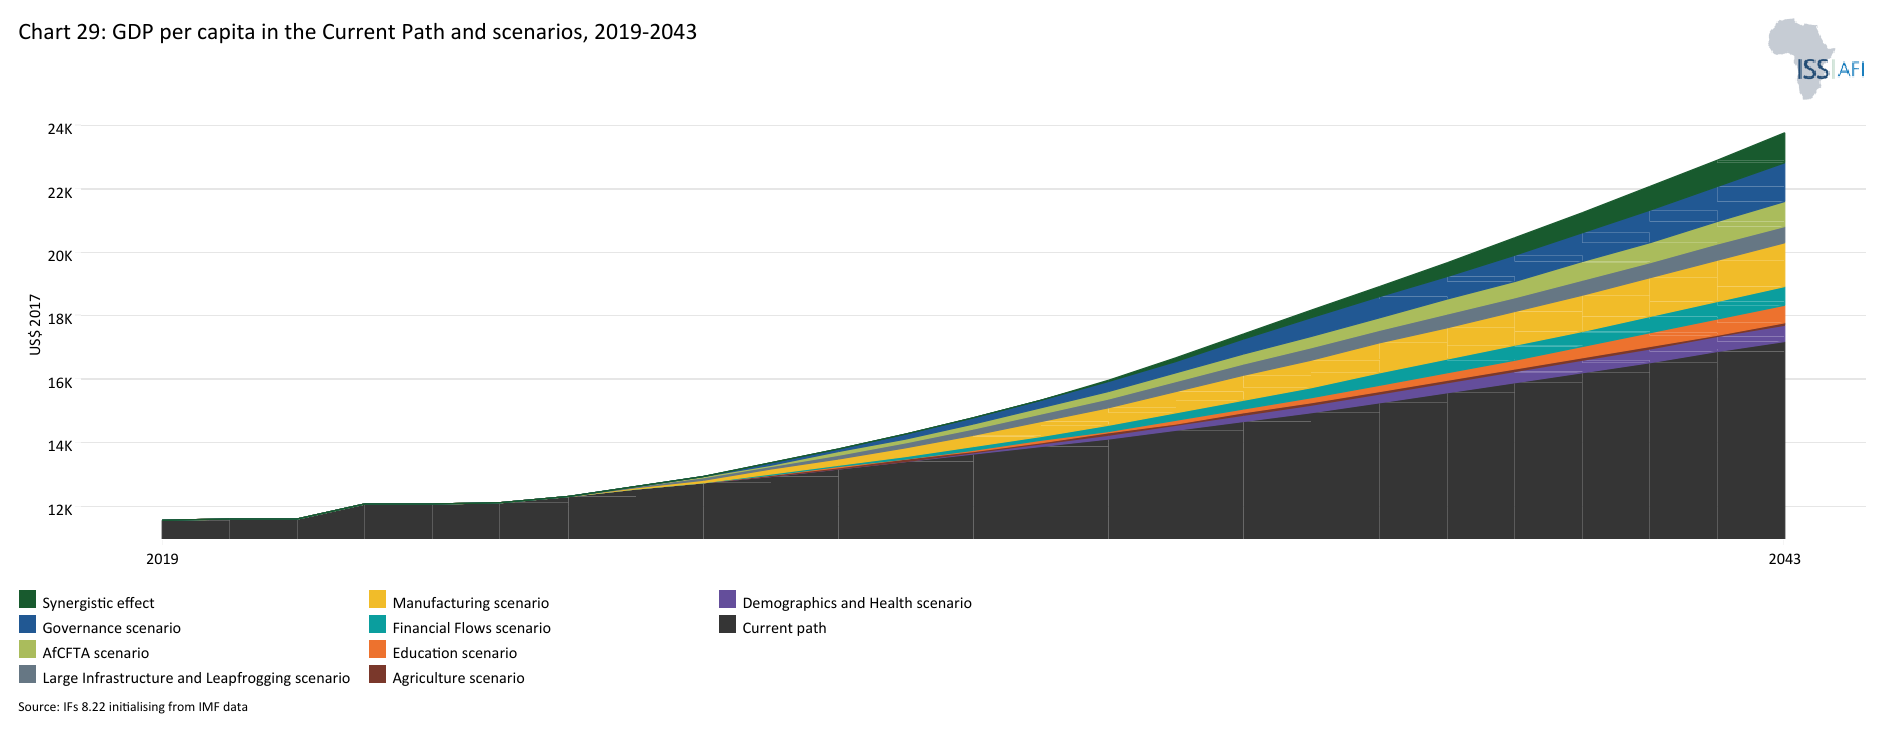
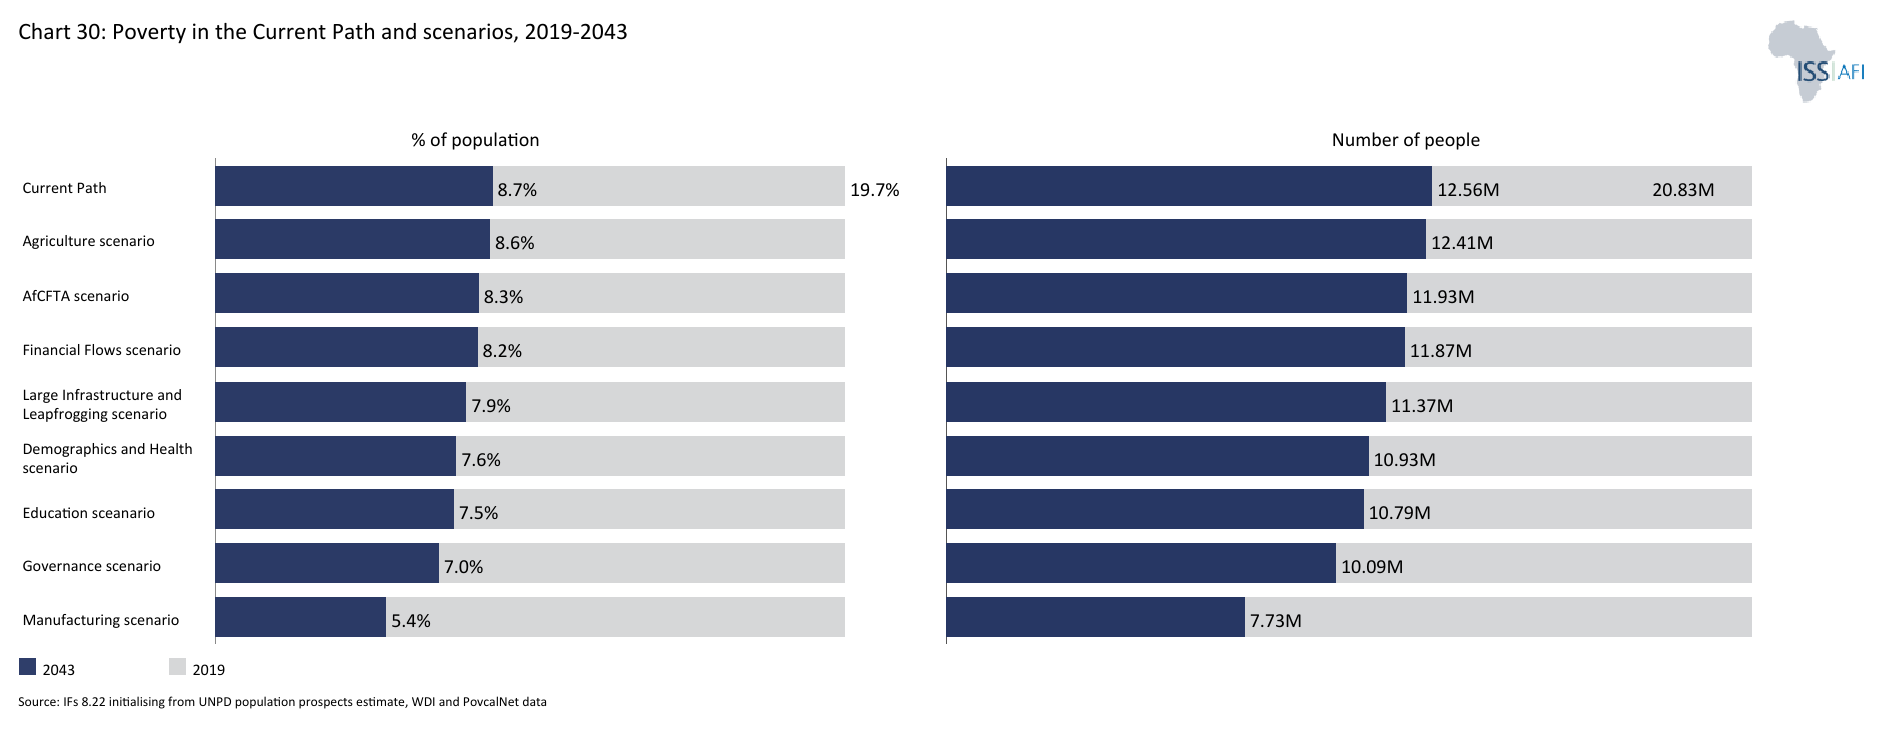
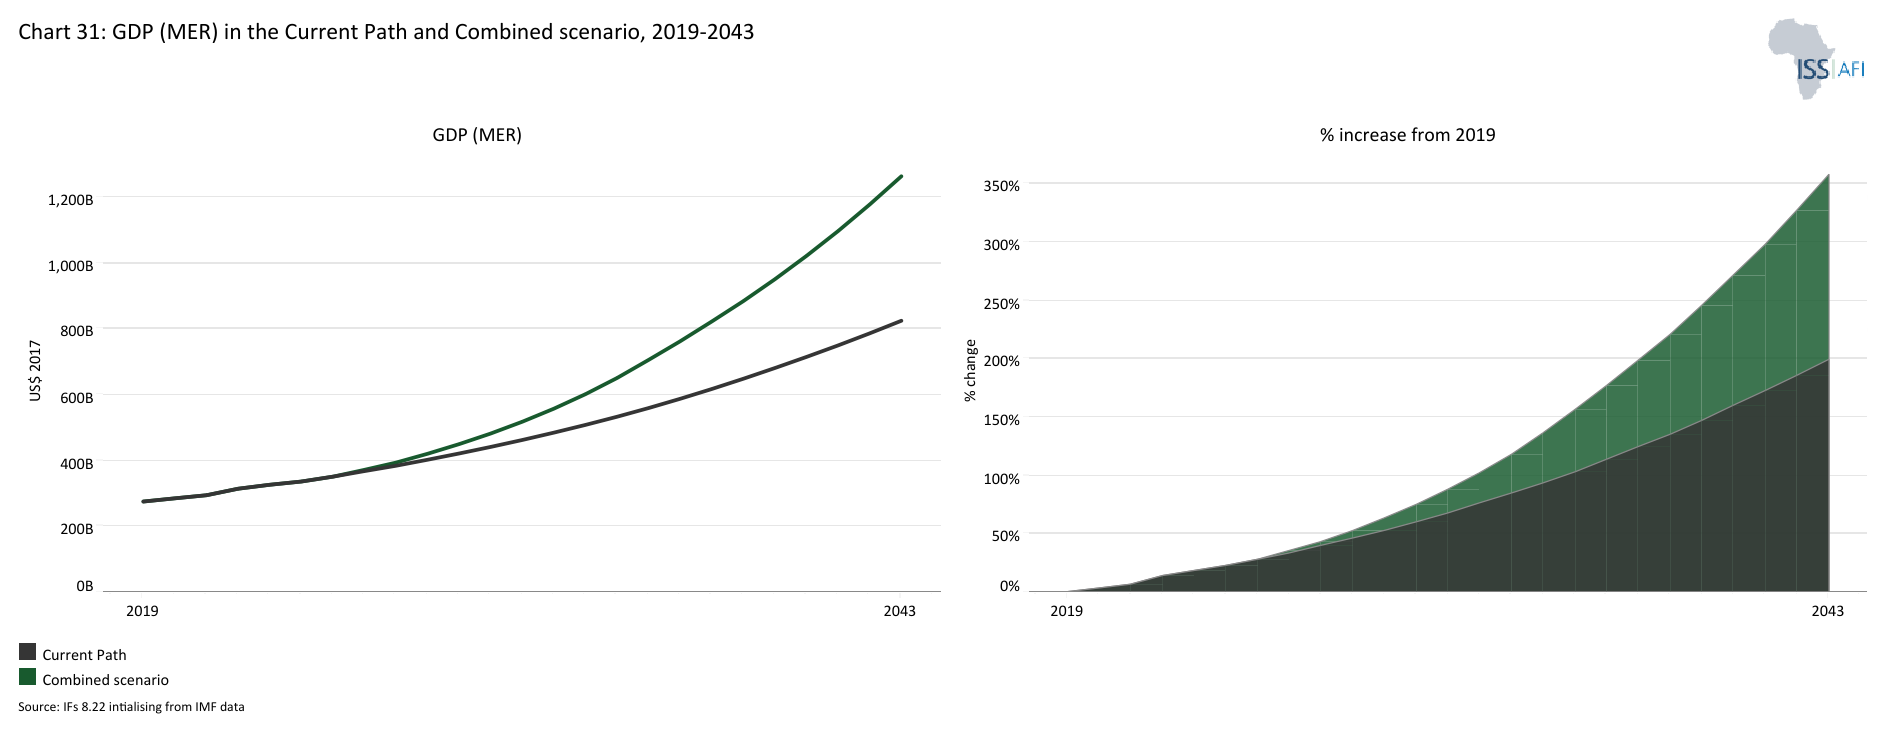
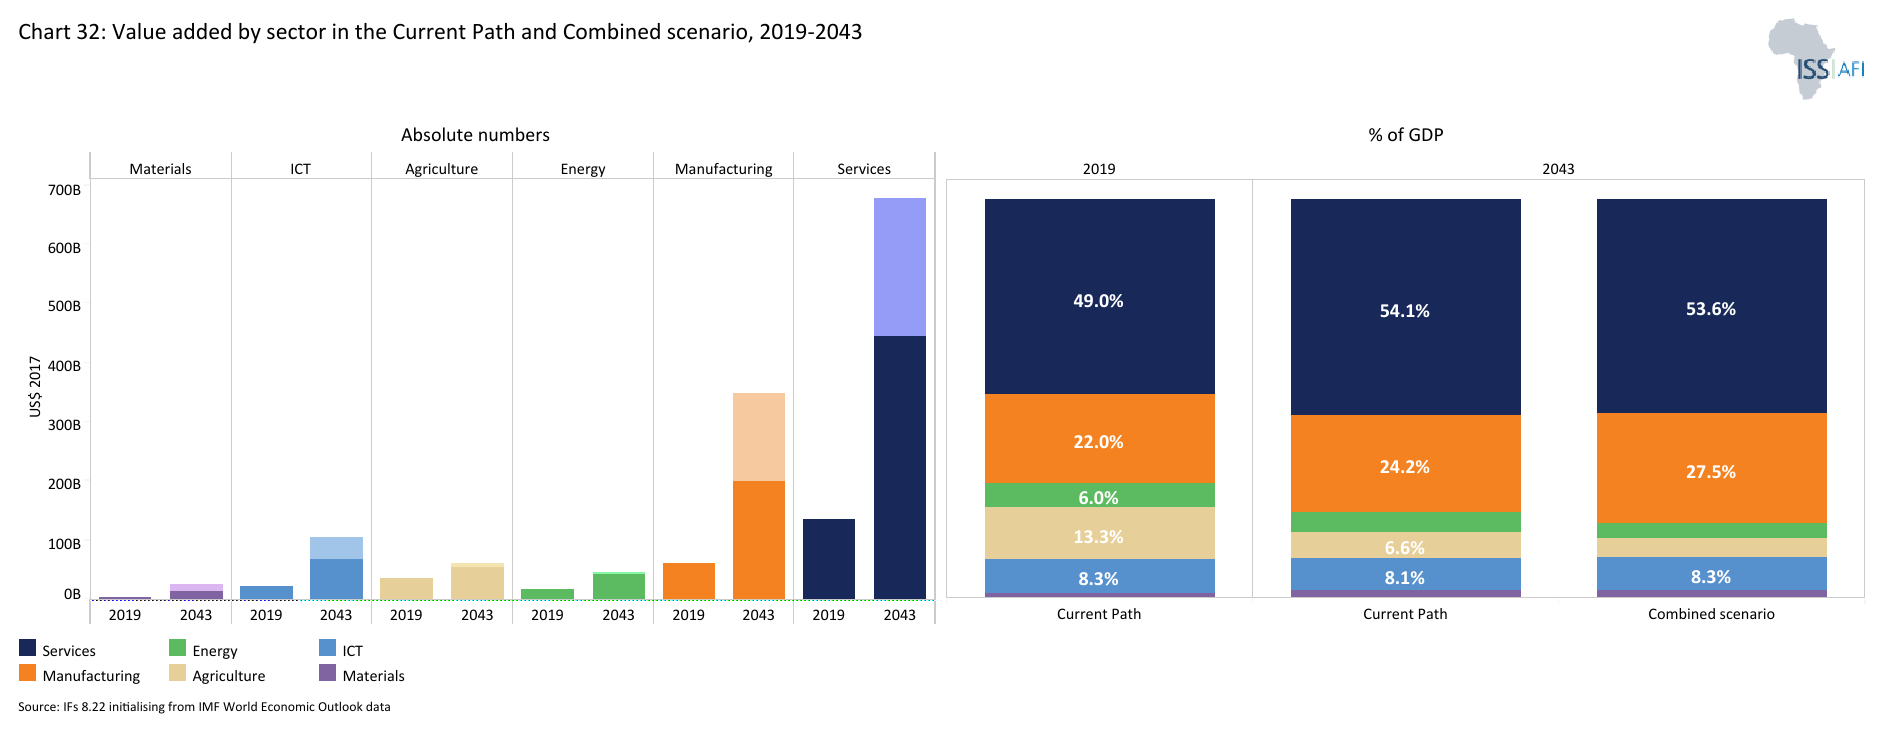
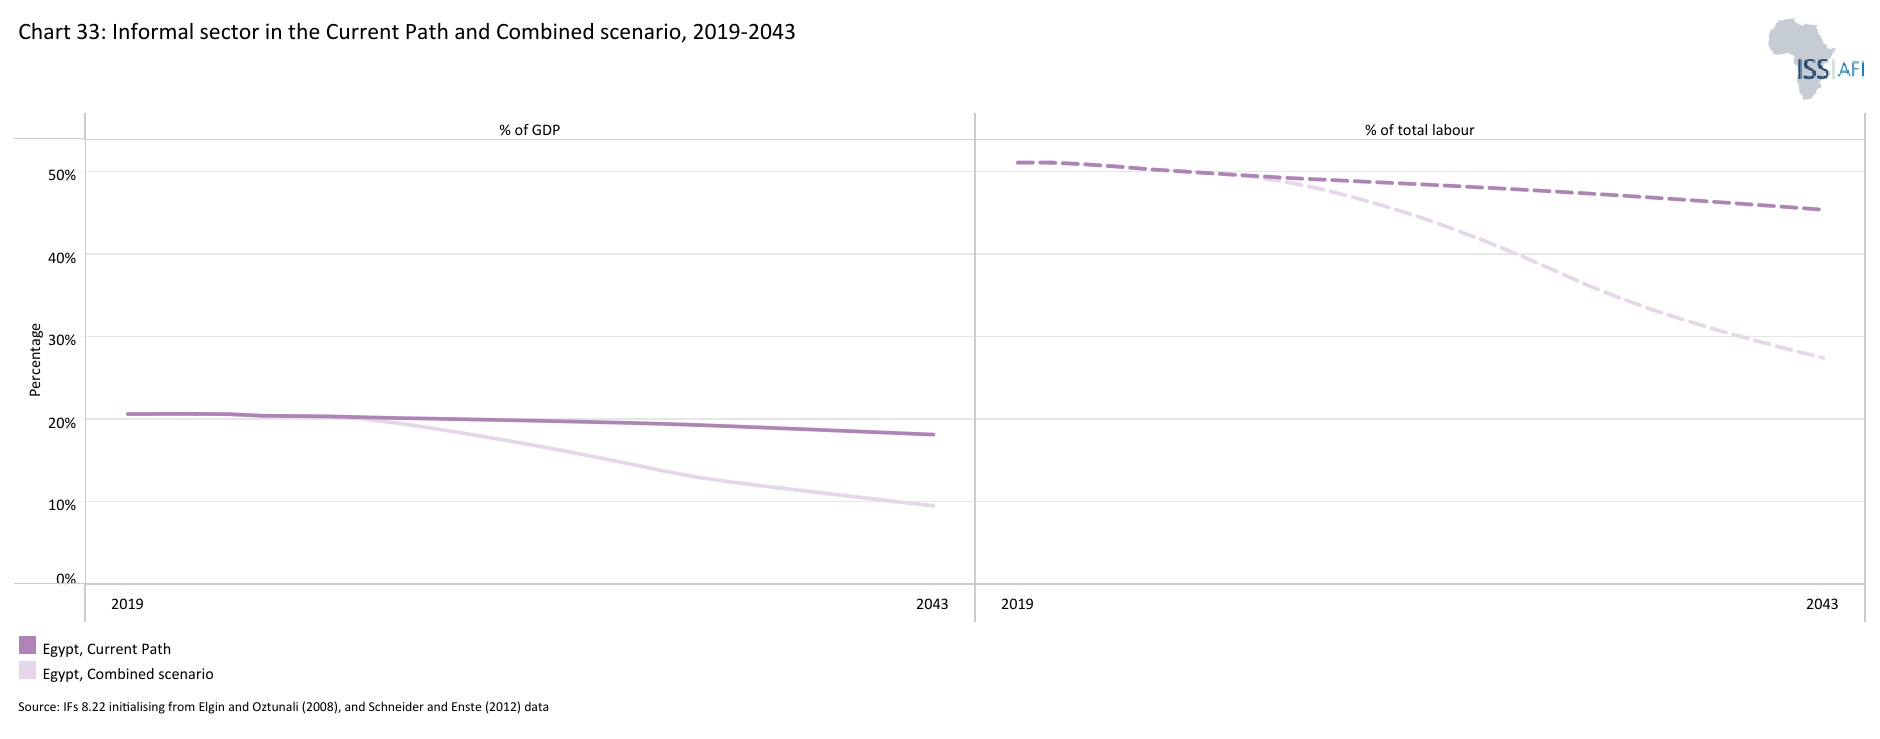
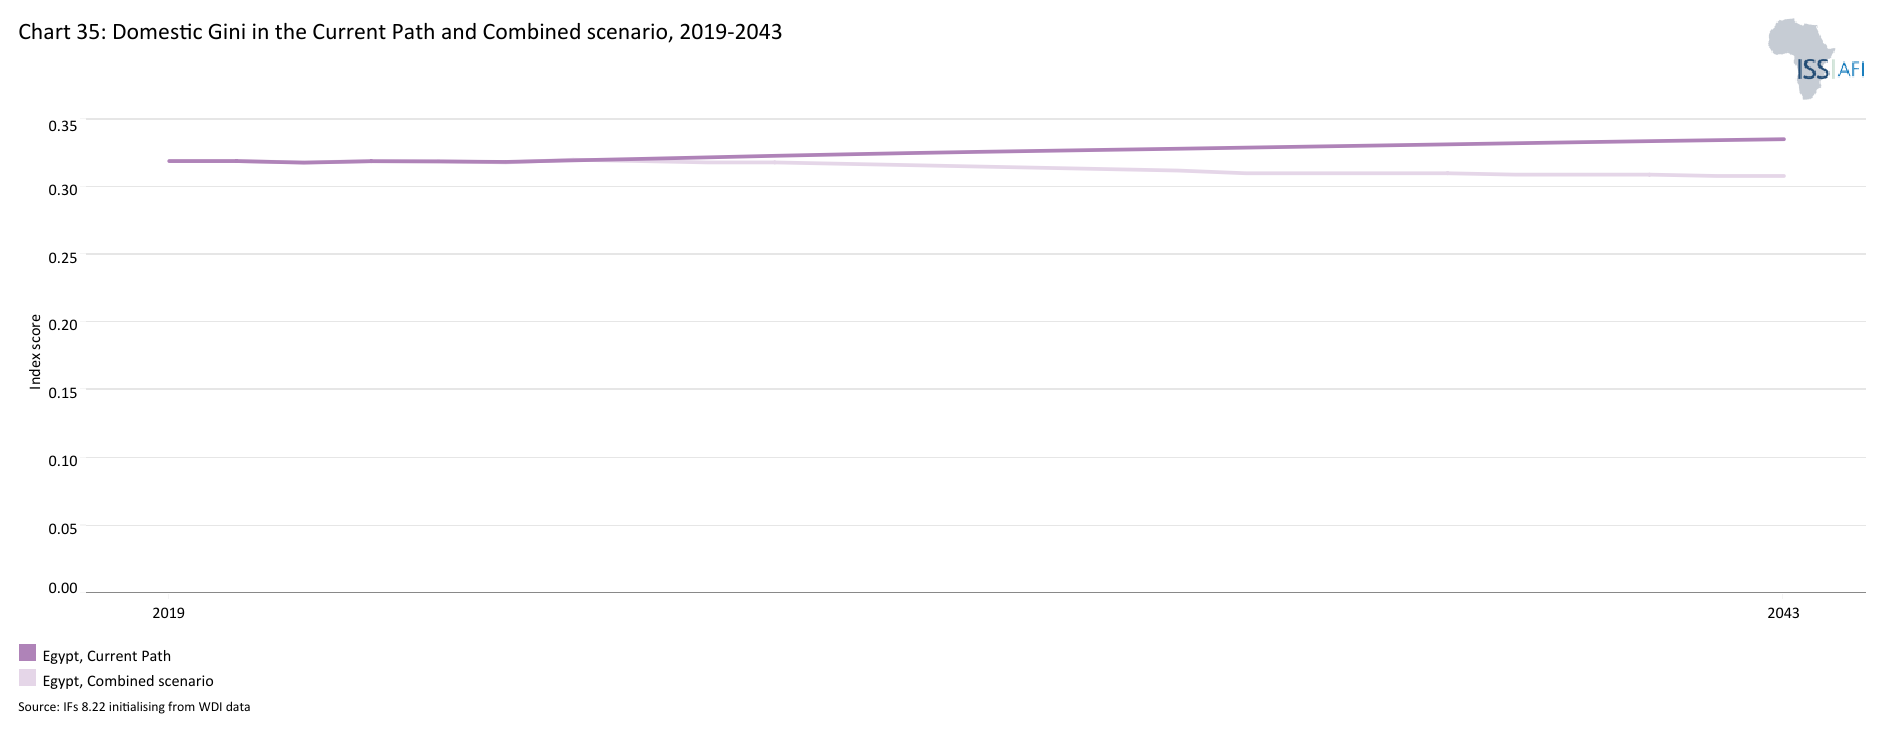
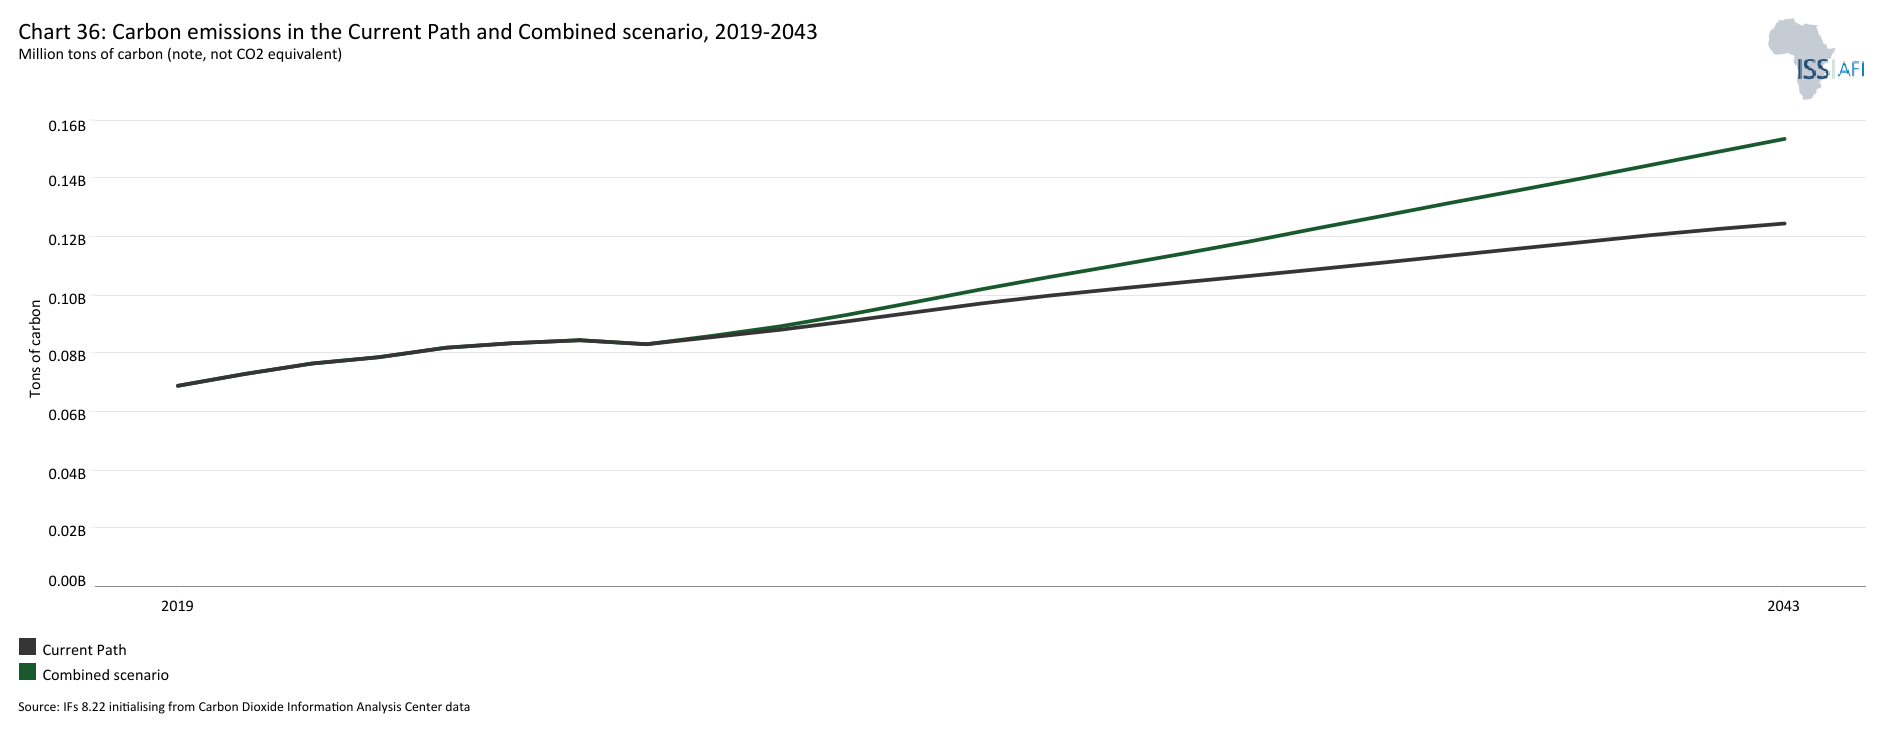
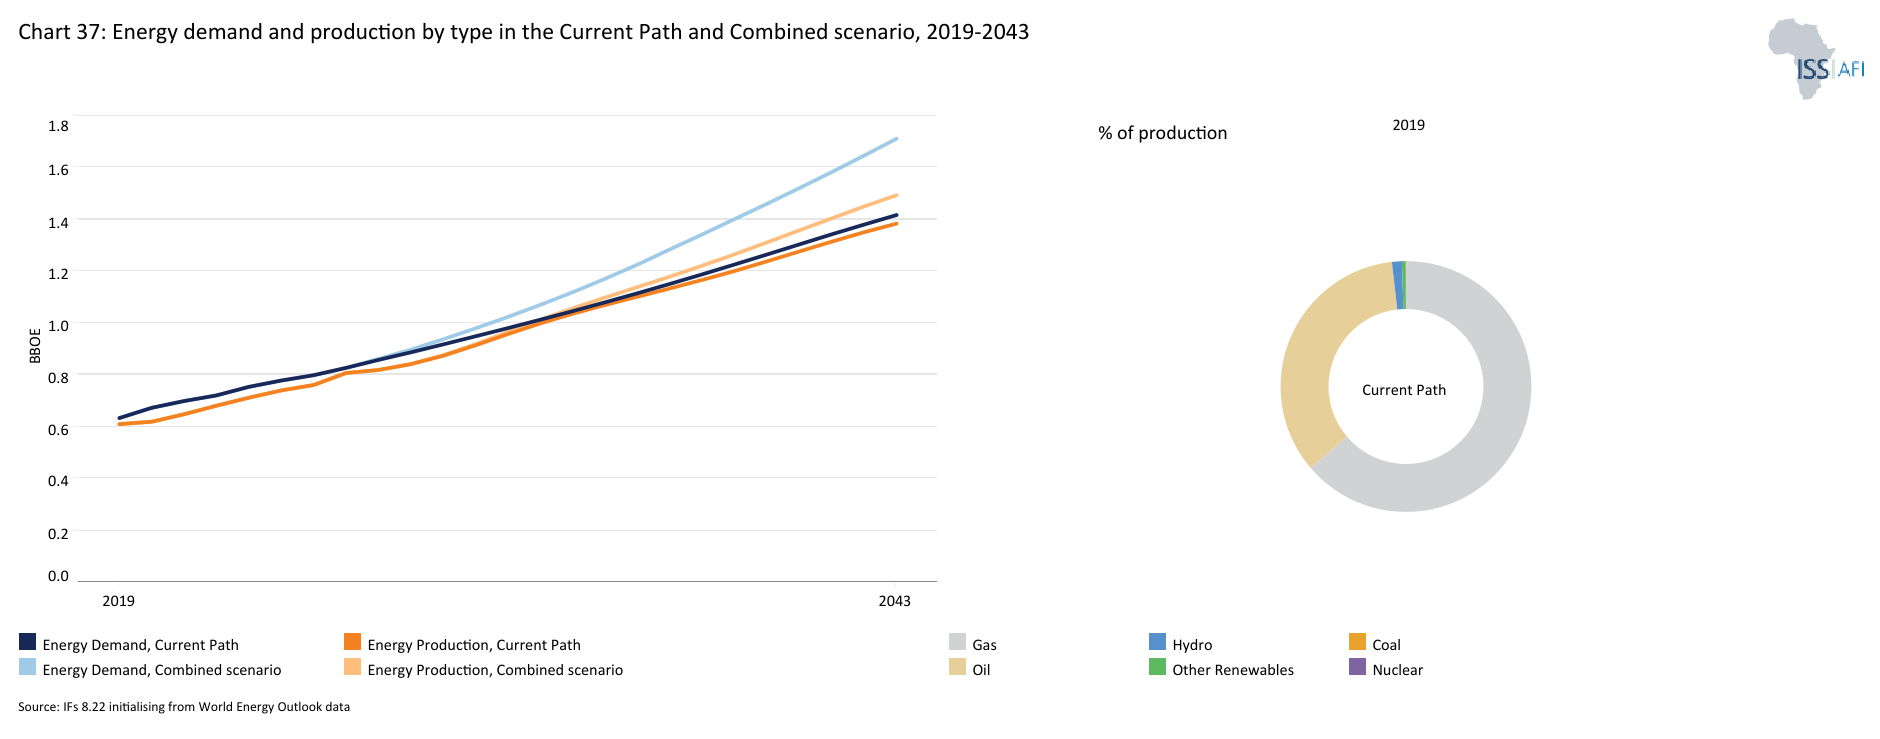
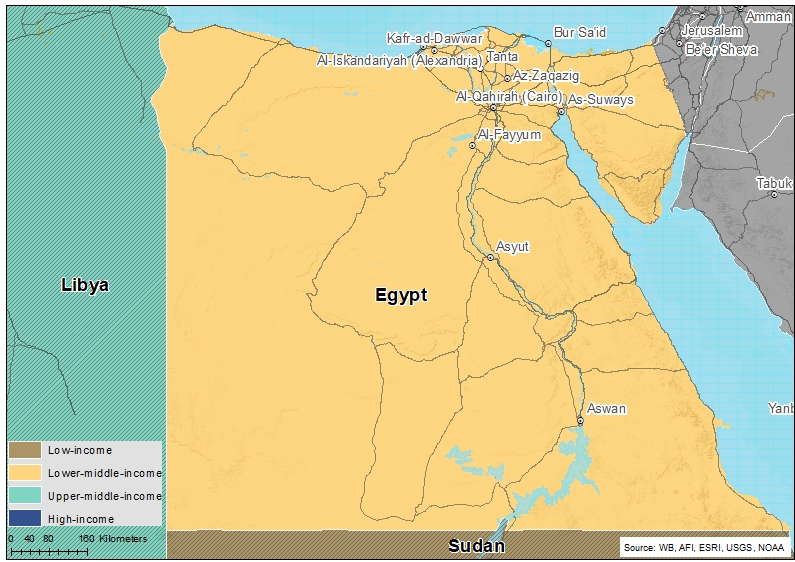
Chart 1 is a political map of Egypt.
Egypt is one of the 24 lower-middle-income countries in Africa, it is a transcontinental country spanning the northeast corner of Africa and the southwest corner of Asia. It is bordered by Israel, including the Gaza Strip after its occupation by Israel in 1967, Sudan and Libya, as well as the Mediterranean and the Red Sea. With a rich legacy, and often referred to as the “cradle of civilisation”, the nation thrives on tourism from all over the world, and has a population of over 113 million people as of 2023. Its official language is Arabic.
Egypt is considered a regional power in Africa and the Middle East. Geographically, it is the world’s 30th-largest country in terms of land mass, but 99% of the population makes use of only 5.5% of the land (along the Nile river), yielding one of the most densely-populated countries in Africa. Its landscape is mostly desert with some oases, with averagely very little rainfall, and a hot, sunny and dry climate. Its largest cities include Cairo, the capital, Alexandria and Giza, all popular tourist cities.
General Gamal Abdel Nasser assumed Egypt's presidency in 1954 following the 1952 revolution until he died in 1970, when he was succeeded by Anwar Sadat who was assassinated in 1981. The assassination of President Sadat paved the way for Hosni Mubarak to assume Egypt's Presidency, who ruled the country until his resignation in February 2011 following the Arab Spring that had started in Tunisia in 2010. In Egypt, the Arab Spring was characterised by massive street protests against President Mubarak for allegations of corruption, poor governance, poverty and political oppression, among others. After the resignation of President Mubarak, the Supreme Council of the Armed Forces suspended the Constitution, dissolved the People’s Assembly and constituted a transitional body to supervise the country's democratisation process.
The transitional process continued until June 2012, when Mohamed Morsi was declared president. However, his regime came to an abrupt end in the wake of massive protests in June 2013 calling for his immediate resignation, by people disgruntled by the direction in which Egypt was heading. The subsequent military intervention following the popular uprising sought to rectify the course of Egypt's democratic transition after being hijacked by Islamist groups. In May 2014, another election was held in which President Abdel Fattah Al-Sisi was declared the winner. His leadership has reduced the social turbulence that characterised the last decade. In 2018, President Al-sisi won a second term with 97% of the vote. A 2019 constitutional amendment extended the tenure of office of the president to six years though it maintained the term two-term limit. However, provisions were made to allow President Sisi to run for a third six-year term. The December 2023 election saw President Sisi win 89.6% of total votes to secure another six-year tenure.
Administratively, Egypt is divided into 27 governorates though power is still highly centralised. The President appoints governors and other executive officials. Thus, decentralisation is limited to administrative functions without devolution of substantive authority powers.
Approximately 90% of the population is Sunni Muslim and 10% is Christian. Shia Muslims comprise approximately 1% of the population.
Egypt has suffered from terrorism for decades, with attacks targeting government officials, security forces, tourists, religious minorities and civilians. The main perpetrators are Islamic extremist groups, prominently the Ansar Beit Magdis in Sinai, however recent developments suggest that Egypt has succeeded in defeating these terrorist groups. After the 1973 war with Israel, Egypt has not been at war with others, but has sought to protect itself from terrorism.
Chart 2 presents the Current Path of the population structure, from 2090 to 2043.
Egypt is the most populous country in North Africa, and the 3rd most populous country in Africa after Nigeria and Ethiopia. In 1990, Egypt’s population stood at 57.2 million people. By 2023, the population had nearly doubled to 113 million people. This growth can be attributed to the high fertility rate in many parts of the country, particularly in the rural areas where fertility rates are far above the national average. A study by the United Nations (UN) Population Fund in 2018 found that fertility rates reached 2.75 in urban governorates, compared to 3.52 to 3.93 for both Upper Egypt and border governorates, respectively. Also, there is also a high proportion of women within their childbearing age coupled with low usage of modern contraceptives mainly due to socio-economic factors. These include the perception that more than three children are ideal, lack of female empowerment with husbands still being the main decision makers and disapproving of family planning, and inadequate labour market opportunities for women. Rapid population growth as a result of high fertility rates and population momentum have costly repercussions for the economy and human development prospects. It inevitably contributes to the deterioration of quality of life in terms of health, nutrition, access to employment and other basic amenities.
However, population growth has slowed in recent years due to the slowing fertility rate. In 2023, Egypt’s population growth rate of 1.5% made it the 10th-lowest in Africa. This was below the average of 2.6% for Africa and a decline from the 2.2% it recorded in 1990. Likewise, in 2023, the total fertility rate among women in the childbearing age in Egypt of 2.8 births per woman was below Africa’s average of 4.3 births per woman and was the 11th-lowest in Africa and the 4th-lowest in North Africa after Tunisia, Morocco and Libya. In terms of population structure, 32.6% of Egyptians were below the age of 15 years while 62.3% were in the age group 15–64 years (working age) and 5% were 65 years and older. Comparing this with the structure in 1990 reveals that Egypt’s population structure has fundamentally changed over the past three decades.
The country’s youth bulge (the ratio of its population aged between 15 and 29 to the total adult population) stood at about 37% in 2023 — a fall from 45% in 1990. This was below the average of 45.4% for Africa but higher than the 33.9% average for North Africa. The median age for Egypt in 2023 was 25.3 years — an increase from 18.4 years recorded in 1990 and Africa’s median age of 20.4 years but below North Africa’s average of 27.4 years. The large youth bulge in the country raises concerns about youth unemployment and underemployment. The IMF projection in 2019 was that the country needs to create about 3.5 million jobs over the next 5 years to benefit from its demographic dividend.
In the forecast horizon, the structure of the Egyptian population will change as the share of the youth population declines. With the country’s population growth rate declining to 0.9% by 2043, the total population will rise modestly reaching 145.4 million in 2043 by which it will be the fourth-largest in Africa after Nigeria, Ethiopia and DRC. By then, the median age will increase to 30.0 years, and the youth bulge will slightly fall to 33.6%. The proportion of people under the age of 15 will decline to 25%, while the share of the working-age population and the population aged 65 and older will increase to 66.8% and 8.2%, respectively, by 2043. Such rapid decline in population growth will follow the rise in the use of modern contraceptives in the country reaching 74% of fertile women. This can facilitate Egypt’s development and improve average incomes much quicker as the demands on the fiscus to cater to its youthful population will reduce.
Chart 3 presents a population distribution map for 2023.
The total land area of Egypt is approximately 101 million km². In 2023, Egypt was the most densely populated country in North Africa and the 16th most densely populated country in Africa. The population density of Egypt is estimated to be about 1.14 people per hectare, which is higher than the average of 0.49 for Africa and 0.32 for Northern Africa. The majority of Egyptians reside in the rural areas along the fertile soils of the Nile valley and in the urban clusters of Cairo and Alexandria. The population density along the Nile is among the highest globally at more than 2 000 people per square kilometre. The most densely populated cities in Egypt include the national capital Cairo, Alexandria, Kalyouble, Gharbia, Suhag, Menoufia and Giza, among others. Other small communities are spread throughout the desert around the oases and historic trade routes.
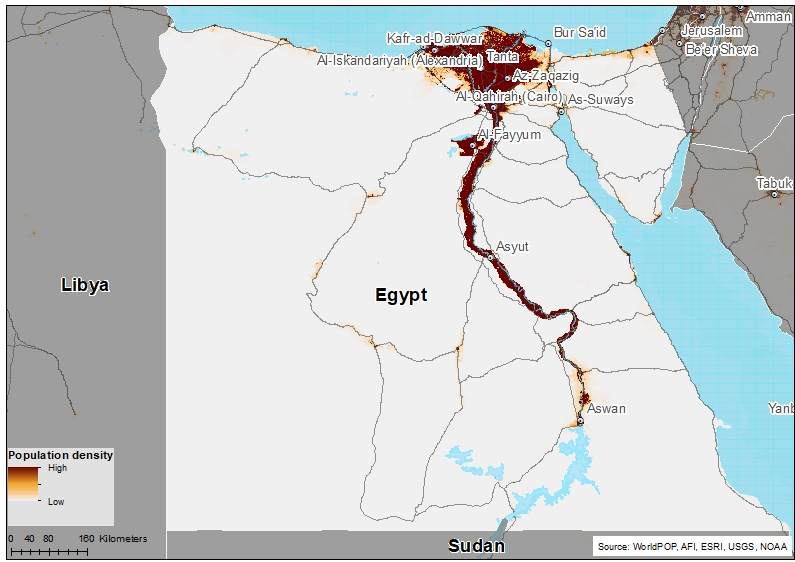
Chart 4 presents the urban and rural population in the Current Path, from 1990 to 2043.
In 1990, more than half (56.5%) of Egypt’s population resided in rural areas, below the average of 68.5% for Africa and 64.4% for lower-middle-income countries in Africa. Contrary to the situation in most other developing countries, the proportion of people in rural areas over the past three decades has generally stagnated. By 2023, 57% of the Egyptians still resided in rural areas compared to 55.2% average for Africa and 48.8% for Africa’s lower-middle-income countries. This signals ruralisation or counter-urbanisation in Egypt while its income peers are urbanising rapidly. The higher rural population can be explained by the fact that the majority of the population is concentrated along the fertile soils of the Nile Valley. Only 13 of Egypt’s cities have a population of more than 300 000 with eleven of them having inhabitants of under 500 000.
Nonetheless, there has been rapid migration into Cairo such that in 2017, about 500 000 additional people moved to settle in the city of Cairo making it the fastest growing city in the world. By 2030, Cairo will have 25 million people. The rapid population and urban expansion will further strain the provision and access to basic services like water and sanitation, especially to the 10 million to 12 million Egyptians living in informal settlements in urban areas. Already, about two-thirds of residents in the Greater Cairo Region reside in informal settlements which are mostly slums, and lack basic social amenities such as water and electricity. As a result, Cairo is considered to be one of the cities under threat globally, especially because Egypt is forecast to experience a critical water shortage by 2025.
To ease the pressure on Cairo, the government has been building a new city to serve as the New Administrative Capital since 2016. Located 30 miles east of Cairo and covering a 270-square-mile area, the new city, when completed, can accommodate almost 6.5 million people. With phase one almost completed, more than 1 500 families have already moved into the new city. Also, many government ministries have moved there with 48 000 government employees working there.
The trend of ruralisation will continue into the future as the proportion of the population that will reside in rural areas will only slightly decline to 53.5%, above the 41.2% average for its income peers meaning that the country will experience a slower rate of urbanisation compared to its income peers.
Chart 5 presents GDP in market exchange rates (MER) and growth rate in the Current Path, from 1990 to 2043.
In 2023, Egypt was the third-largest economy in Africa after Nigeria and South Africa. Its economy depends mainly on agriculture, telecommunication, petroleum exports, natural gas and tourism; it is also home to the Suez Canal, an artificial sea-level waterway which is considered the most important centre of maritime transport in the Middle East. Egypt’s GDP measured in market exchange rates (MER) almost quadrupled from US$79.9 billion in 1990 to US$327.9 billion in 2023. The average GDP growth rate within this period stood at 4.4% per annum, above the average of 3.8% for lower-middle-income countries in Africa. Although Egypt’s Vision 2030 targets a GDP growth rate of 10%, this goal was not met as the average growth rate between 2015 to 2020 stood at 4.5%.
The country’s economic liberation began in the 1970s and intensified in the 1980s. Some of the policies implemented included the substitution of expenditure on defence for infrastructural projects, as well as the shoring up of the natural gas industry, and the liberalisation of foreign trade. By the late 1990s, these investments gradually paid off, leading to an improvement in GDP. Since then, the oil and gas industry has been a major contributor to economic growth in the country. The discoveries and dynamic legislation of large oil fields in areas such as the Gulf of Suez, Western Desert, Eastern Desert and Sinai, have strengthened the robust oil and gas industry and been a huge contributor to more rapid economic growth. In fact, by the 1990s, the country was a strategic oil producer based on fields in four areas — the Gulf of Suez, Western Desert, Eastern Desert and Sinai. By 2011, the sector was growing at unprecedented levels attracting nearly 70% of Egypt’s foreign direct investment. In recent years, the government under President Sisi, with the assistance of the IMF, has embarked on an economic reform agenda to restructure the economy. Through this, tax reforms have been introduced, while government expenditure has been cut down and several infrastructural projects such as the construction of a new capital city, a large nuclear energy project and a second canal parallel to Suez are intended to boost the economy.
Although the macroeconomic indicators improved, the country still suffers from the impact of fiscal and monetary instability. The economy is challenged in all spheres, including weakening domestic currency, high inflation rate, capital flight and rising public debt. Also, Egypt’s high growth rates have not translated into the needed jobs to reduce unemployment. The country’s long-standing challenges were further compounded by the COVID-19 pandemic. Due to slowed economic activity, the pandemic worsened the high unemployment rate (from 7.7% in 2019 to 9.6% in 2020) especially in the formal sector, creating a wider budget deficit. This also led to a drop in foreign reserves, tourism, Suez Canal revenues and merchandise exports.
Post COVID-19, the country is currently experiencing an economic downturn which perhaps is the most severe since 2011 with debt-to-GDP ratio significantly increasing to 92.7% in 2023. Similarly, annual urban inflation was rising to 33.8% by the end of 2023 mainly driving higher food prices, rising cost of production and expansionary monetary policies particularly in extending credit to the public sector.
While the country’s economic growth prospect is higher than its income peers, it will still lag behind its Vision 2030 targets if nothing is done to accelerate its development potential and harness its economic opportunities. Even by 2030 which is the end of the implementation of the vision, Egypt will not meet its growth target of 12% on the Current Path. Indeed, by 2043, the average growth rate will be about 4.7% far below the desired target in Vision 2030.
Despite the negative economic repercussions, Egypt’s economic outlook remains positive with expected strong growth based on the IMF projections. Nonetheless, the country needs to deal with the many structural difficulties and economic vulnerabilities, particularly on issues related to stabilising the economy, underperforming non-oil sector, job creation mechanisms, the business development environment and rising government debt. On the Current Path, Egypt’s GDP is estimated to more than double to US$826 billion by 2043. The increase in GDP reflects the higher rate of economic growth expected to occur within the next 20 years.
Chart 6 presents the size of the informal economy as per cent of GDP and per cent of total labour (non-agriculture), from 2019 to 2043. The data in our modelling are largely estimates and therefore may differ from other sources.
Compared to most oil-rich Gulf countries, Egypt has a large informal sector. It accounts for about 68-70% of all new jobs and grows by 1% every year. The country is inundated with several small businesses that are unable to offer formal employment to the teeming labour force. Estimates show that 53% of establishments in Egypt are considered informal businesses.
The size of the informal sector in Egypt was equivalent to 20.5% of GDP, representing US$67.2 billion, in 2023, which was below the average of 29.2% for lower-middle-income African countries. Among Africa’s 24 lower-middle-income countries, only Algeria has a smaller informal sector. This suggests that compared to its income peer group, Egypt has performed relatively better in formalising its economy. However, other estimates show that informality in Egypt may be higher than this. Indeed, it is estimated that the informal sector contribution to GDP ranges between 29.3% to 50% of GDP depending on the data sources used. Such a large informality denies the government the needed tax revenue for development. The size of the informal sector will slightly decline to 18.2% of GDP by 2043 equivalent to US$150.4 billion and below the average of 26.3% for its income peers in Africa.
The informal sector contributes significantly to employment creation in Egypt. In 2023, 50.4% of the total labour force in Egypt were employed in the informal sector making it the tenth-largest among Africa’s lower-middle-income countries. Although this was below the 55.5% average for lower-middle-income countries in Africa, it's very high particularly compared with the contribution of the sector to GDP. This may be due to the high levels of informal employment within the formal sector. Many larger firms do not offer formal employment, as only about half of employees in such firms have contracts and social insurance. Another reason could be that our modelling underestimates the informal sector’s contribution especially as other sources estimate a much larger value, as explained above.
An important feature of informal employment in Egypt is that it is more prevalent among vulnerable age groups: youth (between 15 and 24 years) and aged (65 years and above). Almost 93% of all working-aged and 90% of young people working are employed in the informal sector.
A World Bank analysis shows that Egyptian workers in the informal sector crave stability and job security, as most jobs lack written contracts or social insurance. Also, most workers in the sector indicate that they are willing to work for even 20% lower wages in the formal private sector due to the job security that comes with it. In fact, Egypt ranks among the 10 worst countries (out of 149 countries) for working people in the International Trade Union Confederation’s (ITUC) Global Rights Index report of 2024. Together with its large youth bulge, the survivalist employment in the informal economy could be a key driver for socio-economic unrest.
On the Current Path, informal labour will decline to 45.5% by 2043 which will still be below the average for its income peers in Africa. By 2043, the size of the informal sector in Egypt will be about 6.6 percentage points lower than the average for lower-middle-income African countries.
Chart 7 presents GDP per capita in the Current Path, from 1990 to 2043.
Despite its limitations, GDP per capita is generally used to measure the standard of living and is the most widely used and accepted indicator to compare welfare among countries. Egypt has the highest GDP per capita among the 24 lower–middle-income countries in Africa. Using the purchasing power parity (PPP) measure for this analysis, it’s GDP per capita of US$12 070 in 2023 was almost twice the group average of US$6 127. This figure represents a tremendous improvement (almost 100%) from the US$6 297 it recorded in 1990. This GDP per capita is due to its relatively high economic growth and slower population growth which ensures that gains from growth are higher than compared to the average of its income peers. On the Current Path, Egypt will still have the largest GDP per capita among its peers at US$17 190 by 2043. At this rate, the country’s GDP per capita will be more than twice the average of US$7 942 for its income-group peers in Africa.
Chart 8 presents the rate and numbers of extremely poor people in the Current Path from 2019 to 2043.
In 2015, the World Bank adopted US$1.90 per person per day (in 2011 prices using GNI), also used to measure progress towards achieving Sustainable Development Goal (SDG) 1 of eradicating extreme poverty. In 2022, the World Bank updated the poverty lines to 2017 constant dollar values as follows:
- The previous US$1.90 extreme poverty line is now set at US$2.15, also for use with low-income countries.
- US$3.20 for lower-middle-income countries, now US$3.65 in 2017 values.
- US$5.50 for upper-middle-income countries, now US$6.85 in 2017 values.
- US$22.70 for high-income countries. The Bank has not yet announced the new poverty line in 2017 US$ prices for high-income countries.
Monetary poverty only tells part of the story, however. In addition, the global Multidimensional Poverty Index (MPI) measures acute multidimensional poverty by measuring each person’s overlapping deprivations across 10 indicators in three equally weighted dimensions: health, education and standard of living. The MPI complements the international $2.15 a day poverty rate by identifying who is multidimensionally poor and also shows the composition of multidimensional poverty. The headcount or incidence of multidimensional poverty is often several percentage points higher than that of monetary poverty. This implies that individuals living above the monetary poverty line may still suffer deprivations in health, education and/or standard of living.
Egypt has seen significant progress in many human development indicators but still experiences a number of challenges. As a lower-middle-income country, Egypt uses the US$3.65 benchmark for extreme poverty. According to the World Bank macro poverty data, 17.8% of Egyptians lived below the poverty line of US$3.65% in 2010. In 2023, 18.8 million Egyptians, representing 16.7% of the population, lived below the poverty line of US$3.65, far below the average of 46.4% for lower-middle-income countries in Africa. It means that over the past decades, the country’s effort at poverty eradication has yielded some results as the poverty rate declined below the average for its income peers in Africa. This is partly due to the government's implementation of its Haya Karima (Decent Life) initiative that has accelerated poverty reduction, particularly in rural areas.
Aside from income poverty, Egypt also experiences multidimensional poverty. According to the 2023 Human Development Report, Egypt was ranked 106th out of 204 states. Although this was an improvement over previous scores, it still has gaps in nutrition, school attendance, years of schooling, housing and even sanitation with 5.2% of the Egyptian population considered to be multidimensionally poor. Roughly 6.1% of the population is categorised as vulnerable and 0.6% are in severe poverty, with these figures disproportionately affecting those in rural areas. Regional inequalities and disparities also persist. Most of the poor and vulnerable population lives in the governorate of rural Upper Egypt especially in places such as Assyout, Sohag, Luxor and Minya. Based on the 2018 Household Income and Expenditure Survey, about 52% of people within this area cannot afford basic needs including food. The government reported that between the 2017/18 and 2019/20 financial year, household income in urban areas grew by 16% compared to 13% in rural areas. However, poverty rates in rural areas dropped faster than in urban areas, pointing to income polarisation and the difference in how people in rural and urban areas experience poverty.
On the Current Path, Egypt’s progress in reducing poverty rates will be more rapid compared to the average of its income-group peers in Africa such that by 2043, the poverty rate of 8.7% (equivalent to 12.6 million Egyptians) will be about 24 percentage points lower than the average for lower-middle-income countries in Africa.
Chart 9 depicts the National Development Plan.
The Sustainable Development Strategy: Egypt Vision 2030 is the broad framework for attaining Egyptians' dreams and aspirations of an advanced and prosperous nation inspired by the ancient Egyptian civilization’s achievements. Its overall vision is that “By 2030, Egypt will be a country with a competitive, balanced, and diversified economy, depending on knowledge and creativity, and based on justice, social integration, and participation, with a balanced and varied ecosystem, a country that uses the genius of the place and the citizens in order to achieve sustainable development and improve the quality of the life for all. Moreover, the government looks forward to lifting Egypt, through this strategy, to a position among the top 30 countries in the world, in terms of economic development indicators, fighting corruption, human development, market competitiveness, and the quality of life.”
The plan, developed on the principles of the sustainable development concept, intends to improve the quality of life of the present generation without compromising the right to a better life for future generations. Also, to ensure complementarity between the targets of the United Nations Sustainable Development Goals and Egypt’s Vision 2030, efforts were made to incorporate the SDGs targets into the Egyptian national planning system. This was the first nationally formulated strategy prepared in accordance with long-term strategic participatory planning. It incorporated broad stakeholder participation with strategic inputs from civil society, the private sector, ministries, and government agencies, women, youth and the disabled. In addition, the plan was formulated with the support and participation of international development partners.
The plan is broken into three dimensions, namely economic, social and environmental and further broken down into ten pillars. The economic dimension consists of the pillars of economic development; energy; knowledge, innovation and scientific research; and the transparency and efficiency of government institutions. The social dimension also comprises pillars of social justice; education and training; health; and culture. The final dimension of the environment involves the pillars of environment and urban development. There are also two additional pillars of domestic policy as well as foreign policy and national security, which serve as the comprehensive framework for the strategy and determination of the other pillars.
Each pillar consists of strategic targets, sub-targets, performance indicators, planned quantitative targets, expected challenges, and the appropriate programme and project sequence for execution based on priority. The strategic visions build on previous visions such as Egypt’s Strategy 2017, The Strategic Framework of Income Multiplying 2022 and the Urban Plan, 2052. In all, there are over 330 performance indicators and 50 associated strategic targets that are to be achieved through implementing about 200 programmes and projects.
The eight sectoral scenarios as well as their relationship to the Current Path and the Combined scenario are explained in the About Page. Chart 10 summarises the approach.
Chart 11 presents the mortality distribution in the Current Path from 2019 to 2043.
The Demographics and Health scenario envisions ambitious improvements in child and maternal mortality rates, enhanced access to modern contraception, and decreased mortality from communicable diseases (e.g., AIDS, diarrhoea, malaria, respiratory infections) and non-communicable diseases (e.g., diabetes), alongside advancements in safe water access and sanitation. This scenario assumes a swift demographic transition supported by heightened investments in health and water, sanitation, and hygiene (WaSH) infrastructure.
Visit the themes on Demographics and Health/WaSH for more detail on the scenario structure and interventions.
Although it is a developing country, Egypt’s current health profile largely mirrors that of developed countries. The success of Egypt’s long-running reforms has manifested in reduced incidents of communicable diseases, and longer life expectancy, among others. Some of the key accomplishments include a drastic decrease in rates of maternal and child deaths and chronic malnutrition. They also include the elimination of diseases like polio in 2006 and the establishment of a community health worker programme as a primary foundation towards equity in the provision of healthcare services. About 95% of its population lives within a 5 km radius of a health facility. It has also implemented the Social Health Insurance law towards achieving universal health coverage for its population.
However, alongside the successes, a range of other health issues plague Egypt’s ambition of an efficient health system beyond primary care services. The Egyptian Medical Syndicate estimates that between 2016 and 2019, out of the 220 000 registered doctors, 110 000 left the country. This means that Egypt has only 10 doctors per 10 000 people, trailing the global average of 32 per 10 000 people. Also, services in the public health sector are generally of low quality due to underfunding, lack of medical equipment and qualified personnel, poor sanitation and safety measures especially in rural areas. In 2016, it was estimated that Egypt had only 1.5 beds per 1 000 people relative to the global average of 2.7 per 1 000 people. The COVID-19 pandemic has further strained and exposed a struggling health system. All these challenges are impeding efficient healthcare delivery in the country.
Our modelling uses the International Classification of Disease (ICD) to differentiate between three broad categories of diseases: communicable, non-communicable and injuries, as well as 15 subcategories of mortality and morbidity. Unlike many African countries where communicable diseases are prevalent and leading cause of deaths, the reverse is the case in Egypt. Non-Communicable Diseases (NCDs) have been on the rise in Egypt, particularly since 1990, and will remain the leading causes of deaths in the country well beyond 2050.
In 1990, non-communicable diseases caused about 264 000 deaths — representing about 58% of total deaths in that year. This was followed by communicable diseases that caused 151 000 deaths (33.3% of total deaths) and injuries that caused 40 000 deaths (8.8% of total deaths). It signals that the country has undergone an epidemiological transition where deaths from non-communicable diseases outweigh deaths from communicable diseases. By 2023, 85.5% of all deaths in Egypt were from non-communicable diseases, translating into 571 000 deaths. This confirms World Health Organization estimates that more than 85% of total deaths in Egypt are caused by NCDs. Rising NCDs in the country is exacerbated by the prevalence of other behavioural and biological risk factors like smoking, unhealthy diets, physical inactivity, obesity and hypertension.
Also, deaths from injuries slightly increased to 50 000 equivalent to 7.5% of all death. However, deaths from communicable diseases had steadily declined to 47 000, (equivalent to 7% of all deaths) making it the lowest caused of deaths in the country. Among non-communicable diseases, death from cardiovascular diseases is the highest causing 47.3% of deaths in the country. This is followed by deaths from digestive and malignant neoplasm diseases which account for 12.5% and 10% of total deaths in the country respectively. There is also a high prevalence of strokes, cancer, diabetes, respiratory infections and other lifestyle diseases that are inherently more expensive to treat. Smoking for example is widespread, with roughly 20% of the population using tobacco products daily. In 2015, it was reported that the prevalence of diabetes was 16.7% in people between the ages of 20 and 79, representing 7.8 million cases at the time. Obesity among adults was over 33% higher than in some developed countries and one of the highest in the MENA region. The rate of hypertension among adults stood at nearly 25%, one of the highest in the world. This trend of declining communicable diseases but rising non-communicable diseases and injuries is set to continue on the Current Path.
By 2043, non-communicable diseases will still be the highest cause of death in Egypt causing 895 000 deaths in the country (about 88.8% of all deaths). By then, deaths from communicable diseases will rapidly decline to 36 000, constituting 3.6% of all deaths, while deaths from injuries will constitute the remaining 7.7%. This rising deaths from non-communicable diseases as the main cause of mortality in the country will inevitably increase health sector costs as they are more expensive to treat and put pressure on health budget which is already limited.
Investment in water and sanitation is critical for sustained human development in Egypt. In 2023, all Egyptians had access to improved water with almost 98.8% of the population having access to piped water supply in the country. Access to improved, safe, treated water, such as piped water, is an important means of preventing the spread of communicable diseases. It is therefore not surprising that the country records very minimal communicable diseases. This trend will continue although by 2043 the proportion of Egyptians with access to piped water will slightly decline to 94% while the remaining population will have access to other improved water sources.
Despite this universal access, the country will experience a critical water shortage by 2025. The Nile Basin is Egypt’s largest water source, with an allocated annual flow of 55.5 billion cubic metres. Ground and surface water sources account for about 0.5 billion cubic metres. The Nubian Sandstone Aquifer System in the Western Desert is also another important water source, but this is fossil groundwater which comes with the risk of contamination. However, Egypt requires about 90 billion cubic metres of water annually to meet its national needs and currently the water supply records a deficit of about 34 billion cubic metres. In 2018, the annual per capita share of water declined to 570 m3 which is below the set international standard of 1 000 m3. Also, the recent completion of the Grand Ethiopian Renaissance Dam (GERD), could put a significant strain on Egypt's already scarce water resources, accentuating the possibility of conflict between the two nations. In addition, Egypt faces issues of water quality and its impact on the environment and human health. It also experiences water pollution from a range of sources including chemicals like pesticides and herbicides. Water pollution has led to diseases like bilharzia, especially in rural areas.
Meeting the population’s water demand, bridging the rural–urban divide and improving water quality will require major investment. The government has signed numerous agreements seeking more funding to build desalination plants and improve long-term sustainability of water access in Egypt. However, these must be accompanied by a drive for better water management and more efficient use of this scarce resource, especially in the agriculture sector. Without closing the water supply and demand gap, Egypt is facing an inevitable crisis.
Regarding sanitation, over 98% of all Egyptians had access to improved sanitation in 2023. Only 1.5% of Egyptians lived in conditions with access to shared sanitation. On the Current Path, this trend will remain by 2043. This signals that Egypt has already attained SDGs goals 6.1 and 6.2 on universal and equitable access to safe and affordable drinking water and sanitation for all.
The National Rural Sanitation Program established by the Ministry of Housing, Utilities and Urban Communities has set a target to expand and improve nationwide access to sanitation services from. This would be through an integrated system of sewerage networks, sludge treatment and wastewater treatment plants. One of the initiatives under this programme, the Integrated Rural Sanitation in Upper Egypt-Luxor project, approved in 2019 and signed in 2021 received a US$129.8 million (€109 million) loan from the African Development Bank. This was to improve sanitation infrastructure and services to rural communities in Luxor Governorate in Egypt’s Upper Nile region.
Chart 12 presents the infant mortality rate in the Current Path and in the Demographics and Health scenario, from 2019 to 2043.
The infant mortality rate is the probability of a child born in a specific year dying before reaching the age of one. It measures the child-born survival rate and reflects the social, economic and environmental conditions in which children live, including their health care. It is measured as the number of infant deaths per 1 000 live births and is an important marker of the overall quality of the health system in a country.
The infant mortality rate is an important marker of the overall quality of a country’s health system. In 2023, the infant mortality rate in Egypt was 11.6 deaths per 1 000 live births—a significant drop by 448% from the rate in 1990. This was also just about a quarter of the average of 42.5 deaths for lower-middle-income countries in Africa. It means that Egypt has already met SDG goal 3.2.1 of reducing infant mortality to 12 deaths per 1 000 live births. On the Current Path, the infant mortality rate will decline further, reaching 7.7 deaths per 1 000 live births by 2043, which will still be far lower than the average of 29.4 per 1 000 live births for its lower-middle-income countries in Africa. Due to the high reduction rate that is forecast to occur in the Current Path, the Demographics and Health scenario will modestly reduce Egypt’s infant mortality rate to 6.3 deaths per 1 000 births by 2043. This is 1.4 deaths fewer than in the Current Path and almost twenty three fewer deaths than the Current Path average of lower-middle-income countries in Africa.
Chart 13 presents the demographic dividend in the Current Path and in the Demographics and Health scenario, from 2019 to 2043.
Demographers typically differentiate between a first, second and even third demographic dividend. Given Egypt’s youthful population structure, and the strides made in the past two decades, the study focuses on the first dividend. There are different ways to conceptualise the first demographic dividend. For example, studies have shown that a promising demographic window occurs when less than 30% of the population falls within the ages 0–14 years (children) while those above the age of 65 years and above (elderly) make up less than 15%. Alternatively, a demographic dividend opens when a country attains an average median age of between 26 and 41 years. We generally use the ratio of working-age persons to dependants, i.e. the size of the labour force (between 15 and 64 years of age) relative to dependants (children and elderly people).
The demographic dividend is the economic growth generated by change in the population structure. It generally materialises when the ratio of the working-age population to dependants is at least 1.7-to-1, meaning that for every dependant, there are 1.7 workers. When there are fewer dependants to take care of, it frees up resources for investment in both physical and human capital formation. Studies have shown that about one-third of economic growth during the East Asia economic ‘miracle’ can be attributed to the large worker bulge and a relatively small number of dependants. However, the growth in the working-age population relative to dependants does not automatically translate into rapid economic growth unless the labour force acquires the needed skills and is absorbed by the labour market. Without sufficient education and employment generation to successfully harness their productive power, the growing labour force (especially those in urban areas) could increasingly become frustrated with the lack of job opportunities leading to social tension and even the emergence of civil instability.
In 2023, the ratio of the working-age population to dependants in Egypt was 1.65-to-1, which means that on average, for every dependant in Egypt, there were 1.65 people of working age (15–64 years of age). This is significantly above the 1.36-to-1 average for lower-middle-income countries in Africa. The low dependency rate in Egypt can be attributed to the relatively low fertility rate. On the Current Path, Egypt will achieve the minimum ratio of 1.7 working age persons for each dependant required for the materialisation of the demographic dividend, or demographic gift, by 2026. By 2043, the ratio of the working-age population to dependants will be 2.0-to-1, far above the average for its income peers of 1.56-to-1. The Demographics and Health scenario will push the ratio further such that by 2043, the ratio of the working-age population to dependants will be 2.4-to-1 in the scenario with positive effects on productivity and economic growth.
Chart 14 presents crop production and demand in the Current Path from 1990 to 2043.
The Agriculture scenario envisions an agricultural revolution that ensures food security through ambitious yet feasible increases in yields per hectare, thanks to improved management, seed, fertiliser technology, and expanded irrigation and equipped land. Efforts to reduce food loss and waste are emphasised, with increased calorie consumption as an indicator of self-sufficiency and prioritising it over food exports. Additionally, enhanced forest protection signifies a commitment to sustainable land use practices.
Visit the theme on Agriculture for our conceptualisation and details on the scenario structure and interventions.
The agricultural sector provides employment to about 28% of the population, 45% of women and 55% of people in Upper Egypt. The Nile’s predictability and Egypt’s fertile soil have allowed the country to build significant agricultural wealth over the years. Egypt’s agricultural land is estimated to be about 360 km2, representing only about 3.9% of the country’s total land area. The area of cultivated land per person is only about 0.05 hectare, one of the lowest globally. Most of that is located in a narrow strip along the Nile Delta and ‘new lands’ reclaimed from the desert after the construction of the Aswan Dam.
The major challenges facing the future of agriculture in Egypt include scanty rainfall, loss of agricultural land to urbanisation and the impact of Egypt’s dispute with Ethiopia on the Nile water upon which it relies for irrigation. There are also climatic factors, such as flood arising from the Nile River Delta, which constrain agricultural production. High production and consumption losses is further straining the sector. A 2015 study reported that out of the respondents surveyed, only about 14% indicated that they did not throw away food and that food waste increased during the fasting month of Ramadan.
In 1990, Egypt’s average crop yield of 17.4 metric tons per hectare was fourth highest in Africa and the highest among its income-group peers in Africa. By 2023, the average crop yield per hectare of 27.4 metric tons in Egypt was third highest in Africa after Mauritius and Eswatini and the highest among the lower-middle-income countries in Africa. This means that compared to its income-group peers, Egypt has been able to adopt improved technology and mechanised agriculture that significantly increased its yield per hectare. The country has leveraged on the Nile river to develop an irrigation system for large-scale mechanised agriculture. On the Current Path, yield per hectare will rise to 31.3 metric tons per hectare by 2043, which will be more than six times the average of lower-middle-income African countries. Sustaining Egypt’s agricultural yields will prove challenging in the face of increased population growth, controversy about the Nile water and limited and declining agricultural land.
Total agriculture production in 1990 stood at about 45 million metric tons. Of this, 41.9 million metric tons, representing 92.1%, were crops, with the remainder constituting meat production. By 2023, total agricultural production in Egypt had grown to 111.2 million metric tons. Of this, crop production constituted 89.7%, equivalent to 99.7 million metric tons, meat production 8.3%, and fish production constituted the remainder of the total production.
Egypt faces huge crop loss and waste estimated at 19.3% of total production. This is largely due to post-harvest losses for crops, estimated at 7.5% of production, and transmission losses for crops, at 8.5.%. Such losses can be a result of pest and disease infections, spoilage and the lack of adequate and effective storage facilities. Fish and meat also witnessed loss and waste accounting for 29.7% and 20% of total production respectively.
There are efforts to improve agriculture production in the country. The Government is on a drive to reclaim more land for agriculture with a target of an additional 150 000 acres (60 000 hectares) per year. The government is also taking initiatives to boost domestic production and promote sustainable and green farming. Despite these efforts, much more needs to be done to make the agricultural system more efficient and better geared towards policies that incentivise farmers to focus on food products for which Egypt has a comparative advantage.
In terms of demand, the total demand for agricultural products in Egypt has always been more than the total production. Total demand stood at about 55.3 million metric tons in 1990, of which 50.7 million metric tons, equivalent to 92% of total demand, were for crops. The remaining demand was for meat (4.1 million tons) and for fish (510 000 tons). Since then, domestic demand has rapidly outgrown production, and by 2023, agricultural demand exceeded domestic production by 23.5 million metric tons, despite the increase in production. Of the total demand of 134.7 million tons, 90.1% is for crops (122 million tons). The remaining demand is for meat (9.8 million tons) and for fish (2.9 million tons). Despite the increase in domestic production, reaching 136.5 million metric tons in 2043, it will not be enough to meet domestic demand that will rapidly grow to 189.2 million metric tons. As a result, excess demand for agricultural products will reach 52.7 million by 2043. This indicates that Egypt faces the risk of food shortages in the future if drastic measures are not taken to revamp the agriculture sector to increase domestic production.
With total agricultural demand outgrowing domestic production, Egypt will have to rely on imports to meet its domestic demand. In 2023, Egypt’s net import of crops stood at 19% of total crop demand, which was more than the average of 13.4% for lower-middle-income countries in Africa. Also, net import of fish stood at 39% of total fish demand, while net import of meat was estimated at just 1% of total meat demand. Commodities such as wheat, lentils, red meat, sugar and oils are mostly imported as domestic demand outstrips local production capacity. For instance, in 2019, Egypt imported US$4.67 billion in wheat, becoming the 1st-largest importer of wheat globally. However, Egypt is food-sufficient when it comes to commodities like rice, fruits, vegetables, poultry and dairy products.
In light of its huge population, shrinking agricultural land, water scarcity and other effects of climate change, Egypt remains food insecure and vulnerable to international price shocks and disruptions in supply chains. In the Current Path, net crop imports will grow in Egypt to 30.1% of total crop demand by 2043. This suggests a growing level of national food insecurity; however, it can also be as a result of changes in dietary preferences. Greater import dependence makes Egypt more vulnerable to international price shocks and accompanying risks of disruptions in the global supply chains as seen during COVID-19. Thus, while Egypt has increased agricultural production, the sector needs major reform to focus and incentivise production of goods like vegetables and fruits in which Egypt has a comparative advantage.
Chart 15 presents the import dependence in the Current Path and the Agriculture scenario, from 2019 to 2043.
In the Agriculture scenario, yield per hectare will increase to 33 metric tons by 2043 — a 5.4% improvement compared to the Current Path and over five times the average of lower-middle-income countries in Africa. The improvement in yields will lead to an improvement in total agricultural production. By 2043, in the Agriculture scenario, total production will increase to 143.8 million tons, almost 7.2 million metric tons, or 5.3%, more than the Current Path by 2043. Annual crop production in Egypt will rise by 6.4% over the Current Path to 115.1 million tons in the Agriculture scenario by 2043. The increases in crop production in the Agriculture scenario reduces the import dependency of crops in the country compared to the Current Path. By 2043, net import of crops will reach 24.4% in the Agriculture scenario — 6 percentage points less than Current Path and the average of its income-group peers in Africa.
Chart 16 depicts the progress through the educational system in the Current Path for 2019 to 2043.
The Education scenario represents reasonable but ambitious improved intake, transition and graduation rates from primary to tertiary levels and better quality of education at primary and secondary levels. It also models substantive progress towards gender parity at all levels, additional vocational training at the secondary school level and increases in the share of science and engineering graduates.
Visit the theme on Education for our conceptualisation and details on the scenario structure and interventions.
The public education system in Egypt consists of four stages of learning. The basic and compulsory education stage for children between four and 14 years comprises kindergarten for two years followed by primary school for six years and preparatory school (ISCED Level 2) for three years. Then, the secondary school (ISCED Level 3) stage is for three years, for ages 14/15 to 17, followed by the tertiary level. After independence Egypt introduced many educational initiatives and reforms, and the education system has made significant strides with improved educational outcomes in recent decades. The literacy rate stood at approximately 74% in 2020, while the number of elementary-age out-of-school children has dropped after rapid increases following the 2011 revolution.
Despite many initiatives, including compulsory education, the sector still faces numerous challenges. Key among these is Egypt’s rapid population growth, whose ramifications have been borne in the education sector through sharp increases and demand for enrolment both at primary and secondary level. This means greater funding requirements, capacity shortages and overcrowded learning facilities, particularly in denser regions like Cairo, Alexandria and Giza. Although the teacher-student ratio has risen in the past few years, teacher salaries have fallen. In 2017, the average teacher salary was about £86 000 (US$4 800). This is just 1.3 times the average GDP per capita of Egypt and way below the World Bank recommended average teacher salary of 3 to 3.5 times the GDP per capita for a productive education system. Due to the inadequacy of the education system, many skilled teachers have turned to private tutoring, which pays better than the public education system. An estimated 42% of household income is spent on after-school tutoring, but some learners drop out of school because they cannot afford to sustainably access supplementary tutoring.
In 2023, Egypt spent US$12.5 billion on its education system — this amount is equivalent to 3.8% of the country’s GDP. At this rate, Egypt’s spending on education was below the average of 4.5% for lower-middle-income countries in Africa. On the Current Path, Egypt’s total expenditure on education will reach US$31.1 billion, constituting 3.8% of GDP, by 2043. About 35.3 of spending on education in Egypt is on the tertiary level making it the largest educational expenditure in the country. This departs from the trend observed in most African countries where much of the spending is done at the primary or lower secondary level. The high spending at the tertiary levels is partly explained by the high cost of training students at the tertiary especially in the sciences and engineering compared to other levels. On average, it costs US$1 365 to educate a student at tertiary level. This is almost 3 times what was spent on upper secondary students, 4.6 times the cost of educating a child at the lower secondary level and 5.2 times more than what it costs to educate a primary level student. Nonetheless, spending at the primary level constitutes 33.2% while spending on lower and upper secondary levels constitute 16.1% and 15.9% respectively.
The education system can be viewed as a long funnel where children enter at the primary level and exit after completing tertiary-level education. Many children that enter the system at the wide mouth of the funnel, but few complete the entire journey — from primary to secondary school and then university — to eventually graduate with a tertiary or equivalent education at the other end. However, the education funnel in Egypt largely mirrors that of a developed country with less leakages and cracks along the way. In 2023, the gross enrolment rate for primary school students in Egypt was 104.2%, an increase from 91.0% in 1990 higher than the average of 101% of lower-middle-income countries in Africa. Comparing this to the net enrolment rate of almost 99.6% in the same period leads to two important conclusions. Firstly, almost all children in Egypt who are of school-going age are in school. Secondly, many classrooms in Egypt are likely to be filled by children of the appropriate age group compared to most other African countries where classrooms are crowded by older students. On the Current Path, Egypt's gross and net enrolment rates will be the same, reaching 100% by 2043.
The gross primary completion rate stood at almost 100% in 2023, indicating that almost all children who enrolled in primary school completed the last grade in Egypt which departed from the trend in most low- and lower-middle-income countries in Africa that usually have high dropout rates. On the Current Path, Egypts progress in ensuring more children complete primary school will be maintained throughout the forecast period such that by 2043, almost every primary school student will complete the last grade. This progress in Egypt mirrors that of a developed country and advanced educational system where access at the basic level is universal and an older population that is highly educated. Of those who complete primary level education, some will transition immediately to the lower secondary level, some will enrol in the lower secondary level after some years out of school and some will never enter the lower secondary level, and so on through the upper secondary and tertiary levels.
In Egypt, more students transition from primary level to lower-secondary level than they do from lower secondary level to upper-secondary level. In both cases, the rates are higher than Egypt's income-group peers in Africa: gross enrolment for lower- and upper-secondary levels in the country stood at 93.1% and 72.4%, respectively, in 2023. These rates are far above the averages of 71% and 45.9% for its income peers. The high enrolment rates at the primary and secondary levels is due to Egypt’s free and compulsory education for children between ages 6 to 15 years. However, this put pressure on teaching and learning materials particularly in densely populated areas such as Cairo, Alexandria and Giza. As a result, about 30% of school children particularly in the rural areas lack learning materials.
By 2043, gross enrolment for the lower-secondary level will rise to 95.6%, while that of the upper-secondary level will rise to 82.3%. In 2023, completion rates stood at 81.9% in the lower-secondary level while that of upper-secondary level was 69.2%. Although these rates are far above the average for its income peers in Africa (53.2% for lower-secondary and 35.8% for upper-secondary), it is an indication of a contraction in the educational funnel in Egypt. By 2043, 90.9% of students will complete their lower-secondary education compared to 77.7% in upper-secondary level.
At tertiary level, the situation is less rosy. In its effort to expand capacity in the tertiary sector, Egypt has successfully sought to establish itself as a major higher learning destination. It has attracted many foreign learners from the MENA region and sub-Saharan Africa mainly due to its low tuition and living expenses, scholarships, free admission of non-citizens and international partnerships. The country also hosts many reputable international universities like the American University in Cairo, the German University in Cairo, the British University in Egypt, and the Université Française d’Egypte. Furthermore, in 2018, Egypt enacted legislation to attract more international universities to establish their foreign branches in the country with more streamlined licensing procedures, affordable real estate, tax breaks and requirements to teach the same programmes as in their home countries. These policies are meant to enhance the global competitiveness of Egypt’s education system, increase capacity and intake, enhance performance of domestic universities by increasing competition, foster research collaboration and inbound student mobility, and ultimately improve the stock of human capital in the country.
Despite these efforts, enrolments in the tertiary level remain low. In 2023, only 34.4% of people within the age group were enrolled in tertiary institutions in Egypt, and this will only improve to about 41.4% by 2043 on the Current Path. Although this is low, it is almost twice the average rate for lower-middle-income countries in Africa of 18%. About 31% of the relevant age group in Egypt graduated from a tertiary institution with at least a first degree in 2023 and will slightly rise to 35.4% by 2043. This is nearly three times the average rate in lower-middle-income countries although the gap between Egypt and its income peers will close over the forecast period.
Egypt has done well to eliminate the gender gap in access to education Unlike its income peers, there is no gender inequality in access at the primary level as the ratio of females to males enrolment and completion are 100% in Egypt and forecast to continue on the Current Path even by 2043. At secondary level, there were 98 females enrolled in lower-secondary schools for every 100 males in Egypt, as opposed to the average of 95 females for every 100 males in lower-middle-income Africa. At the upper-secondary level, there were 96 females for every 100 males in Egypt, almost at par with the average of lower-middle-income African countries in 2023. However, the ratio is lower when it comes to completion. In 2023, there were 89 and 98 females who completed in lower- and upper-secondary schools respectively for every 100 males in Egypt. At tertiary level, the gap is closed as it reaches parity with the ratio of females to male students almost similar to the average of its income group in Africa.
Vocational training has always been a large part of Egypt’s education system. Under Mubarak, one of the best-known schemes — originally called the Mubarak-Kohl Initiative, now known as the dual system — was launched in 1994 by the Ministry of Education and the Deutsche Gesellschaft für Internationale Zusammenarbeit to promote technical training. Since 2015, other technical and vocational education and training (TVET) schemes such as the ‘Integrated TVET scheme’ and ‘Life-long learning’ (Oumal System) have been rolled out by the government, with a strong emphasis on apprenticeship. Although these efforts have scaled up TVET programmes, increased training opportunities are still needed in Egypt. The government envisions a 50% increase in the dual education system in all schools by 2025. This would be a huge increase in the number of trainees undergoing TVET training.
Enrolments in vocational training and science and engineering education, which are considered crucial to the future of work, are quite encouraging. In 2023, about 46.8% of upper-secondary school students were enrolled in vocational training programmes in Egypt. This is more than three times the average for lower-middle-income countries in Africa and the second highest in the group, only below the rates in Angola. On the Current Path, this trend will continue even by 2043. However, the engineering and science education at the tertiary level is relatively low in Egypt. In 2023, 11% of tertiary graduates in Egypt enrolled in science and engineering programmes. This was below the average of 16.6% for lower-middle-income countries in Africa. However, on the Current Path, Egypt will close this gap so that by 2043, its rate of 19.2% will almost be at par with the 19.5% average for its income peers in Africa.
Beyond the limited access to education in the country, there are also problems with the quality of education. Educational outcomes are generally good, but bottlenecks have emerged at secondary and higher education levels. The country has a 0.49 score (the index ranges between 0 and 1) in the Human Capital Index of 2020 — a score slightly lower than the Middle East and North Africa’s average at 0.51 and slightly higher than that of sub-Saharan Africa (0.40).
In 2023, the average test score for primary and secondary students in Egypt stood at 38 and 43.5 out of 100, respectively. Both the primary and secondary test score for Egypt was above the average of 33.3 and 41.8 for its income-group peers in Africa respectively. Although Egypt performs relatively well at primary and upper-secondary levels, tertiary outcomes are quite poor relative to the comparison countries and groups. As a result, the World Economic Forum’s Global Competitiveness Report for 2017/18 ranked Egypt’s quality of primary education at position 133 out of 137 countries — only two positions ahead of war-ravaged Yemen. The number and availability of qualified teachers and desire for teacher training and deployment into public schools is dropping and will continue to do so if the issue of teacher remuneration is not addressed.
Chart 17 presents the mean years of education in the Current Path and in the Education scenario, from 2019 to 2043, for the 15 to 24 age group.
The average years of education in the adult population (aged 15 years and older) is a good first indicator of the stock of knowledge in society.
In 2023, the mean years of education attained by adults between 15 and 24 years in Egypt stood at 8.8 years — below the average of 7.8 years for lower-middle-income countries on the continent. In the Current Path, the average Egyptian between the ages of 15 and 24 years will have received 8.5 years of education by 2043. On average, females received 0.4 years more schooling than males and forecast to remain till 2043. In the Education scenario, the mean years of adult education in Egypt will increase to 9.5 by 2043, 0.5 years more than the Current Path and higher than the average for lower-middle-income countries in Africa. The interventions in the Education scenario also close the gender gap in educational attainment in Egypt.
The Education scenario further increases average test scores for primary students in the Education scenario to 46.1 in 2043, which is 17.1% more than in the Current Path and 31.6% above the average of lower-middle-income countries in Africa in the same year. By 2043, the average test scores for secondary students in Egypt will rise to 51.8% — this is 15.8% higher than the Current Path and the average of lower-middle-income countries in Africa. It means that the Education scenario has the potential to improve the quality of education (reflected in the test scores) in Egypt above that of its income-group peers in Africa.
Chart 18 presents the share of GDP in the Current Path from 2019 to 2043.
In the Manufacturing scenario, reasonable but ambitious growth in manufacturing is envisaged through increased investment in the sector, research and development (R&D), and improved government regulation of businesses. This aims to enhance total labour participation rates, particularly among females where appropriate and is accompanied by increased welfare transfers to unskilled workers to mitigate the initial rises in inequality typically associated with a low-end manufacturing transition.
Visit the theme on Manufacturing for our conceptualisation and details on the scenario structure and interventions.
The manufacturing sector in Egypt is one of the largest in Africa both relating to GDP and per capita terms. In 2019, the manufacturing sector employs about 12% total employment in the country. In the 1950s and 1960s, Egypt embarked on an import substitution industrialisation strategy. This has produced many of its industries that are in existence today. The government plays a significant role in the national industrialization agenda with state-owned enterprises accounting for 9%. Egypt is the largest producer of steel in Africa and ranks 21st globally with 7.8 million metric tons produced in 2019. Egypt also boasts a growing automobile industry that was ranked 49th globally in 2017 although it produces 16 times fewer cars than South Africa. However, low and medium-technology accounts for 50% of domestic manufacturing value added. For instance, its textiles industry which originates from the 1950s accounts for 20% of employment in the country.
In recent years, the performance of the sector has not been the best. Although Egypt was ranked 62nd globally on the SDG-9 Industry Index in 2000, by 2017 the country has declined to 71st position while other countries such as Morocco and Tunisia in the region have been improving. Efforts by the government to reverse this trend include simplified business registration procedures, industrial licensing and land allocation which create an enabling environment for businesses especially micro, small and medium scale enterprises (MSME) to thrive. However, factors such as limited access to knowledge and capital, inadequate skilled workforce and unfavourable trade policies still impede the growth of MSMEs.
The three largest contributors to GDP in Egypt are the service, manufacturing and agriculture sectors. In 2023, the service sector in Egypt contributed US$161.7 billion to the economy, equivalent to 49.3% of GDP. The service sector employs nearly half of the population and is dominated by telecommunications and tourism. In fact, tourism alone accounts for 15% of GDP and employs 15% of the total workforce. Due to the COVID-19, the tourism sector declined with reductions of up to 54.9% in travel receipts between January and June 2020, and upwards of US$7.7 billion in 2020 although now bounced back. This is followed by the contribution of the manufacturing sector valued at US$72.5 billion, equivalent to about 22.1% of GDP.
Manufacturing production ranges from refined petroleum, food and beverages, textiles, chemicals and engineering products such as transport equipment, electronics and electrical, basic metals, fabricated metals and machinery. Although Egypt has a relatively higher share of medium and high-tech industries above the average of Africa, it is significantly below that of its regional comparator Morocco. The Agriculture sector, contributed US$41.7 billion, representing 12.7% of GDP in 2023. In the same period, the information and communications (ICT) sector contributed US$27.0 billion, constituting 8.2% of GDP, while the contributions of the energy and materials sectors were valued at US$19.7 billion (6% of GDP) and US$4.6 billion (1.4% of GDP), respectively.
On the Current Path, the service sector will extend its dominance in the economy with its contribution to GDP to more than double in size to US$446.8 billion by 2043 (54.1% of GDP). By 2043, the manufacturing sector will still be the second-largest contributor and will be valued at US$200.0 billion (24.2% of GDP). The ICT sector in Egypt will overtake the agriculture sector by 2043 as the third-largest sector valued at 68.9 US$ billion. At this rate, the contribution of ICT to GDP will be about 1.5 percentage points larger than agriculture at US$54.2 billion. The energy and material sectors’ contributions in 2043 will be valued at US$42.6 billion and US$15.1 billion, corresponding to 5.2% and 1.8% of GDP, respectively.
A critical goal in Egypt’s Vision 2030 Sustainable Development Strategy is to become a knowledge-based market economy and increase the share of high-technology exports in total manufacturing. Achieving this requires eliminating barriers that impede Egypt’s transition to high technology manufacturing as discussed above.
Typically when countries embark on a manufacturing transition, inequality and poverty may initially increase. This is because resources and investments are diverted to more capital and knowledge-intensive sectors, which leads to an initial crunch in consumption. However, in the long term, these efforts stimulate inclusive growth with a greater impact on poverty and inequality reduction. Policies aimed at industrialisation, therefore, need to be accompanied by measures to mitigate these initial adverse effects. These could include efforts to directly support extremely poor families through social programmes or welfare spending to cushion vulnerable people.
Welfare transfers in Egypt are very low compared to its income-group peers on the continent. Since 2015, as part of its welfare transfer, the Egyptian government has made allocations for subsidies, grants and social benefits to poor households through its conditional cash transfer programmes, Takaful and Karama. In the first part of the 2020/21 fiscal year alone, the budget on food subsidies, grants and social benefits amounted to £100 billion. In 2023, the total welfare transfers to unskilled households in Egypt amounted to US$19.3 billion equivalent to 10.1% of GDP, above the average for lower-middle-income African countries. On the Current Path, government welfare transfers to households will increase to about US$44.1 although this will represent 9.4% of GDP by 2043. Despite this decline, it will still be slightly above the average of 7% of GDP for Egypt's income-group peers in Africa.
Chart 19 presents the contribution of the manufacturing sector to GDP in the Current Path and in the Manufacturing scenario, from 2019 to 2023. The data is in US$ and % of GDP.
In the Manufacturing scenario, Egypt makes substantial progress in industrialisation such that, by 2043, the share of the manufacturing sector in GDP is about 27.8% equivalent to US$256.4 billion. This will be about 3.5 percentage points of GDP above the Current Path valued at US$56.4 billion. However, industrialisation is a difficult and long-term process. It requires constructive relationships between the state, which provides encouragement and support, and the private sector. Firms need a state with strong capabilities in setting an overall economic vision and strategy, efficiently providing supportive infrastructure and services, and maintaining a regulatory environment conducive to entrepreneurial activity. Additionally, firms need a state that makes it easier to acquire new technology and enter new economic activities and markets.
Chart 20 depicts exports and imports as a percentage of GDP, from 2000 to 2043, in the Current Path and in the AfCFTA scenario.
The AfCFTA scenario represents the impact of fully implementing the African Continental Free Trade Agreement by 2034. The scenario increases exports in manufacturing, agriculture, services, ICT, materials and energy exports. It also includes improved multifactor productivity growth from trade and reduced tariffs for all sectors.
Visit the theme on AfCFTA for our conceptualisation and details on the scenario structure and interventions.
In 1990, the sum of Egypt’s exports and imports stood at 52.9% of GDP, which was above the average of 48.3% for lower-middle-income countries in Africa. However, since 2009 , Egypt’s economy has become less open to trade compared to its income peers in Africa. By 2023, trade openness declined to 34.1% of GDP compared to the 43.7% average for lower-middle-income African countries. On the Current Path, this trend will continue as the sum of Egypt’s export and imports slightly increase to 37.2% of GDP as compared to average of 50.5% for its income peers in Africa.
Over the years, Egypt has made efforts to improve its trade. The country has signed the Tripartite Free Trade Area (TFTA) that seeks to facilitate movement of goods (largely on a tariff framework) among the signatory country territories. The TFTA essentially integrated three existing African trading blocs — the East African Community, the Southern African Development Community and the Common Market for Eastern and Southern Africa. This deal would harmonise trade in the three regions and eliminate overlapping trade rules to reduce the cost of doing business. In addition, the country has also ratified its membership to the African Continental Free Trade Area (AfCFTA) agreement, and this trade agreement would allow and facilitate the entry of Egyptian goods into the sub-Saharan market. In recent years, the country has entered a trilateral cooperation with Jordan and Iraq to improve the mobilisation of resources and the implementation of practical programmes in the areas of common challenges, especially on climate change, food security and livelihoods.
However, Egypt trades very little with the North Africa and Maghreb bloc, as well as sub-Saharan Africa. Currently, the country’s trade with Africa constitutes just about 3% of its total trade volume, although the continent has a large market size. Indeed its top trading partners are the United States (US), United Arab Emirates (UAE), Saudi Arabia, Italy, Turkey, China, Russia and Germany. Other obstacles to trade and investment in the country include bureaucratic hindrances, corruption, non-tariff barriers, inadequate skilled labour and low access to credit.
In 1990, the total export volume in Egypt stood at US$16.3 billion, constituting 20.4% of GDP, below the average of 23.5% for its income-group peers. Since then, exports from Egypt have grown rapidly. By 2023, Mali’s exports stood at US$43.5 billion, equivalent to 13.3% of GDP, still below the average of 19.2% for lower-middle-income African countries. Its major exports include petroleum, crude petroleum, gold and nitrogen fertilisers mostly to Turkey, Italy, Spain, United States of America and India. On the Current Path, total exports in Egypt will reach 16.8% of GDP, equivalent to US$139 billion, in 2043, lower than the 23.3% average of its income-group peers in Africa.
In terms of imports, Egypt’s total imports grew from US$26 billion, equivalent to 32.6% of GDP in 1990 to US$68.2 billion, representing 20.8% of GDP, in 2019. At that rate, total imports as a proportion of GDP in Egypt were lower than the estimated average of 24.5% for lower-middle-income African countries in the same year. The country imports large volumes of refined petroleum, crude petroleum and wheat. Indeed in 2022, Egypt was the biggest importer of wheat globally. Other top imports of the country are petroleum gas, cars and packaged medicaments. Imports to Egypt are sourced mainly from China, United States of America, United Arab Emirates and Turkey. On the Current Path, Egypt’s import as a proportion of GDP will stagnate around the same figure so that by 2043 it will be 20.4% equivalent to US$169.2 billion and below the 27.2% average for its income peers.
Chart 21 presents the trade balance in the Current Path and in the AfCFTA scenario from 2019 to 2043 as a percentage of GDP.
The high import volumes coupled with its low export volumes leads to a chronic deficit in Egypt's trade balance. Like most African countries, it imports large volumes of mostly finished or processed goods. Its export quantities are small, and most of it is raw materials, with little or no value addition occurring within the country. This results in low export revenues and higher import expenditures. Egypt’s trade deficit in 2023 constituted 7.5% of GDP, an improvement from the 12% it recorded in 1990. However, it was above the average of 5.2% for lower-middle-income African countries.
By 2043, Egypt’s trade deficit in the Current Path will constitute about 3.7% of GDP, whereas, in the same year, the AfCFTA scenario will mitigate this situation leading to a slightly lower deficit of 2.6% of GDP. This is also below the average of 3.9 for its income peers in Africa. In the AfCFTA scenario, the sum of Egypt’s exports and imports as a percentage of GDP will reach 43.1% by 2043. This will be about 5.9 percentage points above the Current Path but 7.4 percentage points below the average of lower-middle-income African countries.
These figures suggest that Egypt stands to benefit from the full implementation of the AfCFTA, which will improve competitiveness, particularly in growing the country’s manufacturing sector.
Chart 22 presents the Current Path of access to electricity for the urban, rural and total population from 2000 to 2043.
The Large Infrastructure and Leapfrogging scenario involves ambitious investments in road and renewable energy infrastructure, improved electricity access and accelerated broadband connectivity. It emphasises adopting modern technologies to enhance government efficiency and the rapid formalisation of the informal sector, incorporating significant investments in major infrastructure projects like rail, ports, and airports while highlighting the positive impacts of renewables and ICT.
Visit the themes on Large Infrastructure and Leapfrogging for our conceptualisation and details on the scenario structure and interventions.
Modern infrastructure can improve productivity, augment healthy lifestyles, boost educational outcomes and facilitate government effectiveness. This study focuses on both physical and digital infrastructure, including roads, electricity access and ICT. Physical infrastructure, such as roads and railways, is a critical driver of economic growth and an important component of development. It facilitates the movement of people, goods and services, promotes intra-country trade and serves as an enabler of social service provision such as education and health.
According to the Africa Infrastructure Development Index (AIDI) of 2022, Egypt (with a score of 89.9) ranked second after Seychelles (96.73) in infrastructure development. AIDI consists of four composite indicators — transport, electricity, ICT and water supply and sanitation needs. Although Egypt has made significant strides in improving the quality and quantity of basic infrastructure, the country’s infrastructure stock is limited and aged. The sector also faces low levels of investment. An Organisation for Economic Co-operation and Development report estimates that for the country to meet its investment gap, it would need to dedicate about 5% of GDP to this sector until 2040 to adequately improve its infrastructure connectivity. In light of rapid population growth and the accompanying demand, infrastructure development is an essential and critical aspect to enhancing productivity and sustainable long-term growth in Egypt.
Improved road transport will yield a range of economic benefits for Egypt. Recognising these potential benefits to expanded road transport, the government has made efforts through the National Roads Project launched in 2014 with the goal of improving transport infrastructure and creating a more modern Egypt. Since then, 4 800 km of the planned new roads have been constructed leaving 1 400 km that are currently being built. In addition, out of the existing 9 000 km of roads that needed improvement, 5 000 km have already been upgraded. The Nile River and Suez Canal are Egypt’s major transportation arteries, while the Suez Canal and Sumed Pipeline are important routes for Persian Gulf oil shipments. For instance, almost 10% of global trade, and 40% of European trade with the East, passes through the Suez Canal. By 2023, the total length of roads in Egypt has increased significantly from 64 000 km in 2000 to 160 352 km. Out of this, a whopping 155 330 km equivalent to 96.9% was paved — this is more than twice the average rate (43.7%) for lower-middle-income countries in Africa.
Beyond these, the government is undertaking major upgrades to highways, like the one connecting Cairo with the major Port of Alexandria, and the construction of a new tunnel link under the Suez Canal. International connections include the highway linking Egypt with its North African neighbours, as well as the highway running north-south via Asyut, Sohag, Luxor and Aswan to the border with Sudan. The Ministry of Transportation is also planning to establish a network of logistical areas and villages in Damietta, Sohag, 10th of Ramadan, Borg El Arab, Sadat and Beni Suef to promote industry and trade, increase investments and reduce logistical costs. Furthermore, the new road constructions and upgrades will reduce congestion given Egypt’s fast-growing population, and together with new traffic rules, reduce traffic accidents. This will over time improve the human capital contribution to growth. On the Current Path, by 2043, the total road network in Egypt will increase to 287 770 km. By this time, all roads in Egypt will be paved roads which will be far above the 65.4% paved roads average for its income peers in Africa.
Owing to increasing electricity demand estimated at an average annual rate of 7%, Egypt has nearly tripled its installed capacity from 15 GW in 2000 to 42 GW by 2017. But even this increase has been insufficient to meet the high and rising demand to end electricity shortages in the country. Of the 42 GW installed capacity, 91% consists of fossil fuel-based technologies and approximately 8.6% are renewable energy technologies, 77% of which is hydropower. The country has largely developed all its major hydropower sites with little potential to expand further.
Nonetheless, Egypt has a relatively diverse energy mix and has seen significant investment in the sector, particularly after the 2011 revolution that saw increased generation capacity. In 2018, three new power plants came online to contribute an additional 14.4 GW to the country’s power supply. In mid-2018, the government signed a deal to construct the Hamrawein coal-fuelled power plant expected to increase generation capacity by 6 GW. Most recently, Egypt has started the construction of the El Dabaa Nuclear Power Plant in Matrouh Governorate on the Mediterranean coast. The power plant will generate a total capacity of 4.8 GW. The first unit was expected to be commissioned in 2026. In July 2021, Egypt announced the postponement of the completion of the project to 2030 following a row with Russia about the GERD. However by August the deal was back on and Russia started equipment production for the plant.
As a result of these significant investments in electricity generation, Egypt is one of the few countries in Africa that has attained universal access to electricity although supply is not reliable. As early as 2016, the country had been able to achieve a 100% access rate meaning that all people in Egypt irrespective of their location have access to electricity. This universal access rate has been maintained since then and forecast to remain even by 2043. At this rate, electricity access rate in Egypt far exceeds the average for its income peers in Africa estimated to be 69.5% and forecast to reach 82.4% by 2043.
Egypt is looking to be a regional source of electricity over the next nine years, and the country is on track to generate an exportable surplus estimated at 74 GW by 2035. Moreover, the total installed capacity will increase to 83 GW by 2025. Thermal power will remain the dominant source of electricity at 82% followed by solar, hydro and wind contributing between 4% and 6%. Nuclear power will be introduced in this period, adding 1.2 GW to the total installed capacity by 2025, and ramping up to 4.8 GW by 2030.
Due to falling costs for renewables, natural gas discoveries and environmental concerns over coal generation, the renewable energy sector will be the fastest growing energy segment between 2019 and 2028. Specifically, Egypt’s non-hydropower renewable energy will be the fastest-growing market in the region. In 2018, the country’s total installed capacity of renewables amounted to approximately 3.7 GW (2.8 GW of hydropower and 0.9 GW of solar and wind power). According to the Integrated Sustainable Energy Strategy (ISES) by 2035, the government has set the renewable energy target to account for 20% of the electricity mix by 2022 and 42% by 2035. Total installed capacity from renewables is currently expected to reach 8.5 GW by 2028 with an average growth rate of 22.1% year on year (from 2019 to 2028).
Aside from physical infrastructure, technological advancement is essential for economic growth. Technology improves productivity and reduces the transaction costs and bottlenecks associated with doing business. A dynamic ICT sector is vital for a country that wishes to benefit from the digital economy. Egypt’s government has long realised the benefit of ICT to its continued economic and social development and has over the years deregulated and liberalised the ICT sector while supporting multiple public and private entities. Egypt’s Vision 2030 and 2050 consists of an ICT strategy towards a Digital Egypt under the Ministry of Communications and Information Technology (MCIT), which among other things is meant to streamline government services. Some of the key priorities for Egypt in this sector include expanding ICT infrastructure, strengthening the regulatory framework and growing a pool of labour skilled in ICT. It also includes achieving transition to a knowledge-based economy, ensuring cyber security, supporting research and development, and promoting Egypt’s position at the regional and international levels in this sector. In 2020, the MCIT reported that Egypt’s ICT sector grew by 15.2%. The sector’s share of GDP rose to 4.4% (£108 billion) up from 3.8% (E93.5 billion) in 2019. The ICT sector exports also increased in 2020 to US$4.1 billion from US$3.6 billion in 2019, representing a 13% rise.
In 2023, the total number of fixed broadband subscriptions in the country was estimated at about 10.7 per 100 people — more than twice the average of 4.4 per 100 people in lower-middle-income Africa. In the Current Path, fixed broadband subscriptions will rise to 33.8 per 100 people by 2043, above the average of 22.7 subscriptions per 100 people for lower-middle-income African economies. In 2023, Egypt had a mobile broadband subscription rate of 77.8 per 100 people, higher than the average of 66.8 for lower-middle-income countries on the continent. On the Current Path, Egypt’s progress in mobile broadband subscription will be slower compared to the average for its income peers. By 2043, mobile broadband subscriptions will rise to 145.5 per 100 people — slightly below the average of 148.4 per 100 people for its income-group peers. In terms of Internet usage, 53% of Egyptians’ has access to the Internet and the average internet speed was 33.2 MB per second. This is higher than the average usage of 39.3% in lower-middle-income countries. On the Current Path, 43% of Egypt’s population will have access to the Internet, above the average rates of 31.4% for its income-group peers in Africa. Owing to increasing demand, Egypt will need to grow its ICT capacity and inject more investments to improve the quantity and quality of services to enable the country to transition to the modern economy it envisions.
Chart 23 presents the number of people using cookstoves in the Current Path and in the Large Infrastructure and Leapfrogging scenario, from 2019 to 2043.
A major consequence of improved access to electricity is to cause people to switch from using traditional cooking such as firewood and charcoal to modern stoves. Our modelling distinguishes between three types of cookstoves: traditional, improved and modern. Due to the universal electricity access rate in Egypt, all households in the country used modern stoves for cooking as of 2023. This trend is forecast to continue on the Current Path up to 2043. As a result of this saturation effect, the Infrastructure scenario had no effect as no intervention was done for Egypt in respect of cookstove use.
Chart 24 presents the percentage of the population and number of people with access to mobile and fixed broadband in the Current Path and in the Large Infrastructure and Leapfrogging scenario, from 2019 to 2043. The user can toggle between mobile and fixed broadband.
The Large Infrastructure and Leapfrogging scenario will lead to a larger increase in fixed broadband access, so that, by 2043, subscriptions will likely be at 50 per 100 people compared to 33.8 subscriptions on the Current Path. This will be more than twice the Current Path average of 22.7 for lower-middle-income African countries. Owing to the high performance in improving access to mobile broadband in the country, in the Current Path, reaching 145.5 subscriptions by 2043, the Large Infrastructure and Leapfrogging scenario has only a marginal impact to reach 146.0 subscription in the same period.
Chart 25 presents the trends in FDI, aid and remittances in the Current Path as a percentage of GDP, from 1990 to 2043.
The Financial Flows scenario represents a reasonable but ambitious increase in inward flows of worker remittances, aid to poor countries and an increase in the stock of foreign direct investment (FDI) and additional portfolio investment inflows. We reduce outward financial flows to emulate a reduction in illicit financial outflows.
Visit the theme on Financial Flows for our conceptualisation and details on the scenario structure and interventions.
Egypt is one of the leading destinations of FDI in Africa, most of which goes to the oil and gas sector, followed by financial services, manufacturing, real estate and construction. Between 2001 and 2019, Egypt’s net FDI inflows topped the continent and ranked third in comparison with other Arab countries. According to the UN Conference on Trade and Development (UNCTAD) 2024 World Investment Report, Egypt was the largest recipient of foreign direct investment (FDI) in Africa in 2023. Likewise, in the World Bank’s 2020 report on Ease of Doing Business, Egypt improved its rank to 114 (out of 190) from position 120 in 2019. These achievements are mainly due to the implementation of several reforms as part of measures to create an enabling business environment and ease of doing business to attract foreign direct investment. Beginning in 2016, the government, with the support of the IMF, floated the local currency, introduced a value-added tax system, and implemented various laws on investment, bankruptcy, and capital markets. In addition, the country has also embarked on fiscal and monetary policy reforms such as broadening the tax base to achieve macroeconomic stability and inspire investor confidence in the economy.
FDI inflows to Egypt, like most countries in Africa, are historically low. In 1990, the total FDI inflow to Egypt was equivalent to a paltry 1.7% of GDP, above the average of 0.6% of GDP for lower-middle-income countries in Africa. By 2023, FDI inflows to Egypt reached 3.8% of GDP above the average of 2.6% of GDP for lower-middle-income African countries. Most FDI goes to the oil and gas industry, although investments have been made in the non-oil economy as well as in telecommunication, consumer goods and real estate. In addition, Egypt has seen sizable foreign funding in major infrastructure projects. For example, Egypt’s first nuclear project was set at US$25 billion, with most funding sourced from Russia. Investors from other countries like the Gulf Cooperation Council states, Asia (mostly China) and Europe are also investing in projects ranging from rail to oil. On the Current Path, FDI inflows will rise steadily to 3.8% — above the Current Path average of 3.2% for its income peers on the continent by 2043. Egypt is trying to attract more FDI to other sectors like manufacturing to diversify and improve the value content of its exports and improve productivity and labour market outcomes, and thus avoid its recurring growth slowdowns
Typical of a developing economy, foreign aid to Egypt has significantly declined since 1990. In 1990, the total aid received by Egypt constituted 14.5% of GDP, compared to 6.5% received by other lower-middle-income African countries in the same period. By 2023, total aid as a percentage of GDP constituted a paltry 0.8%, equivalent to US$2.5 billion. This was less than half the average of 1.6% for other lower-middle-income countries in Africa. The main donor of foreign aid to Egypt over the years has been the US. For instance, in 2020, Egypt received a total of US$1.4 billion from the US, mainly from the U.S. Agency for International Development (USAID), Department of Agriculture and the U.S. Trade and Development Agency (USTDA). On the Current Path, foreign aid will decline further to negligible level of 0.01% of GDP, equivalent to US$92 million. This will be lower than the average of 0.8% of GDP for other lower-middle-income countries in Africa.
Remittances are the second largest source of income after labour income for Egyptian households. Historically, remittances in Egypt are high compared to its income-group peers in Africa. In 1990, Egypt received US$4.3 billion in remittances, constituting 5.3% of GDP, well above the average of 1.2% for lower-middle-income African countries. Since then, remittances to Egypt have grown rapidly. Indeed, between January and September 2020, Egyptian remittances increased by 11.6% compared to the previous year to reach US$22.1 billion based on figures from the Central Bank of Egypt. By 2023, total remittance constituted 6.7% of GDP equivalent to US$22 billion. At this rate, remittances to Egypt were almost twice the average rates for its income peers in Africa. This is not surprising given that Egypt is one of the leading labour exporting countries globally, and migrant remittances have been one of its main sources of external finance.
Most remittances are used for daily household consumption expenses which helps to alleviate poverty, improve the overall welfare of Egyptians. However, increased consumption can have a negative long-term impact on economic growth. As such, there is the need for the Government of Egypt to encourage its expatriate community to invest in the economy through the establishment of diaspora bonds, as done by countries such as Israel, India, Nigeria and Ethiopia.
On the Current Path, remittances to Egypt will increase to US$35.1 billion (4.3% of GDP), exceeding the average of 2.3% of GDP for lower-middle-income countries.
Chart 26 presents government revenue in the Current Path and in the Financial Flows scenario, from 2019 to 2043. The data is in US$ and % of GDP.
Wagner's law, or the law of increasing state activity, is the observation that public expenditure increases as national income rises. It is reasonable to expect that government revenues will increase as a per cent of GDP in the Financial Flows scenario compared to the Current Path.
Higher external inflows in the form of FDI, aid and remittances have increased government revenue. For instance, increased FDI means higher GDP growth, which in turn increases revenues accrued to the government through corporate and income taxes, royalties and indirectly through value-added tax. In 2023, the government’s total revenue in Egypt amounted to US$64.6 billion, equivalent to 19.7% of GDP — higher than the average of its income-group peers in Africa. Similarly, Egypt’s revenue without aid, estimated at 18.9% of GDP, is above the average of 9.7% for lower-income countries in Africa. This higher government revenue without aid reflect the strong state capacity in Egypt to mobilise revenue for development compared to its income peers in Africa.
In the Financial Flows scenario, government revenue will rise to US$210.0 billion in 2043, representing 24% of GDP above the average of 21.6% for lower-middle-income countries in Africa in the same year. Compared to the Current Path, the Financial Flows scenario will improve government revenue in Egypt by almost an additional US$11.3 billion by 2043.
Chart 27 presents the Current Path of government effectiveness comparing the country to the average for the Africa income group, from 2002 to 2043.
This scenario models the effect of better governance: more stability, capacity, and inclusion. It measures a state’s overall progress using the average of these three indices. To this end, it includes an index (0 to 1) for each dimension, with higher scores indicating improved outcomes.
Visit the theme on Governance for a full conceptualisation and details on the scenario structure and interventions.
Stability and better governance are generally prerequisites for other aspects of development as they ensure accountability, efficient allocation and distribution of state resources and encourage inflows of FDI. To emulate the sequential evolution of governance over time, our modelling draws on the establishment of nation states in the Westphalian tradition that first created a security community (through internal oppression and war with others), built capacity (largely through the collection of taxes and the establishment of a coercive social contract) and then, in time, became more inclusive and eventually, democratic. Traditionally, these transitions occurred sequentially with progress in one dimension providing a basis for the next.
The process of externally imposed state formation during colonialism in Africa did not follow this process. The result was that many African countries do not comprise a security community and have limited capacity. Yet, they are required to democratise without the fundamentals of sufficient security and capacity being in place.
The composite ‘governance triangle’ in IFs measures a state’s progress using the average of these three indices. To this end, it includes an index (0 to 1) for each dimension, with higher scores indicating improved outcomes.
Egypt’s performance on the governance security index is marginally better than that of its peers on the continent. Its score of 0.74 for 2023 was 3.7% higher than the average of 0.71 for lower-middle-income countries in Africa. For instance, the number of terrorist attacks has fallen from the 158 recorded in 2017 to 42 in 2021. Consequently, the number of victims from these attacks has also declined to 158 in 2021 instead of 695. Although in January 2023, the President declared that the country has won the fight against terrorism in Sinai, it is important that the underlying root causes of terrorism in the country are addressed in addition to the militarised approach. Additionally, in 2023/4 the Israel-Hamas conflict resulted in heightened geopolitical tensions in the region.
On the Current Path, Egypt’s score on the governance security index will reach 0.76 on par with average for lower-middle-income African countries, by 2043.
Regarding governance capacity, Egypt’s score in 2023 of 0.39 was 20.4% higher than the average of lower-middle-income Africa. The most important reason is that government revenue as a percentage of GDP for Egypt (without aid) was 18.9% of GDP, exceeding the average of 9.7% of GDP for its income group countries in Africa. On the Current Path, Egypt's progress on the governance capacity index will be better than the average for its income-group peers such that by 2043, its score of 0.48 will be 24.2% more than the average for lower-middle-income countries in Africa.
As defined by the World Bank, government effectiveness ‘captures perceptions of the quality of public services, the quality of the civil service and the degree of its independence from political pressures, the quality of policy formulation and implementation, and the credibility of the government’s commitment to such policies’. The country’s performance on the World Bank government effectiveness index is better than its peers historically. Egypt’s score of 2.2 in 2023 was 13% higher than the group average. On the Current Path, this trend will continue so that by 2043, Egypt's score on government effectiveness will be 10.9% higher than the group average for lower-middle-income countries in Africa.
When it comes to corruption, Egypt ranks 108th out of 180 countries with a score of 35 out of 100, according to Transparency International’s 2023 Corruption Perceptions Index.
While it has relatively high levels of security and capacity, Egypt’s performance on the Governance Inclusion Index is lower than its income-group peers in Africa. In 2023, Egypt scored 0.31 on the inclusion index, which was about 56% lower than its income-group peers on the continent rated at 0.48. Egypt’s democracy score on the Polity index ranks 21st out of the 24 lower-middle-income countries in Africa, only higher than Cameroon, Congo and Eswatini. Indeed, by 2043, Cameroon will overtake Egypt so that Egypt’s score by then will only be better than Congo and Estwatini. The level of trust in the government’s political and administrative system is low, and the government’s inability to deliver on major socio-economic issues for the population is slowly making its supporters passive and emboldening the stance of those opposed to the regime. Generally, there is no effective separation of powers and checks and balances in the country as the executive controls and influences most institutions.
The country also currently ranks 20th out of the 24 lower-middle-income countries on the economic freedom index by the Fraser Institute with its scores higher than only Angola, Congo, Zimbabwe and Algeria. By 2043, its score will deteriorate to 21st position being overtaken by Angola. In terms of gender empowerment, Egypt ranked 19th out of the 24 lower-middle-income countries on the UNDP gender empowerment index in 2023. In 2021, the country was ranked 129th out of the 156 countries on the Global Gender Gap Index. Women in Egypt, although highly educated, face limited economic opportunities. Currently, estimates show that women labour force participation stands at only 20% as opposed to 75% for men. On the Current Path, Egypt will still lag behind so that by 2043 the country’s score on the Governance Inclusion Index of 0.36 will still be 46.5% below the average of lower-middle-income countries in Africa. Egypt is significantly less democratic than expected given the level of education and income of its large population, and also suffers low levels of gender equity
Chart 28 presents the composite governance index for the Current Path versus the Governance scenario from 2019 to 2043.
Egypt’s score on the composite governance index of 0.48 in 2023 was 5.6% lower than the average for its income peers in Africa. This relatively lower score on this index is mainly due to its poor performance on the governance inclusion which consists of indicators such as democracy and gender empowerment. In the Governance scenario, Egypt's score on the composite governance index will improve to 0.60, which is about 12% above the Current Path by 2043 and about 7.4% above the Current Path average of lower-middle-income Africa in the same year.
Chart 29 presents GDP per capita in purchasing power parity (PPP) in the Current Path and each of the eight sectoral scenarios, plus the synergistic effect. The data is from 2019 to 2043.
The cumulative impact of better education, health, infrastructure, leapfrogging, etc. means an additional benefit that we refer to as the synergistic effect.
The scenario with the greatest impact on GDP per capita in Egypt by 2043 is the Manufacturing scenario followed by the Governance and the AfCFTA scenarios. In the Manufacturing scenario, Egypt’s GDP per capita will increase to US$18 580 by 2043. This is an increase of US$1 390 or 8.1% more than the Current Path. Manufacturing is generally a large engine of economic growth Thus, a robust manufacturing sector is crucial to achieve sustained growth and significantly improve the population’s living standard in Egypt.
In the Governance scenario, GDP per capita for Egypt will rise to US$18 400 by 2043, representing a 7.3% increase over the Current Path for that year. It means that the Governance scenario can raise GDP per capita in Egypt by an additional US$1 250 by 2043. Good governance in the form of adherence to the rule of law, reduced corruption, improved transparency and accountability and political stability can undoubtedly inspire investor confidence in the economy and attract more FDI into Egypt which is currently low in Egypt, can lead to growth.
In the AfCFTA scenario, Egypt’s GDP per capita (PPP) will increase to US$17 970 by 2043, which represents an increase of US$780 (or 4.5%) compared to the projections on the Current Path in the same year. A regional free trade area such as the AfCFTA increases trade openness, accelerating technology diffusions in the country and thereby improving productivity and innovation activities. This ultimately leads to welfare gains as resources flow to their most productive uses and lower consumer prices. It could also increase Egypt’s exports, as it provides access to a much larger market and improves the country’s manufacturing sector through competition. Thus, the AfCFTA scenario could lead to more rapid economic growth, increased employment in key sectors and reduce poverty.
Chart 30 presents poverty in the Current Path and for each scenario from 2019 to 2043. The user can select the number of extremely poor people or the percentage of the population.
In 2015, the World Bank adopted the measure of US$1.90 per person per day (in 2011 prices using GNI), also used to measure progress towards achieving SDG 1 of eradicating extreme poverty. In 2022, the World Bank updated the US$1.90 to US$2.15 in 2017 constant dollars. They are:
- US$3.20 for lower-middle-income countries, in 2017 values.
- US$5.50 for upper-middle-income countries, now US$6.85 in 2017 values.
- US$22.70 for high-income countries. The Bank has not yet announced the new poverty line in 2017 US$ prices for high-income countries.
The Manufacturing scenario has the greatest potential to reduce extreme poverty in Egypt. In this scenario, the number of poor people will decline to 7.7 million (equivalent to 5.4% of the population), compared to the Current Path of 12.5 million people (8.7%) by 2043. It means that an aggressive industrialisation that is supported by social protection measures such as welfare transfers has the potential to reduce extreme poverty in Egypt by an additional 4.8 million people.
The Governance scenario has the second-largest impact on poverty reduction in Egypt. In this scenario, 10.1 million people will live in extreme poverty by 2043, constituting 7% of the population. This will be 1.7 percentage points lower than the Current Path and equivalent to a reduction of about 2.3 million people living in extreme poverty. Certainly, better governance ensures that public resources are utilised in an efficient manner to address the needs of the people instead of being diverted into individual pockets, which will impact poverty reduction significantly.
The Education scenario has the third-largest impact on poverty reduction in Egypt. In the scenario, 10.8 million people (constituting 7.5% of the population) will live in extreme poverty by 2043. This will be 1.2 percentage points lower than the Current Path, and equivalent to a reduction of about 1.8 million people living in extreme poverty. Education is an important tool to reduce extreme poverty. Increasing access and quality of education equips people with the requisite skills to either start a business or acquire a job which increases their income and ultimately improves their living standards. A recent report by UNESCO confirms that if students in low-income countries have at least basic reading skills, 171 million people can escape extreme poverty.
Chart 31 presents GDP in the Current Path and in the Combined scenario, from 2019 to 2043. The data is in US$ 2017 and at market exchange rates (MER).
The Combined scenario consists of the combination of all eight sectoral scenarios, namely Governance, Demographics and Health, Education, Large Infrastructure and Leapfrogging, Agriculture, Manufacturing, AfCFTA and Financial Flows.
In the Combined scenario, Egypt’s GDP will rise to US$1.3 trillion. This will exceed the Current Path of US$825.7 billion, meaning that the Combined scenario will increase the size of the economy by an additional US$439.3 billion by 2043 — an increase of 53.2% compared to the Current Path.
Similarly, in the Combined scenario, GDP per capita for Egypt will increase to US$23 760 by 2043. This will be US$6 570 more than the US$17 190 on the Current Path, meaning that the materialisation of the Combined scenario could significantly improve the living standard of the Egyptian population. GDP per capita in this scenario will be almost three times the Current Path average of US$7 942 for lower-middle-income countries in Africa by 2043. The massive economic growth in the Combined scenario indicates that an integrated development push across development sectors is the best way to achieve sustained inclusive growth and development in Egypt.
Chart 32 presents the value added by sector in the Current Path and in the Combined scenario from 2019 to 2043. The data is in US$ 2017 and as a percentage of GDP.
By 2043, the service sector will still be the largest contributor to GDP at 53.6% (valued at US$678.1 billion), almost US$231.3 billion more than the Current Path of US$446.8 billion (representing 54.1%). The manufacturing sector will be the second-largest contributor to GDP in the scenario by 2043 with a share of 27.5% (equivalent to US$348.0 billion) — higher than the Current Path of 24.2% (US$200.0 billion). The manufacturing sector will contribute most, providing an additional US$148 billion. Although the share of the agriculture sector will decline to 4.9% it will increase in size to US$61.4 billion in the Combined scenario compared to 6.6% (valued at US$54.2 billion) in the Current Path in 2043. In the Combined scenario, the share of ICT and materials will rise above the Current Path to constitute 8.3%, and 2.0% of GDP respectively while the share of energy of 3.7% of GDP will be below the Current Path. However, in absolute terms each sector will experience an increase in size.
Chart 33 presents the size of the informal sector as a percentage of the total economy in the Current Path and in the Combined scenario, from 2019 to 2043.
Data on the contribution of the informal sector is often estimated and should be treated with care.
By 2043, the size of the informal sector in Egypt will decline to 9.6% of GDP valued at US$120.9 billion. At this rate, the contribution of the informal economy will be lower than the Current Path at 18.2% (valued at US$150.4 billion) and significantly below the average for lower-middle-income countries in Africa at 26.3%. Likewise, the size of the informal labour force in Egypt will decline. By 2043, the size of the informal labour sector will be about 5.3 million below the Current Path of 16.1 million. This constitutes 27.5% of the total labour force instead of 45.5% in the Current Path, reflecting the steady formalisation of the Egyptian economy that will also improve state capacity through more tax revenue.
Chart 34 compares life expectancy in the Current Path with the Combined scenario from 2019 to 2043.
Life expectancy measures the average lifespan of individuals in a country. In 2023, the average life expectancy at birth in Egypt was 71.5 years, which was about 1.5 years higher than the average for the country’s income-group peers in Africa. This stemmed from the country’s ability to reduce chronic malnutrition and communicable diseases. However, non-communicable diseases such as cardio-vascular-related illnesses, stroke, cancer, diabetes, and respiratory infections remain a problem in the country. Women in Egypt generally live 1.7 years longer (72.4 years) than men (70.6 years). On the Current Path, life expectancy will increase to 74.4 years by 2043, which will be higher than the average of 72.8 years for lower-middle-income African countries. In the Combined scenario, life expectancy will increase to about 75.9 years by 2043, which will be 1.5 years more than the country’s Current Path in the same year. In both the Combined scenario and the Current Path, women will live about 1.3 years longer than men by 2043.
Chart 35 compares the Gini coefficient in the Current Path with the Combined scenario from 2019 to 2043.
In 2023, Egypt’s Gini coefficient was 0.32 compared to the average of 0.39 of the lower-middle-income country in Africa. This makes Egypt the third least unequal country among the 24 lower-middle-income countries in Africa after Guinea and Algeria. However, studies have shown that the level of inequality in the country is probably underestimated and if left unaddressed could fuel social unrest and instability. This is particularly due to the size of Egypt’s rising youth bulge and limited opportunities. To reduce income inequality, the Government of Egypt has undertaken policies related to subsidies (in particular food subsidies), increasing the minimum wage and introducing progressive taxation. The Government has also pursued efforts to promote localised development in regions and inclusiveness in government opportunities.
On the Current Path, income inequality in Egypt will increase with a Gini coefficient of 0.34 by 2043. In the Combined scenario, inequality in Egypt will be slightly lower than the Current Path with a Gini coefficient of 0.31 by 2043. This means that economic growth in the Combined scenario will be broadly shared. The Manufacturing scenario has the greatest potential to reduce income inequality in Egypt followed by the Education and Agriculture scenarios.
Chart 36 compares carbon emissions in the Current Path with the Combined scenario from 2019 to 2043. Note that the data is in million tons of carbon, not CO2 equivalent.
Since carbon dioxide (CO2), carbon monoxide (CO) and methane (CH4) have different molecular weights, we use carbon. Many other sites and calculations use CO2 equivalent.
Compared to most African countries, Egypt has relatively higher levels of emissions. In 2023, Egypt released about 82 million tons of carbon from fossil fuel use, from the 21 million tons it recorded in 1990. This makes it the 2nd-largest emitter of carbon in Africa after South Africa and largest emitter among the 24 lower-middle-income African countries. Its carbon emission alone constitutes 31% of the total emission from the lower-middle-income countries in Africa. This high level of carbon emission can partly be attributed to the high production of gas and oil in the country, coupled with a relatively higher level of industrial activity. Other sources of carbon emission in the country are transportation, industry, and real estate, as well as cement production.
The country faces serious climate change risks. Flooding due to rising sea levels is affecting the Nile River Delta where Egypt grows most of its crops. About 12% to 15% of the country’s fertile arable land in the Nile Delta will be negatively affected by sea level rise and salt water intrusion. Moreover, hotter temperatures and reduced rainfall will reduce agricultural productivity (including livestock rearing and fishing activities) by 15%–20% by 2050. Egypt’s National Strategy for Adaptation to Climate Change and Disaster Risk Reduction released in 2011 lays out a strategy that gives a framework of its adaptation policy to deal with the effects of climate change. The ‘Green’ constitution predicated on the principle of sustainable environment and development as a human right also recognises and promotes responsible and rational use of the country’s natural resources while ensuring food security for Egyptians.
On the Current Path, carbon emissions from fossil fuels will increase rapidly to 125 million tons by 2043. The Manufacturing and AfCFTA scenarios are the most carbon-intensive as they involve aggressive production of low-end manufacturing goods that will imply more fossil fuel use. On the other hand, the Demographics and Health and Agriculture scenarios are the least carbon-intensive scenarios in Egypt. In the Combined scenario, Egypt’s total carbon emissions will rise to 154 million tons — 23.2% higher than what is estimated in the Current Path in the same year. The materialisation of the Combined scenario and achieving sustainable economic development will come at the cost of more carbon emissions in Egypt. Therefore, pursuing rapid economic growth in Egypt can lead to more environmental pollution in the long run. However, the country can rely on its huge renewable energy potential to pursue a green development pathway.
Chart 37 compares energy demand and production in the Current Path with the Combined scenario from 2019 to 2043. Production is done in six types, namely oil, gas, coal, hydro, nuclear and other renewables. The data is converted into billion barrels of oil equivalent (BOE) to allow for comparisons. Note that energy production could be for domestic use or for export.
The total energy produced in Egypt in 2023 was equivalent to 711 million BOE. In the same period, total energy demand was 753 million BOE leading to an excess energy demand of 42 million BOE. On the Current Path, total energy demand will outgrow production so that by 2043, excess energy demand will be equivalent to 33 million BOE. Historically, oil has been the main source produced in Egypt followed by gas. In 1990, the total volume of oil produced constituted 85.8% of total production and valued at 312 BOE. This is followed by gas and hydro production which constituted 12.7% and 1.6% of total production respectively equivalent to 46 BOE and 6 BOE. However, by 2005, gas has overtaken oil to become the dominant energy produced in the country. In 2023, the total amount of gas produced in Egypt amounted to 487 million BOE, constituting about 68.5% of total energy production. This was complemented by oil production worth 209 million BOE representing 29.4% of total energy production. The country also produced negligible amounts of hydro, coal and other renewable energies to constitute the remaining 2% of total production.
On the Current Path, the production of oil will decline significantly which will be replaced by gas and other renewable energies. By 2043, gas production will amount to 1.1 billion BOE representing 79.7% of total production. The production of other renewable energies will account for 11.3% of total energy production in the country, representing 151 million BOE. This will be followed by the production of oil which will amount to 115 BOE equivalent to 8.4% with nuclear and hydro contributing negligible amounts to total production.
The Combined scenario shows an increase in energy demand, creating a larger energy deficit, with renewable energy becoming the dominant energy source, surpassing oil and gas. In the scenario, energy demand in Egypt will jump to 1.7 billion BOE, which will be 295 million BOE more than the Current Path. Although the total energy production of 1.5 billion BOE in the Combined scenario will be 109 million BOE more than the Current Path, it will fall short of the total demand. Indeed, by 2043, the excess demand for energy of 219 million BOE will be more than 6 times than the Current Path. The composition of energy production in the Combined scenario will not significantly differ from the Current Path. Gas production will still constitute 79.4% of total production followed by other renewable energy (11.8%) and oil (8.2%) of total production.
Chart 38 summarises the policy recommendations.
The Sustainable Development Strategy: Egypt Vision 2030 is the broad framework for attaining Egyptians' dreams and aspirations of an advanced and prosperous nation inspired by the ancient Egyptian civilization’s achievements. Its overall vision is that “By 2030, Egypt will be a country with a competitive, balanced, and diversified economy, depending on knowledge and creativity, and based on justice, social integration, and participation, with a balanced and varied ecosystem, a country that uses the genius of the place and the citizens in order to achieve sustainable development and improve the quality of the life for all.
Over the years, the country has made significant progress in advancing human development and its economic growth prospect is higher than its income peers. However, it will still lag behind its Vision 2030 targets if nothing is done to accelerate its development potential and harness its economic opportunities. Even by 2030 which is the end of the implementation of the vision, Egypt will not meet its growth target of 12% on the Current Path. Indeed, by 2043, the average growth rate will be about 4.7% far below the desired target in Vision 2030.
The country still suffers from the impact of fiscal and monetary instability. The economy is challenged in all spheres, including weakening domestic currency, high inflation rate, capital flight, and rising public debt. Also, Egypt’s high growth rates have not translated into the jobs needed to reduce unemployment.
Thus, while Egypt has made progress and will continue progressing on the Current Path, it is not transformative enough to address the structural challenges. Without aggressive interventions, such as significant investment in key sectors and major policy reforms, the country will not achieve most of its Vision 2030 targets even by 2043. Therefore, a comprehensive and targeted set of socio-economic policy interventions across demographics, health, education, agriculture, infrastructure, manufacturing, trade, financial flows, and governance is necessary to redirect the country’s current development trajectory towards a more sustainable and inclusive path. Based on these, we recommend the following policy options in these sectors:
Demographics and Health
- Promote inclusive family planning practices as a shared responsibility between men and women, increase access to modern contraceptives and reduce barriers to participation in the economy for women.
- The government should allocate more funding to the health sector to ensure the provision of vital medical equipment and other infrastructure.
- Also, the working conditions of doctors and other health professionals in the country should be reviewed and improved to minimise the drastic brain drain in the health sector.
- The government, through the appropriate ministries and agencies, should intensify education on healthy lifestyle practices to reduce the burden of non-communicable diseases such as strokes, cancer, diabetes and respiratory infections in the country.
Education
- Dedicate more funding towards public schools to mitigate the challenges of capacity shortages and overcrowded facilities, especially in denser regions like Cairo, Alexandria and Giza.
- Teacher remuneration and motivation should also be reviewed and improved to reduce the drop in the number and availability of qualified teachers in public schools.
Agriculture
- The commendable effort to reclaim lands for agriculture and initiatives to promote green farming should be encouraged.
- More efficient and better agricultural policies geared towards incentivising farmers to focus on food products for which Egypt has a comparative advantage are also needed
Manufacturing
- The government should encourage foreign investors to invest in capital and knowledge transfer to build the needed workforce in the Country.
- Higher educational institutions should also collaborate and partner with the private sector and businesses to design curricula that equip students with the required industrial and critical skills.
- Promoting manufacturing sector growth requires improving the country's macroeconomic conditions so that financial institutions can advance cheaper credit to micro, small, and medium-scale enterprises, which constitute the majority of firms in Egypt.
AfCFTA
- Commit to and take advantage of the full implementation of AfCFTA to trade more with other African countries.
Infrastructure
- The government should ensure rapid completion of the El Dabaa Nuclear Power Plant, which will add 4.8GW to electricity generation capacity. This significant increase in capacity will not only help the country end electricity shortages emanating from the high and rising demand but also pave the way for surplus electricity, supporting the country's vision of exporting electricity by 2035.
- To address the looming water crisis in the country, more investment in building desalination plants for water treatment is needed. This must be accompanied by a drive for better water management and more efficient use of this scarce resource, especially in agriculture.
Financial Flows
- With the massive remittance inflow into the country, the Government should encourage its expatriate community to invest in the economy by establishing diaspora bonds, as countries such as Israel, India, Nigeria, and Ethiopia have done. These bonds not only provide a secure investment opportunity for the diaspora but also inject much-needed capital into the economy, fostering growth and development.
- The government should prioritise creating an attractive environment for foreign investors. This can be achieved through reforms such as guaranteeing international arbitration clauses in commercial contracts and agreements, as is the case with petroleum investment mega projects. By fostering international collaboration and inspiring investor confidence, these measures can significantly boost foreign direct investment, paving the way for global partnerships and economic growth.
Governance
- Allocating more funding and resources to combat corruption in the public sector, especially in procurement, should be of the utmost importance.
- Promote good governance and civil liberties to reduce the risk of instability amid economic challenges given its relatively large youth bulge.
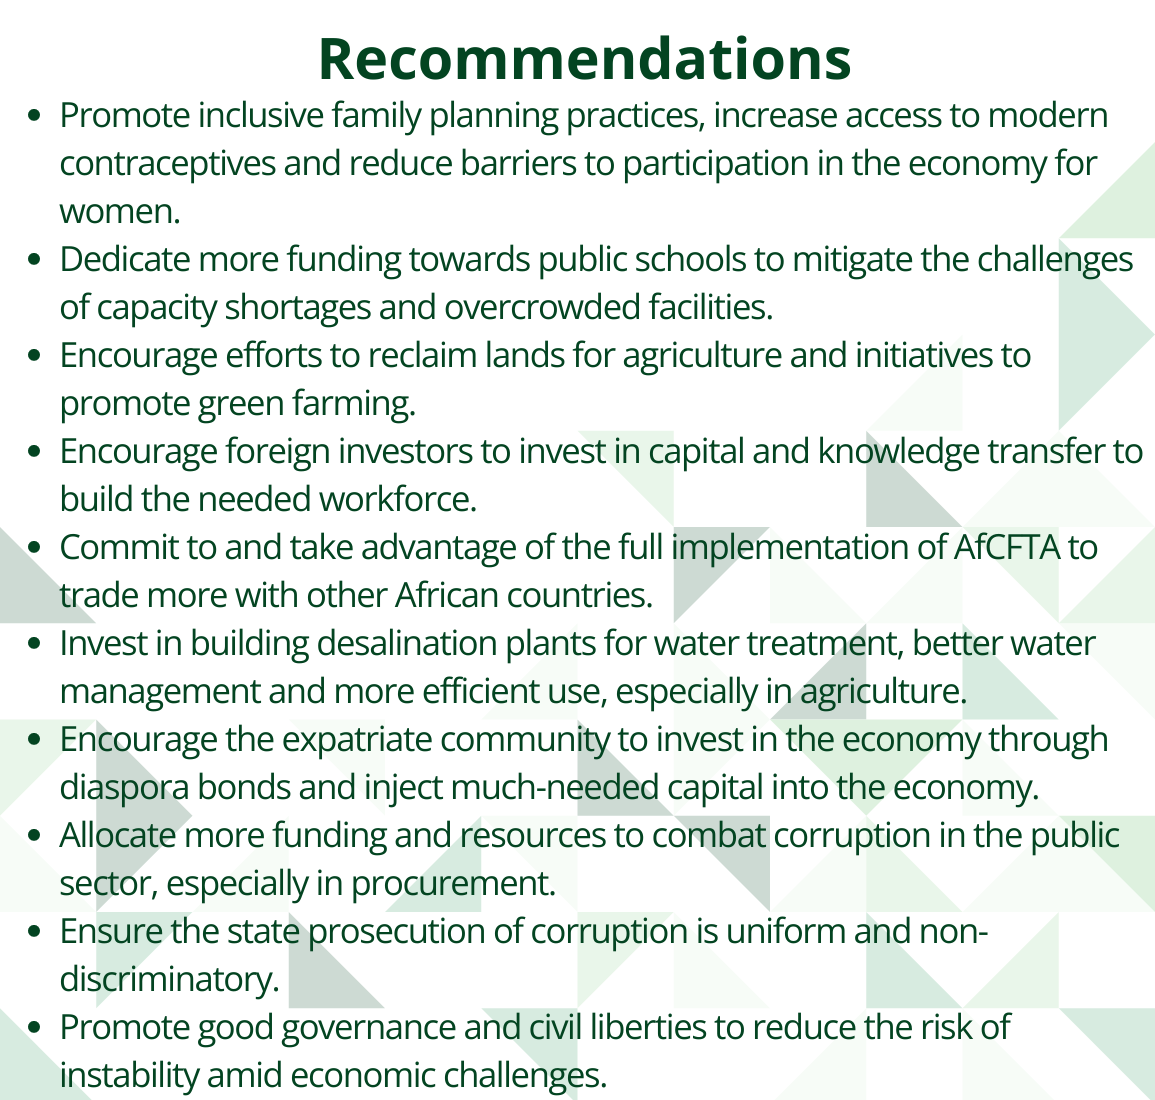
Page information
Contact at AFI team is Enoch Randy Aikins
This entry was last updated on 31 May 2026 using IFs v8.22.
Donors and sponsors


Reuse our work
- All visualizations, data, and text produced by African Futures are completely open access under the Creative Commons BY license. You have the permission to use, distribute, and reproduce these in any medium, provided the source and authors are credited.
- The data produced by third parties and made available by African Futures is subject to the license terms from the original third-party authors. We will always indicate the original source of the data in our documentation, so you should always check the license of any such third-party data before use and redistribution.
- All of our charts can be embedded in any site.
Cite this research
Enoch Randy Aikins (2026) Egypt Development Futures. Published online at futures.issafrica.org. Retrieved from https://futures.issafrica.org/geographic/countries/egypt/ [Online Resource] Updated 31 May 2026.