 Burundi
Feedback welcome
Our aim is to use the best data to inform our analysis. See our Technical page for information on the IFs forecasting platform. We appreciate your help and references for improvements via our feedback form.
This report examines Burundi's current and projected future development. It presents eight sectoral scenarios to forecast progress by 2043, including demographic, economic and infrastructure-related outcomes. Burundi faces challenges with political instability and weak governance but offers significant growth potential in its agricultural sector. The analysis further considers the implications of the Agenda 2063 goals, aiming to offer insights into policy actions that could enhance Burundi's developmental trajectory and guide the country towards a more prosperous future.
For more information about the International Futures modelling platform that we use for the development of the various scenarios, please see About this Site.
Executive Summary
This page begins with an introductory assessment of the country’s context, looking at current population distribution, social structure, climate and topography.
- Burundi is one of 23 low-income countries in Africa and had an estimated population of 11.9 million in 2020. Located in the Great Lakes region of East Africa, this landlocked country is surrounded by Rwanda to the north, the Democratic Republic of the Congo to the west and Tanzania to the east and south. Lake Tanganyika is situated on its south-west border. Burundi is a member of both the Economic Community of Central African States and the East African Community.
- Burundi is divided into two distinct climatic regions: a tropical savanna climate and a subtropical highland climate. There are two wet seasons, with peak rainfall occurring in March and November, while the two dry seasons are from June to August and from December to January.
- The current National Development Plan 2018–2027 aims to structurally transform the Burundian economy for robust, sustainable, resilient and inclusive growth, thereby creating decent jobs for all and leading to improved social welfare.
- Repeated political shocks have severely constrained economic growth and development in Burundi. In 2019, the size of Burundi's economy was estimated at US$2.7 billion (the ninth smallest in Africa). This is only 31.7% above its level in 1990. On the Current Path, the GDP of Burundi will be US$7.7 billion by 2043, equivalent to an annual average growth rate of 4.6% from 2022 to 2043.
This section is followed by an analysis of the Current Path forecast for Burundi which informs the country’s likely current development trajectory to 2043. It is based on current geopolitical trends and assumes that no major shocks would occur in a ‘business as usual’ future. This section compares progress on the Current Path with eight sectoral scenarios. These are Demographics and Health; Agriculture; Education; Manufacturing; the African Continental Free Trade Area (AfCFTA); Large Infrastructure and Leapfrogging; Financial Flows; and Governance. Each scenario is benchmarked to present an ambitious but reasonable aspiration in that sector.
- Burundi is one of the countries with the biggest governance challenges in Africa. In the Governance scenario, the overall governance performance of Burundi in 2043 is nearly 20% higher than the Current Path for the same year.
- The population of Burundi is growing rapidly. On the Current Path, the population will almost double by 2043 to 22.4 million. This increase is driven by high fertility rates, low access to modern contraceptives and limited education in family planning and limited access to healthcare facilities. Whereas Burundi only reaches its demographic dividend in 2055 in the Current Path, in the Demographics and Health scenario it is reached in 2041, i.e. 14 years earlier than in the Current Path.
- Burundi has made significant progress in its quantity of education, especially at primary level. However, bottlenecks remain at secondary and tertiary levels. On the Current Path, the average years of education for adults (aged 15 years and older) will likely be six years by 2043 — 0.5 years lower than in the Education scenario.
- An infrastructure shortage, especially poor access to electricity and the lack of a good road network, is one of the significant constraints to the modernisation of the Burundian economy. On the Current Path, the share of rural population within 2 km of an all-weather road will reach 40.5% by 2043, up from 38% in 2019. In the Large Infrastructure and Leapfrogging scenario, it will be about 42% — 1.5 percentage points above the Current Path in 2043.
- The predominantly rain-fed agriculture sector in Burundi is the main source of livelihood for the majority of the population. Although its contribution to GDP has declined over time, it still provides income for about 86% of the population. However, the low productivity in the sector, driven by poor farming practices and climate-related shocks, increases food insecurity. On the Current Path, agriculture import dependence will continue to increase to 53.7% of total demand in the country by 2043 compared to an agricultural surplus, equivalent to 6.6% of total demand, in the Agriculture scenario in 2043.
- The manufacturing sector in Burundi is underdeveloped. The industry accounted for about 15% (US$0.44 billion) in 2019, and, on the Current Path, it will increase to 22.7% of GDP (US$1.75 billion) by 2043. In the Manufacturing scenario, Burundi makes substantial progress in manufacturing such that, by 2043, it accounts for about 28% of GDP (US$2.35 billion) — more than five percentage points of GDP above the Current Path.
- Burundi has not made progress on export diversification. Coffee and tea remain the key exported products, accounting for more than 80% of total exports. The country’s trade balance is also structurally in deficit. In the AfCFTA scenario, Burundi’s trade deficit significantly declines from a projected shortfall equivalent to 48.3% of GDP in the Current Path by 2043 to only 12.6% of GDP.
- Burundi depends heavily on aid for fiscal revenue, investments and foreign reserves. In the Financial Flows scenario, government revenue increases to reach 25.6% of GDP by 2043 (US$2.1 billion), up from 19.6% in 2019. This is 3.3 percentage points of GDP above the Current Path of 22.3% (US$1.7 billion) in the same year.
The third section compares the impact of each of the eight sectoral scenarios on key indicators (economy, poverty and inequality, carbon emissions). It then proceeds with a Combined Agenda 2063 scenario analysis (the sum effect of all eight scenarios).
- In the short to medium term (until 2038), the Agriculture scenario has the greatest impact on GDP per capita. However, by 2043 the scenario with the most significant improvement relative to the Current Path is the Large Infrastructure and Leapfrogging scenario, followed closely by the Governance and Agriculture scenarios.
- The Governance and Agriculture scenarios have the most significant contributions to reducing the extreme poverty rate by 2043. In the short term, the Agriculture scenario has the most significant impact on poverty reduction, implying that enhancing agriculture productivity through new technologies and innovations is crucial to reducing poverty in Burundi.
- By 2043, AfCFTA and Agriculture scenarios will result in the greatest carbon emissions of 1.5 million tons, whereas the Demographics and Health scenario will result in less carbon emissions compared to the Current Path for 2043.
- The Combined scenario has a much greater impact on GDP per capita compared to the individual thematic scenarios. By 2033, the GDP per capita of Burundi is larger than in the Current Path, and by 2043 it will be US$883 more than in the Current Path in that year.
- In 2043 the agriculture value added in the Combined scenario is notably larger than the Current Path in the same year. The manufacturing and services value added are also higher than the Current Path in 2043. Implementing the Combined scenario can accelerate the structural transformation of the Burundian economy, with the share of the manufacturing sector in GDP increasing from 16% in 2019 to 26% in 2043, 3.3 percentage points of GDP above the Current Path.
- The materialisation of the Combined scenario can have a dramatic impact on poverty reduction in Burundi. In 2043, the extreme poverty rate in the Combined scenario is about 49 percentage points below the Current Path, equivalent to 11.2 million fewer poor people.
- On the Current Path, life expectancy in Burundi will steadily increase to 67.5 years by 2043, almost seven years above the current level. In the Combined scenario, the average Burundian can expect to live two years longer, which is on par with the projected average for global low-income countries and one year below the average for sub-Saharan Africa.
- The projected Gini coefficient is 0.34 by 2043. However, Burundi sees a significant decline in income inequality in the Combined scenario. The Gini coefficient in the scenario is 0.29, indicating that it has the potential to generate inclusive growth in Burundi.
- In the Combined scenario, carbon emissions increase from a very low base to 2 million tons by 2043. This is a 900% increase between 2019 and 2043 compared to a 550% increase on the Current Path over the same period. In 2043, the carbon emissions in the scenario are 0.7 million tons higher than the Current Path.
We end this page with a summarising conclusion offering key recommendations for decision-making. Burundi's development is still hindered by persistent political instability and reliance on low-productivity agriculture, despite achievements in consolidating peace and security, rebuilding institutions, and improving health and education outcomes since the Arusha Peace Agreement.
All charts for Burundi Development Futures
- Chart 1: Political map of Burundi
- Chart 2: Population distribution of Burundi
-
Chart 3: Republic of Burundi, National Development Plan 2018–2027
Chart 3: Republic of Burundi, National Development Plan 2018–2027
- Chart 4: GDP (MER) and annual growth rate in Current Path, 1990–2043
- Chart 5: Value added by sector in Current Path, 1990–2043
- Chart 6: Informal economy size in the Current Path, 2019–2043
- Chart 7: Current Path and sectoral scenarios
- Chart 8: Governance scenario
- Chart 9: Composite governance index in Current Path vs Governance scenario, 2019–2043
- Chart 10: Population structure in Current Path, 1990–2043
- Chart 11: Population distribution of Burundi
- Chart 12: Urban and rural population in Current Path, 1990–2043
- Chart 13: Demographics and Health scenario
- Chart 14: Demographic dividend in Current Path and Demographics & Health scenario, 2019–2043
- Chart 15: Infant mortality in Current Path and Demographics & Health scenario, 2019 –2043
- Chart 16: Education scenario
- Chart 17: Mean years of education in Current Path and Education scenario, 2019–2043
- Chart 18: Large Infrastructure and Leapfrogging scenario
- Chart 19: Traditional cookstoves usage in CP and Infra/Leapfrogging scenario, 2019–2043
- Chart 20: Rural road access in Current Path and Large Infra/Leapfrogging scenario, 2019–2043
- Chart 21: Agriculture scenario
- Chart 22: Agriculture import dependence in Current Path and Agriculture scenario, 1990–2043
- Chart 23: Manufacturing scenario
- Chart 24: Value added by manufacturing sector in Current Path and Manufacturing scenario, 2019–2043
- Chart 25: AfCFTA scenario
- Chart 26: Trade balance in Current Path and AfCFTA scenario, 2019–2043
- Chart 27: Financial Flows scenario
- Chart 28: Government revenue in Current Path and Financial Flows scenario, 2019–2043
- Chart 29: GDP per capita (PPP) in Current Path and scenarios, 2019–2043
- Chart 30: Poverty in Current Path and scenarios, 2019–2043
- Chart 31: Carbon emissions in Current Path and Combined scenario, 2019–2043
- Chart 32: GDP in Current Path and Combined scenario, 2019–2043
- Chart 33: GDP per capita in Current Path and Combined scenario, 2019–2043
- Chart 34: Value added by sector in Current Path and Combined scenario, 2019–2043
- Chart 35: Extreme poverty in Current Path and Combined scenario, 2019–2043
- Chart 36: Life expectancy in Current Path and Combined scenario, 2019–2043
- Chart 37: Income inequality in Current Path and Combined scenario, 2019–2043
- Chart 38: Carbon emissions in Current Path and Combined scenario, 2019–2043
- Chart 39: Recommendations
- Chart 40: Project data file
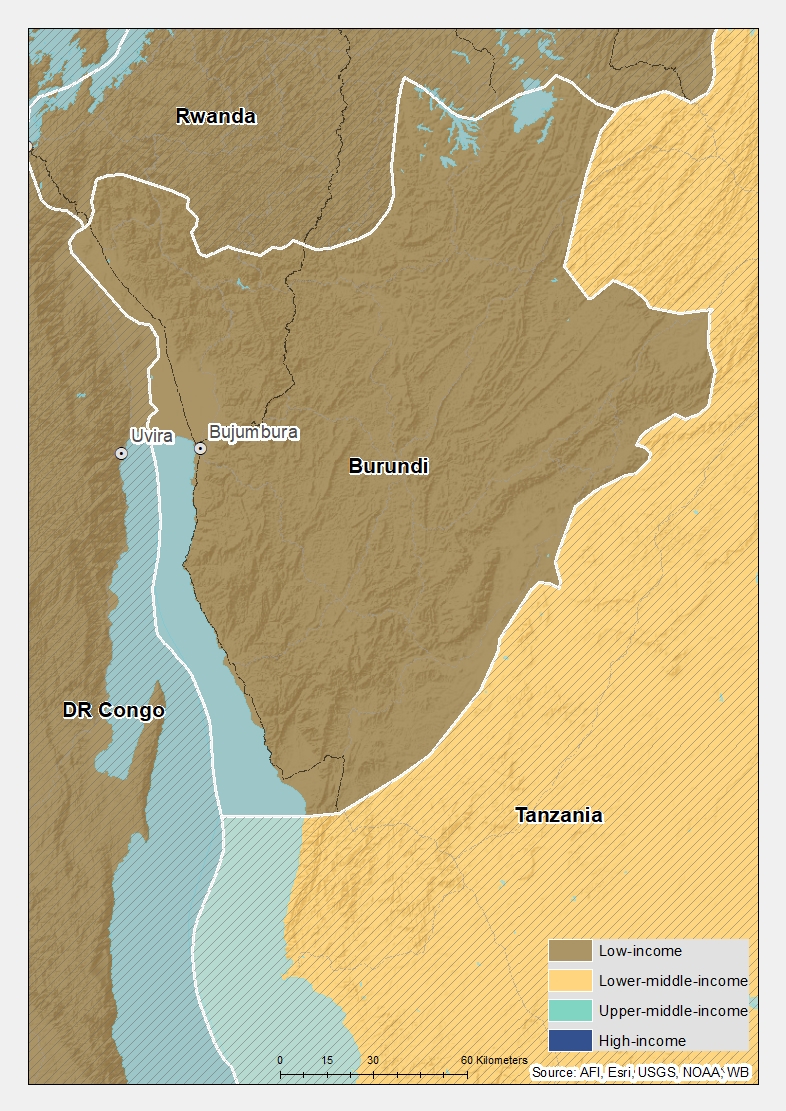
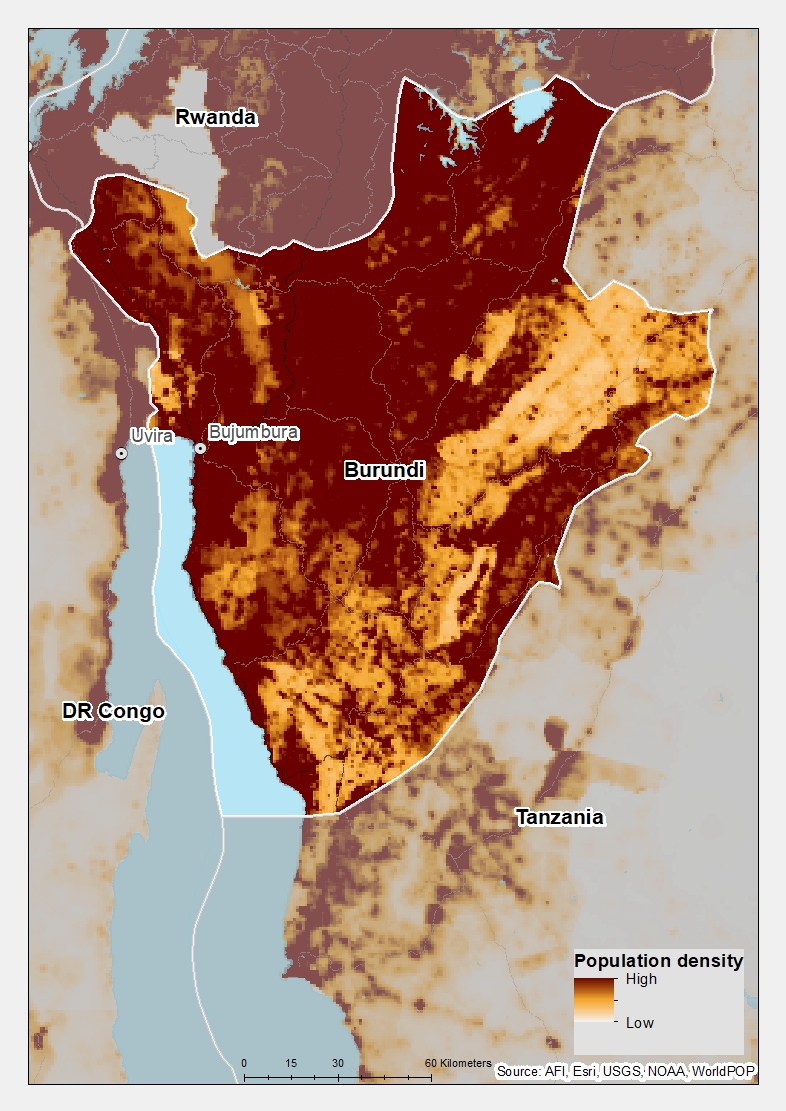


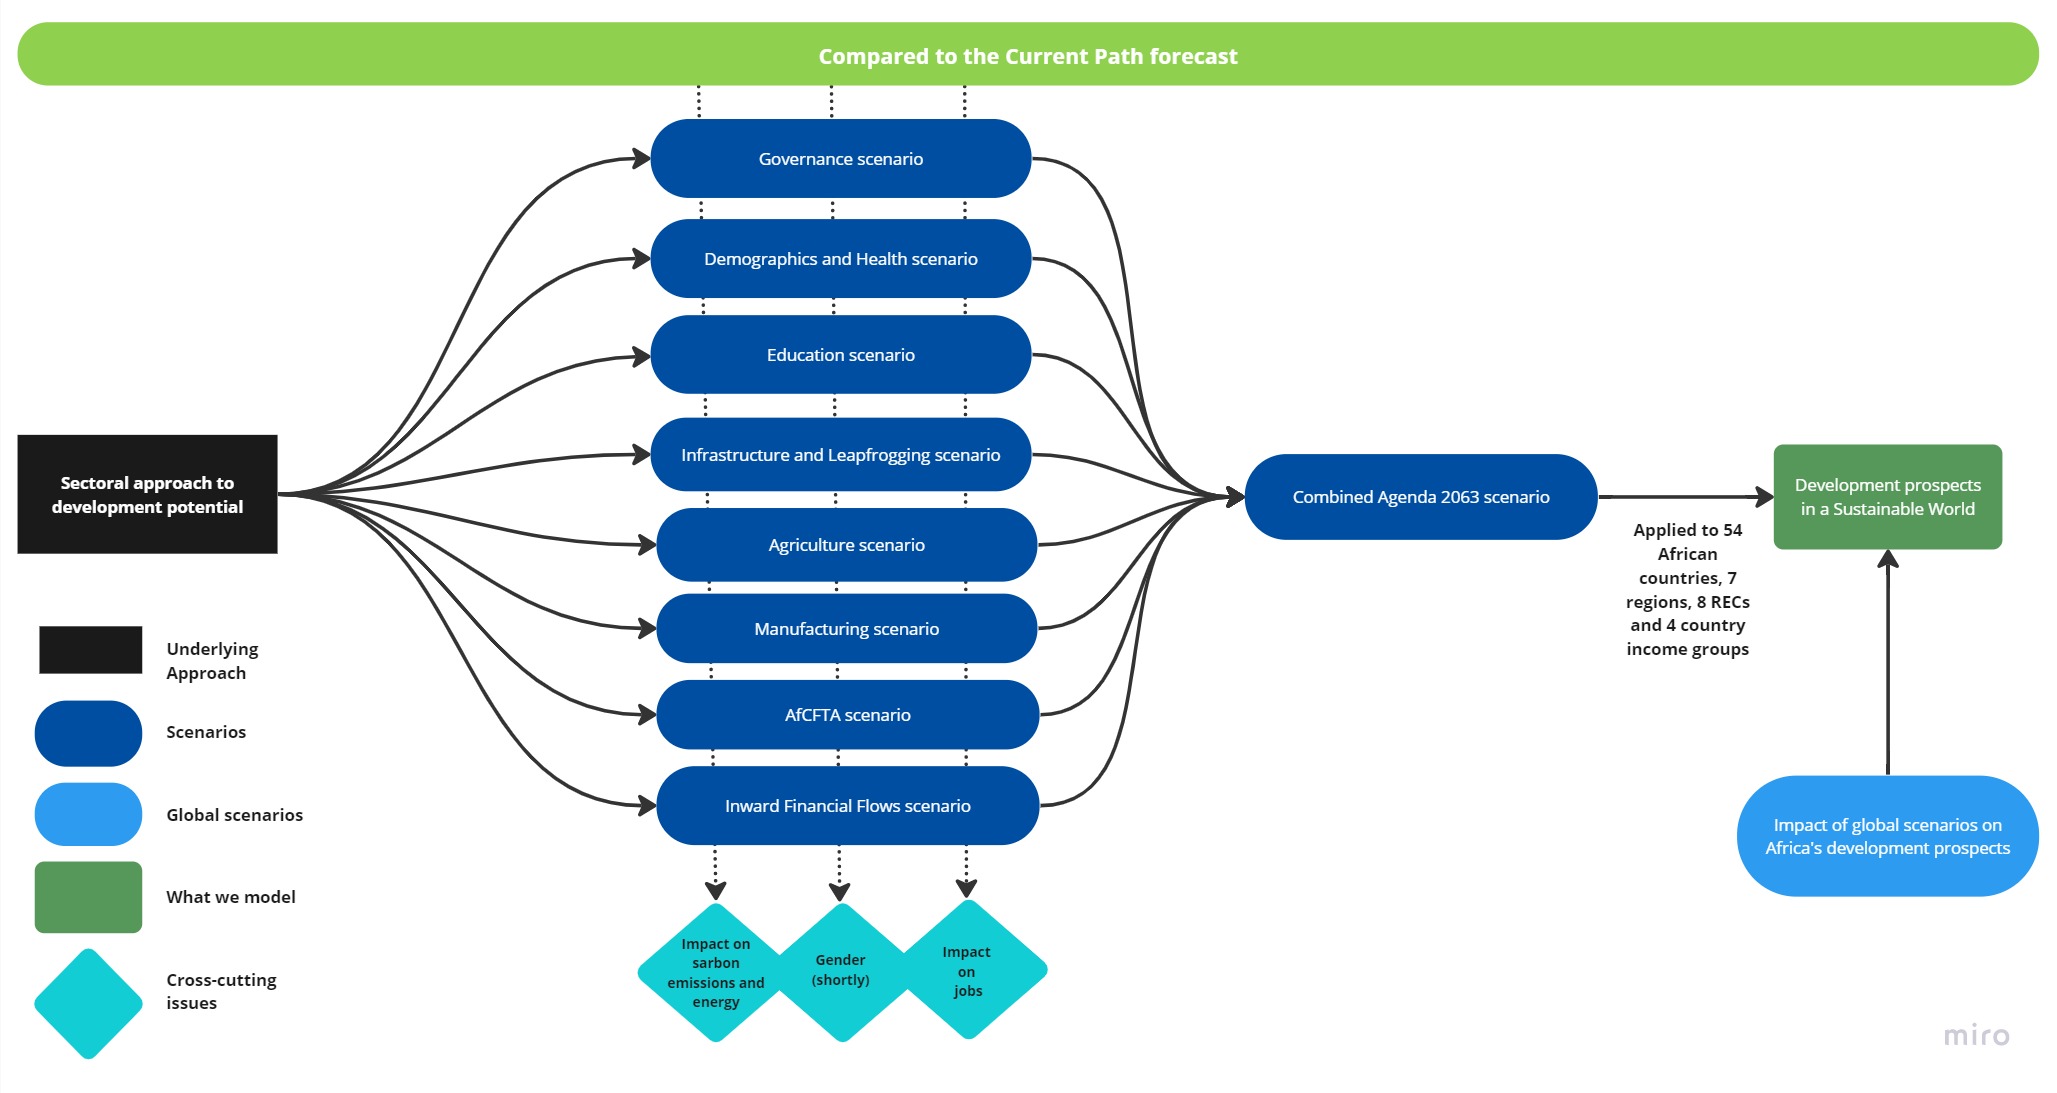
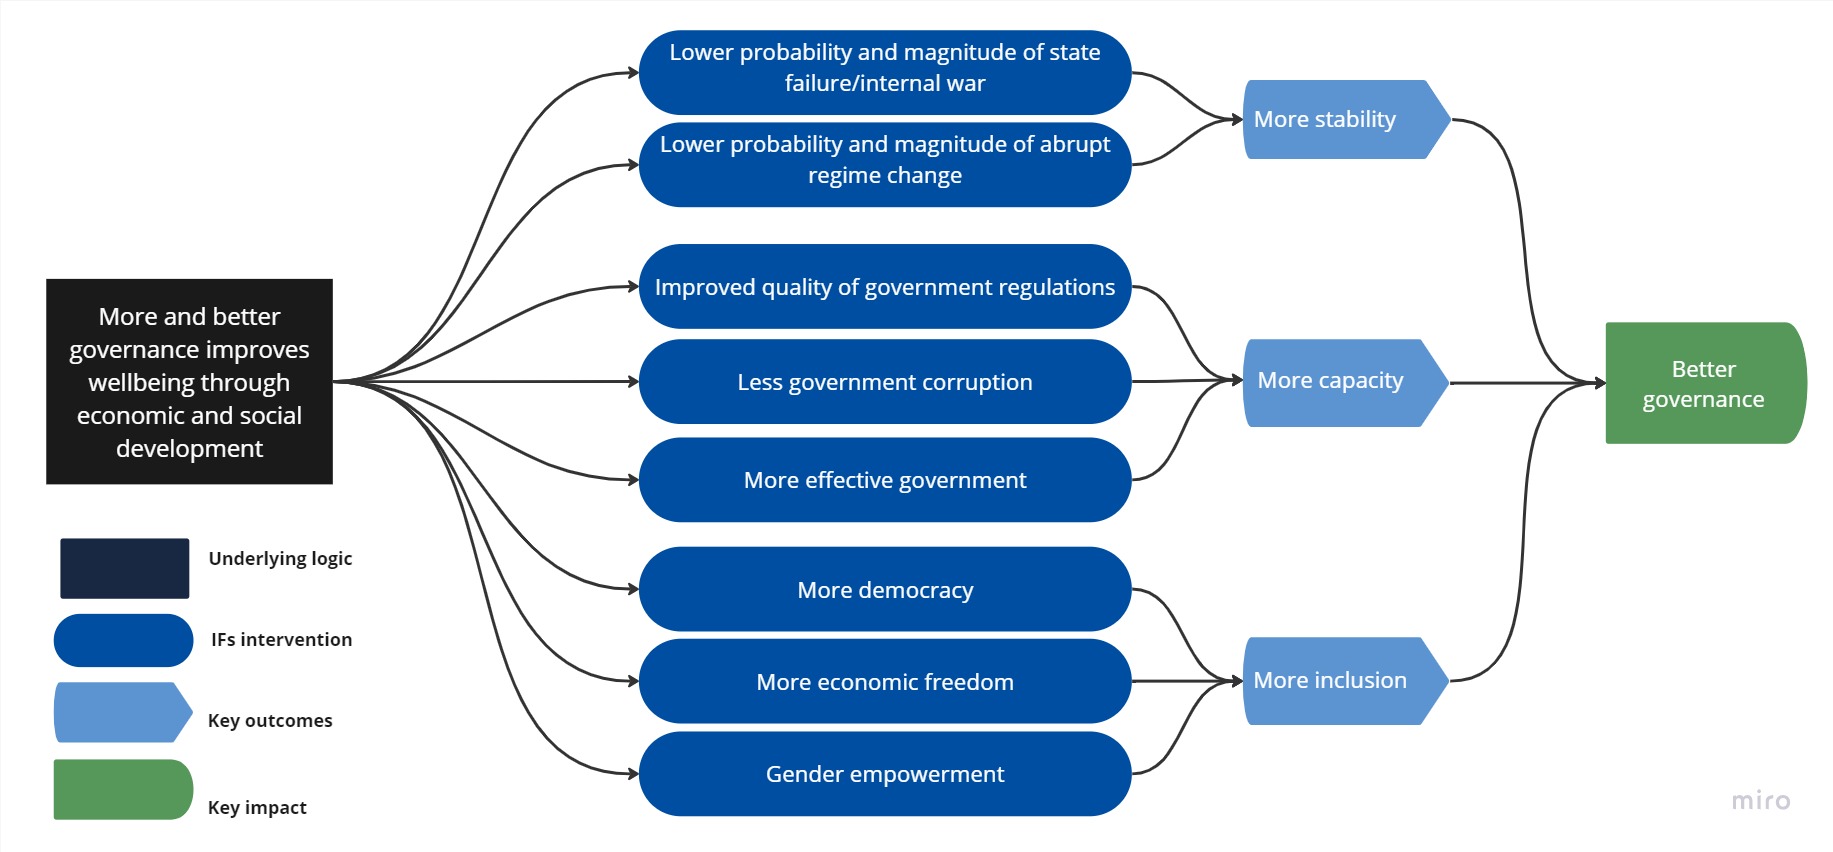


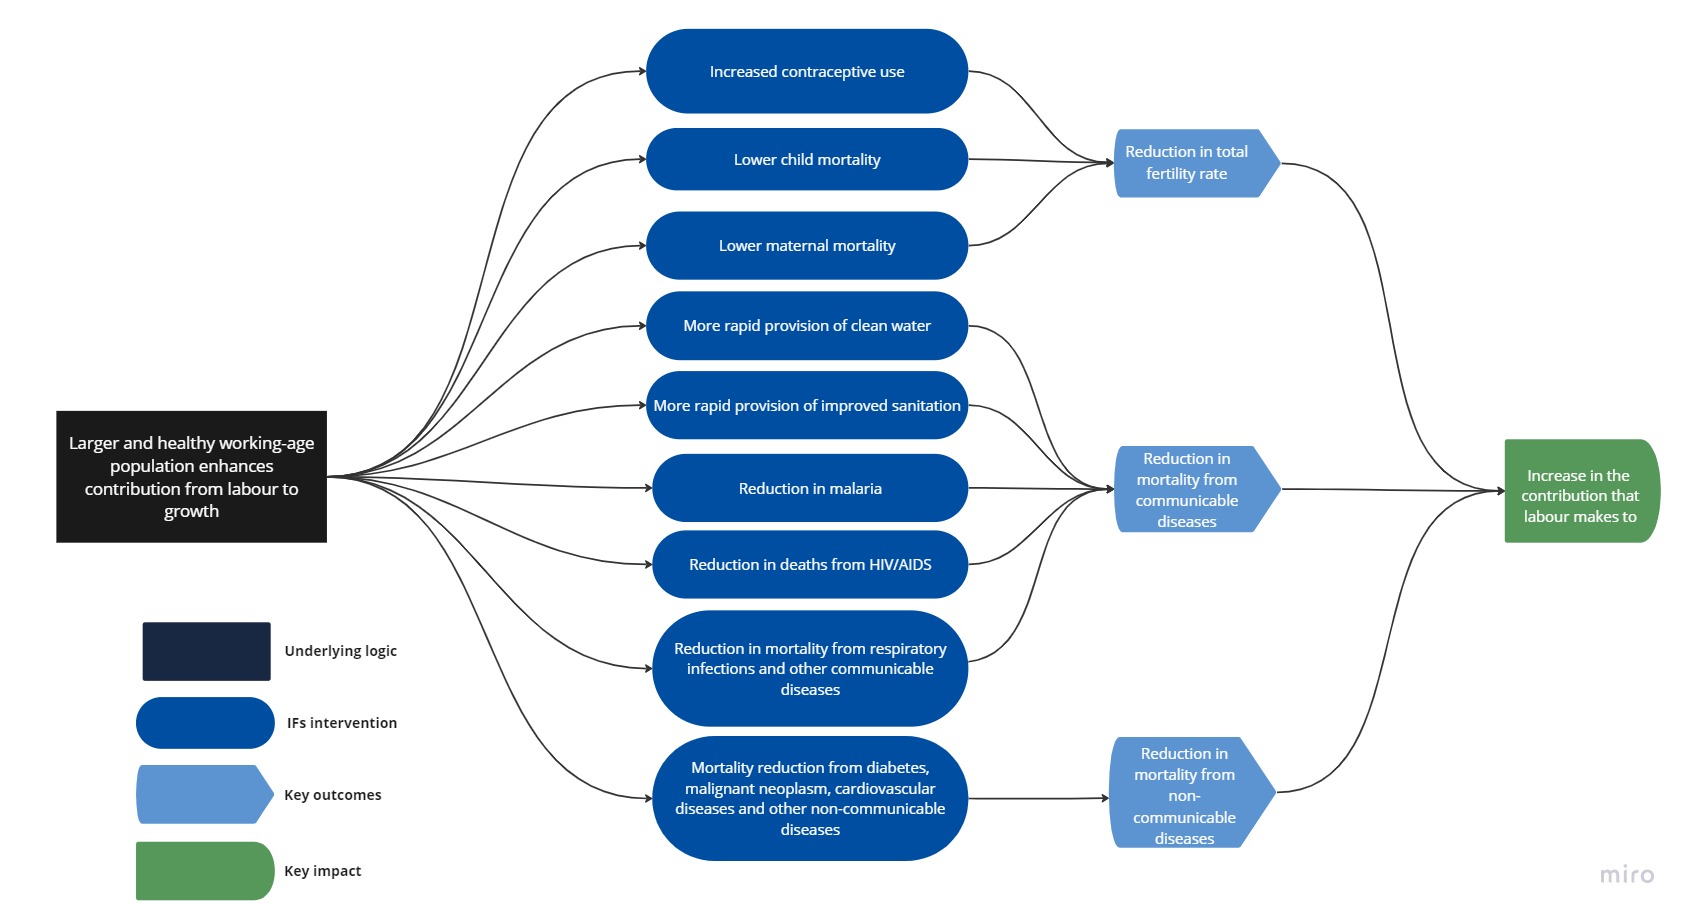


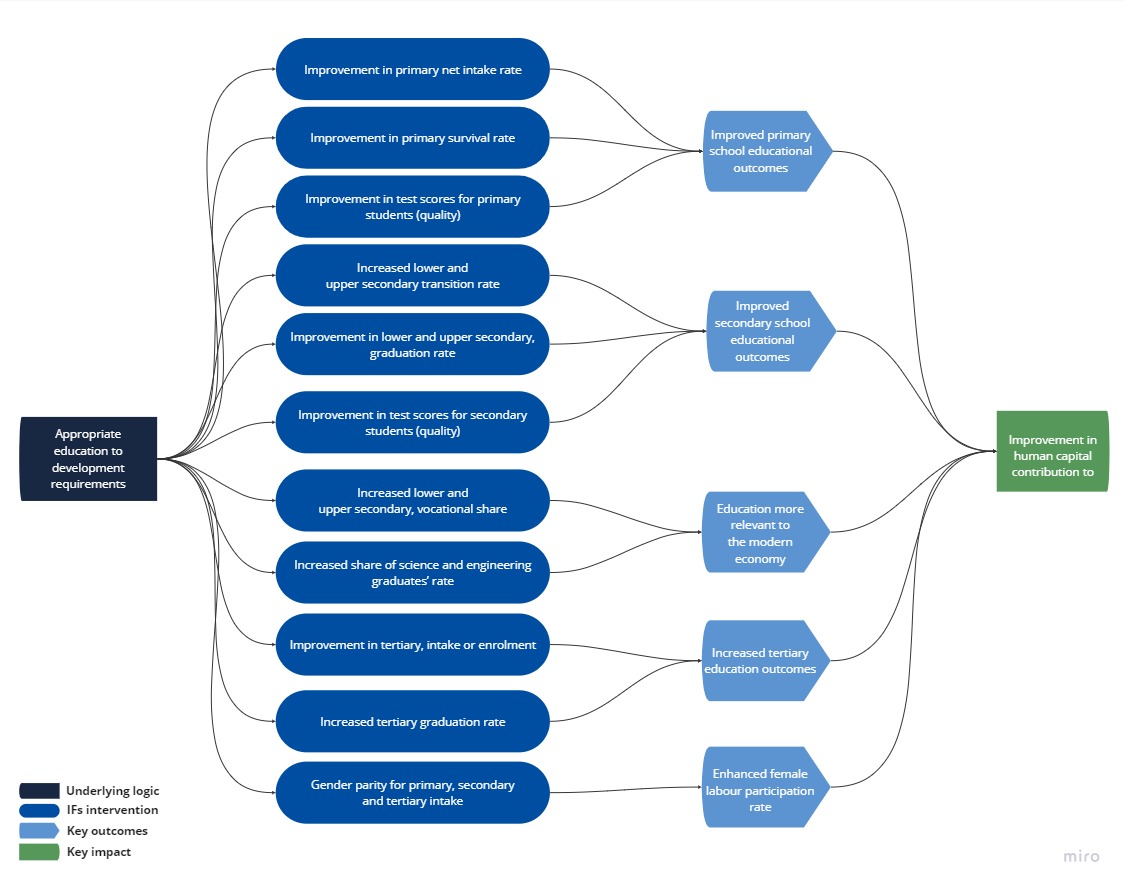


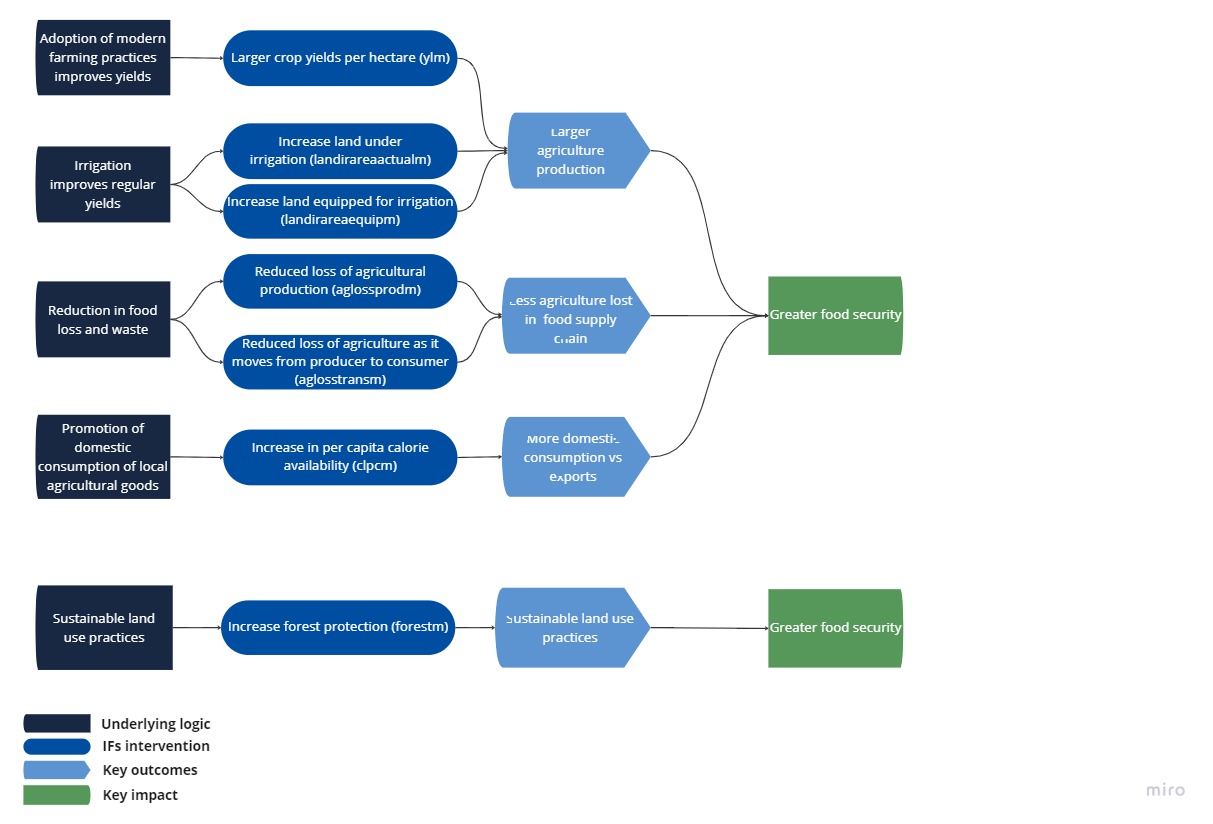

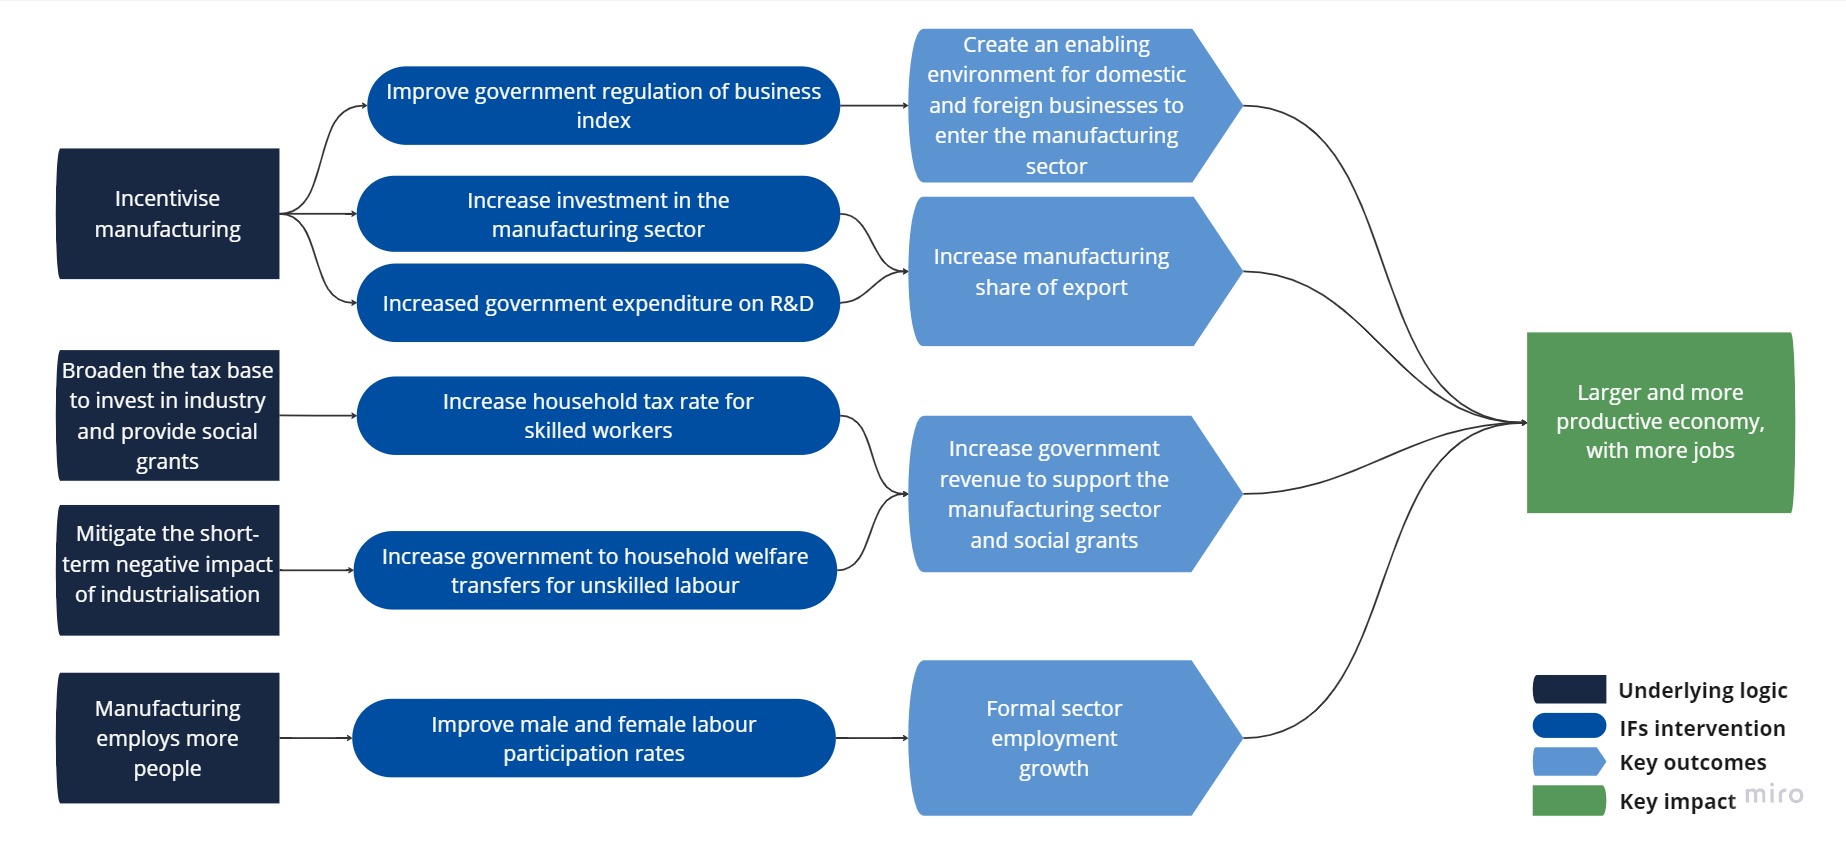

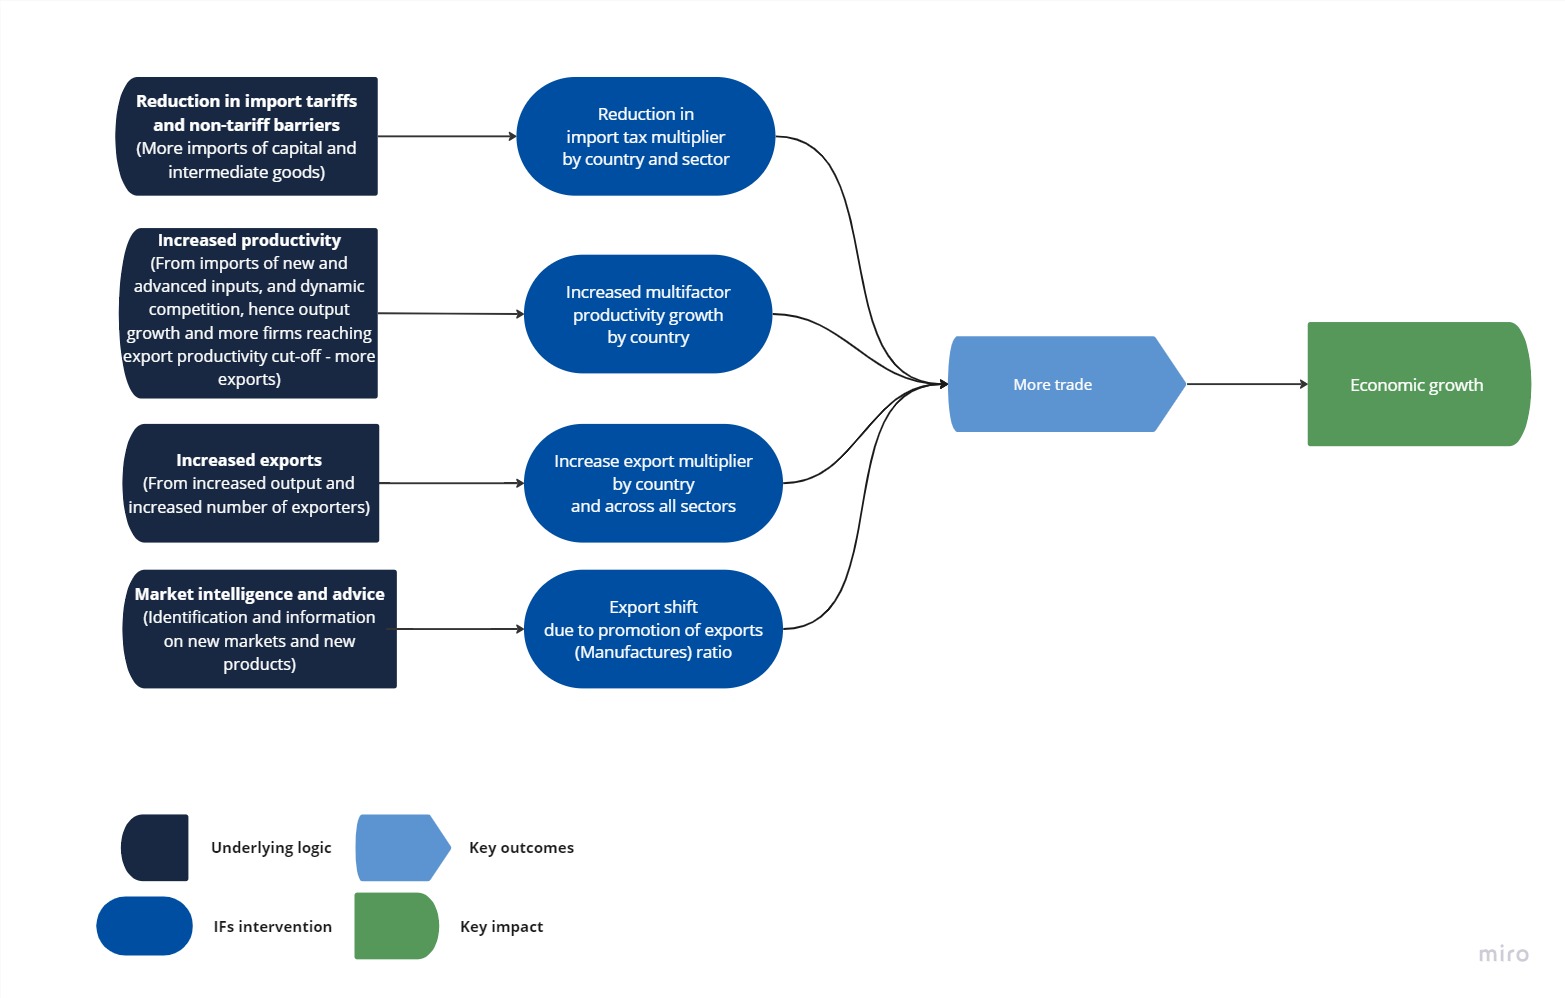

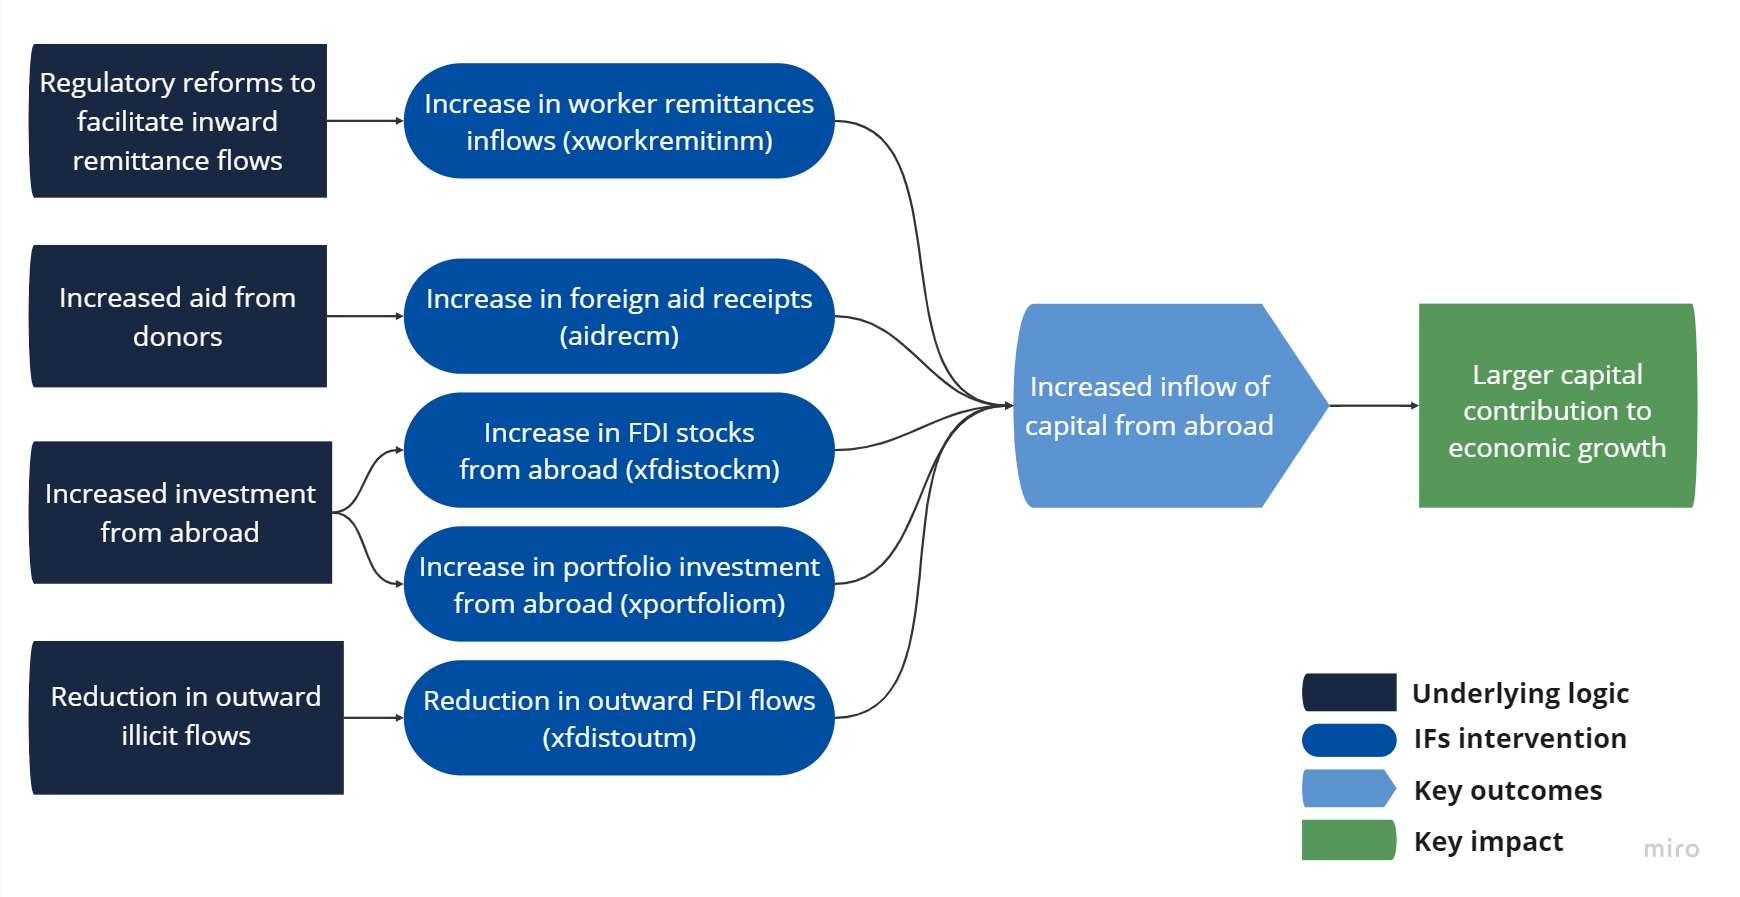


Chart 1 presents a political map of Burundi.
Burundi is one of the 23 low-income countries in Africa and had an estimated population of 11.9 million in 2020. Located in the Great Lakes region of East Africa, this landlocked country is surrounded by Rwanda to the north, the Democratic Republic of the Congo (DR Congo) to the west and Tanzania to the east and south (Chart 1). Lake Tanganyika is situated on its south-west border. Burundi is a member of both the Economic Community of Central African States (ECCAS) and the East African Community (EAC).
The post-independence history of Burundi has been characterised by endemic political instability and violence. After independence in 1962, a small Tutsi elite within the Union for National Progress (Union pour le progrès national – UPRONA) political party seized full control of the state and military, abolishing the monarchy in 1966 and eliminating large parts of the Hutu elite in the 1972 genocide. A democratisation process, under the auspices of the international community, resulted in general elections in 1993, which was won by Melchior Ndadaye from the Hutu majority party, the Burundi Democratic Front (Front pour la Démocratie au Burundi – FRODEBU). However, Ndadaye was assassinated shortly after the election by members of the armed forces, Forces Armées Burundaises (FAB). This event triggered a civil war (with an estimated death toll of 300 000) that lasted until 2005.
The subsequent Arusha Peace and Reconciliation Agreement between UPRONA and FRODEBU (and many smaller parties) in August 2000 led to a transitional government based on power-sharing with ethnic quotas for all political institutions. A new constitution, based on the Arusha Agreement and confirming ethnic quotas, was approved in February 2005. The first post-war elections of the same year brought to power Pierre Nkurunziza from the National Council for the Defense of Democracy – Forces for the Defense of Democracy (Conseil National pour la Défense de la Démocratie – Forces pour la Défense de la Démocratie, CNDD–FDD). CNDD–FDD was a rebel group that became an official political party in 2005. He inherited massive economic problems. For example, agricultural production, which comprises the majority of the country’s exports, had significantly dwindled. Nkurunziza successfully raised foreign capital to invest in agriculture, and with the support of the World Bank he spearheaded infrastructure projects aimed at improving access to water and electricity. These moves toward progress eventually led to his re-election in 2010.
Despite the domestic and international condemnation over his plan to stand for a third term, Nkurunziza remained resolute in his decision and secured a third term in 2015, overriding the term limits enshrined in the constitution. In January 2020, the CNDD–FDD confirmed Evariste Ndayishimiye as their candidate for the presidential election scheduled for later that year. Ndayishimiye was declared the winner of the May 2020 election. Nkurunziza, who was scheduled to step down from the presidency in August, died unexpectedly in June 2020. Following a Constitutional Court ruling that President-elect Ndayishimiye should not wait to take office, he was inaugurated on 18 June 2020.
With the change of leadership, Burundi is also slowly regaining its place on the international scene after years of isolation. The new president has addressed the UN General Assembly, attended an EU–Africa summit in Brussels, and made official visits to neighbouring countries. This visibility will likely lead to more aid, trade and foreign direct investment (FDI) to support growth and enhance economic development stunted by recurrent political instability.
Burundi is one of the world’s least developed countries. It ranked 185th out of 189 countries on the Human Development Index (HDI) in 2020, and over 70% of its population lives below the international poverty line of US$1.90 per day. The country’s GDP per capita was the lowest in Africa at US$220 (market exchange rate), or US$600 (purchasing power parity exchange rate), in 2019. Economic transformation is limited, and more than 80% of the population relies on the low-productivity agriculture sector for their livelihoods.
Chart 2 presents a population distribution map.
Burundi is divided into two distinct climatic regions: a tropical savanna climate and a subtropical highland climate. There are two wet seasons, with peak rainfall occurring in March and November, and two dry seasons, from June to August and December to January. Clear rain variability over the medium term contributed to more than 3 million people being affected by droughts between 1996 and 2016, showing how vulnerable Burundi’s population is to natural disasters and climate change. Burundi is the third most densely populated country in sub-Saharan Africa, with an estimated 4.6 inhabitants per hectare in 2020.
Burundi’s current National Development Plan (NDP) 2018–2027 provides a socio-economic interpretation of the country. It aims to structurally transform the Burundian economy for robust, sustainable, resilient and inclusive growth, thereby creating decent jobs for all and leading to improved social welfare.
The structural transformation of the economy will be achieved through several pillars, summarised as follows:
- Modernise the agriculture sector:
This pillar is aimed at the regionalisation of crops, promotion of integrated family farming, mechanisation of agriculture, preservation of agricultural land, transformation of agricultural production, livestock production, diversification of export products, water management and irrigation.
- Increase energy production:
Affordable and reliable energy access is viewed as one the prerequisites for the sustainable structural transformation of the Burundian economy. The focus will be on renewable energies such as solar energy, biomass and wind to increase energy production.
- Increase investment in human capital formation:
The aim is to improve human capital stock and support growth through knowledge and learning.
- Improve business environment to promote industrialisation:
As the manufacturing sector accounts for about 15% of GDP, the objective is to create an enabling environment to attract FDI to the sector and make it the engine of Burundi’s economic development.
- Strengthen transport and information and communication technologies (ICT) infrastructure to open up the economy and to promote trade.
- Develop the tourism sector:
The low levels of tourism development in Burundi are attributable to the poor quality of tourism-related infrastructure, the weak structuring of tourism products, the lack of professional qualifications of the personnel in the sector and the absence of specific incentives for investment in the industry. The objective, therefore, is to address these constraints to harness the country’s huge tourism potential.
- Promote public–private partnerships to finance socio-economic infrastructure and to create jobs.
- Promote regional integration and international cooperation:
As a result of regional integration and international cooperation, Burundi expects the expansion of its economic and political space, the achievement of economies of scale, the development of trade as well as the guarantee of peace and collective security.
Chart 4 presents Burundi's GDP (MER) and annual growth rate in the Current Path from 1990 to 2043.
Repeated political shocks have severely constrained economic growth and development in Burundi. From 1993 to 1999, civil conflicts destroyed capital and repressed investment, negatively affecting economic growth. The public debt stock also increased dramatically from an average of 50.9% of GDP from 1973 to 1991 to about 112% from 1993 to 1999.
From 2006, economic growth modestly resumed following the conclusion of the Arusha Peace and Reconciliation Agreement. The breakthrough in the peace process and subsequent reduction in violence — combined with better macroeconomic management, Heavily Indebted Poor Countries (HIPC) debt relief and aid inflows — led to relatively accelerated economic growth from 2007 to 2014, with real GDP growth averaging 4.3% (Chart 4).
The country was unable to sustain this progress though as GDP retracted by 3.9% in 2015 amid a political crisis, riots and violence that prompted donors to suspend the aid on which Burundi heavily depended for fiscal revenues, investments and foreign reserves. Consequently, Burundi has experienced a difficult economic situation over the past seven years, which has led to fiscal deficit, a shortage of foreign reserves and balance of payments difficulties.
Furthermore, economic growth in 2020 was strongly affected by the COVID-19 pandemic, falling to 0.3%, compared to 1.8% in 2019. In 2021, economic growth stood at 3.1%, driven by agriculture, investment in public infrastructure and an easing of restrictions related to the pandemic. Inflation was forecast to remain high at around 12% in 2022 due to the impact of the war in Ukraine on food and oil prices worldwide. Public debt was projected to fall to 70.2% of GDP in 2022 and to 66.5% in 2023, from 71.9% in 2021, amid fiscal consolidation efforts.
In 2019, the size of Burundi's economy was estimated at US$2.7 billion — the ninth smallest in Africa. This is only 31.7% above its level of US$2.05 billion in 1990. On the Current Path, the GDP of Burundi will be US$7.7 billion by 2043, equivalent to an annual average growth rate of 4.6% over the period 2022 to 2043 (Chart 4). This is significantly below the double-digit growth rate targets in the NDP.
Our modelling uses data from the Global Trade and Analysis Project (GTAP) to classify economic activity into six sectors: agriculture, energy, materials (including mining), manufacturing, services and ICT. Most other sources use a threefold distinction between only agriculture, industry and services with the result that data may differ.
Chart 5 shows the structure of Burundi’s GDP according these sector classifications.
The agriculture sector is an important source of economic growth in Burundi, although its contribution to GDP has declined over time from 51.1% in 1990 to 31.5% in 2019. The agriculture sector contributed the largest share to the country's GDP over the period 1970 to 2013 before being overtaken by the service sector in 2014. In 2019, the service sector accounted for 44.2% of GDP (US$1.2 billion, 2017 US$). On the Current Path, the share of the service sector in GDP will likely increase to 54.6% (US$4.2 billion) by 2043, and the share of the service sector in GDP will likely increase to 54.6% (US$4.2 billion) by 2043.
Agriculture made the second most significant contribution to GDP at 31.5% (US$0.87 billion) in 2019, and it will decline to 15.1% (US$1.16 billion) by 2043, indicating the economy's structural transformation. The manufacturing industry accounted for about 15% (US$0.44 billion) in 2019, and it iwill overtake the agriculture sector to become the second-largest contributor to GDP by 2035 (Chart 5). Industrial activity in Burundi is limited to small-scale processing and manufacturing plants, concentrated mainly in the capital city, Bujumbura.
ICT and materials (including mining) contributed about 2.3% and 1.2%, respectively, to GDP in 2019. By 2043, manufacturing will likely represent 22.7% of GDP (US$1.75 billion). On the Current Path, the contribution of energy, ICT and materials to GDP will likely remain the same over the forecast horizon.
Burundi has untapped mining potential of substances such as nickel, vanadium, phosphates and gold, among others. The country’s known nickel deposits are located in the Musongati, Waga and Nyabikere complexes. The Musongati complex is, for instance, considered the most significant laterite deposit and is among the ten largest undeveloped laterite deposits worldwide with a reserve of 220 million metric tons at 1.5% of nickel content. If well managed, exploiting these mining riches could be a game-changer for Burundi's development.
Overall, Burundi's economy has undergone a gradual shift from the agriculture sector to the service sector, which now makes the largest contribution to GDP. However, this structural transformation pattern is not specific to Burundi; most African countries follow the same path.
Chart 6 shows the trends in the size of the generally large informal sector in Burundi. According to the International Labour Organization (ILO), Burundi's informal economy accounts for 93.5% of the jobs in the country. The large informal sector affects the population as it generally involves precarious working conditions that offer lower earning potential without social protection. There are only a few job opportunities in the tiny, formal private sector in Burundi. Formal employment is concentrated in the public sector, which employs more than 75% of the country's formal workers, accounting for almost one-third of overall non-farming wage employment.
In 2019, the size of the informal economy was estimated at 35% of the country's GDP (US$0.97 billion), and by 2043 it it will modestly decline to 31.6%, which is above the projected average of 27.4% for low-income countries in Africa. Although the informal economy provides a safety net for the country's large, growing working-age population, pervasive informality impedes economic growth and makes the country's economy more fragile. Transitioning from the informal to the formal sector will increase fiscal revenue by expanding the tax base and allowing more people to benefit from better wages and redistributive measures. Burundi authorities could achieve this by reducing the obstacles to registering a business, tackling corruption and strengthening vocational training to enable informal workers to acquire the skills they need to access the formal economy. Accelerating access to broadband and the adoption of modern technology could also help formalise the informal sector.
Burundi: Current Path and sectoral scenarios
Download to pdf- Briefly
- Governance: Current Path vs scenario
- Demographics and Health: Current Path vs scenario
- Education: Current Path vs scenario
- Large Infrastructure and Leapfrogging: Current Path vs scenario
- Agriculture: Current Path vs scenario
- Manufacturing: Current Path vs scenario
- AfCFTA: Current Path vs scenario
- Financial Flows: Current Path vs scenario
This section provides an overview of the key characteristics of Burundi along its likely (or Current Path) development trajectory and the impact of a single positive scenario in eight separate sectors (Chart 7).
The Current Path is a dynamic scenario that imitates the continuation of current policies and environmental conditions. The Current Path is, therefore, in congruence with historical patterns and produces a series of dynamic forecasts endogenous in relationships across crucial global systems.
The eight sectoral scenarios are on: Governance, Demographics and Health, Education, Large Infrastructure/Leapfrogging (consisting of the impact of renewables, ICT and the more rapid formalisation of the informal sector), Agriculture, Manufacturing, AfCFTA (the implementation of the African Continental Free Trade Area), and Financial Flows (consisting of aid, FDI, remittances and a proxy on illicit financial flows). The interventions in each scenario are benchmarked to present an ambitious but reasonable aspiration for countries at similar levels of development.
Chart 8 depicts the structure of the Governance scenario.
The Governance scenario represents reasonable but ambitious improvements in security, capacity and inclusion in Burundi. The scenario reduces the risk of regime instability, lowers the levels of internal conflict and societal violence, reduces corruption (thus providing more transparency), improves the level of democracy, increases economic freedom, enhances governance effectiveness and increases gender empowerment.
Good governance is key to economic progress. Greater security and stability at the national level creates an enabling environment for domestic and foreign investment. It also creates conditions in which governments can pursue effective sustainable development strategies.
Weak governance, conflicts and political instability have stunted development progress in Burundi. Since independence, the country has changed leadership 11 times, with six of these through military coups. Recurrent instability has led to displacement, disruptions in livelihoods and human capital formation, losses of assets, deterrence of potential FDI and tourism, destruction of infrastructure and losses in human life.
The evolution of the public sector has also been driven to a significant extent by patronage rather than by meritocratic criteria. Poor governance undermines the state's ability to provide security for citizens, deliver social services, manage public investments, or encourage agricultural and other private sector growth. Corruption, abuses of the judicial system, lack of security and access to the judicial system, and criminality are all major concerns. Indeed, according to the 2020 Ibrahim Index of African Governance (IIAG) report, Burundi is one of the countries with the greatest governance challenges in Africa. In the report, a score of 100 indicates the full provision of political, social and economic public goods and services that a citizen expects from the government, and the state has responsibility to deliver to its citizens. Burundi scored 36.9, and it ranked 44th of 54 African countries. Corruption is systemic in Burundi. According to the global Corruption Perceptions Index (CPI) 2021 by Transparency International, Burundi, with a score of 19 out of 100, was ranked 169th of the 180 countries surveyed. This high level of corruption undermines government effectiveness in service delivery. With a score of 1.2 out of a maximum of 5 in 2020, Burundi ranked 41st of 54 countries in Africa in terms of government effectiveness as measured by the World Bank.
On the Current Path, Burundi’s government effectiveness score will slightly increase to 1.5 (out of 5) by 2043, which is below the projected average score of 1.8 for low-income African countries. In sum, governance, stability and security indicators are weak in Burundi. While addressing the general debate of the UN General Assembly’s 76th session in 2021, President Ndayishimiye said that ‘the fight against corruption, economic embezzlement and the fight against impunity are among the priorities of the Government.’
Chart 9 represents the composite governance index in the Current Path and the Governance scenario, from 2019 to 2043.
In our modelling, governance is conceptualised along three dimensions – security, capacity and inclusion – reflecting the traditional sequencing of the state formation process.
The score for each dimension of governance ranges from 0 (bad) to 1 (good). The first dimension, security, measures the probability of intrastate conflict and the general level of risk. The second dimension, capacity, is related to government revenue, corruption, regulatory quality, economic freedom and government effectiveness. The third dimension, inclusiveness, measures the level of democracy and gender empowerment.[1For the purposes of modelling and measuring governance in IFs, Hughes et al use modernisation theory and the notion that governance historically develops through three sequential transitions: a security transition, followed by a capacity transition, and finally a transition towards greater inclusion. Although Africa did not follow this pattern of state formation, the three transitions provide a useful analytical lens through which to view governance. To this end, IFs includes an index (0 to 1) for each dimension, with higher scores indicating improved outcomes. A composite governance index is a simple average of the three. BB Hughes et al, Patterns of Potential Human Progress: Strengthening Governance Globally, Boulder: Oxford University Press, 2014, 6.]
Burundi performed poorly in terms of capacity compared to other dimensions of governance. In addition, the political crisis in 2015 has curtailed aid flows to Burundi as Western countries — led by the European Union (EU), the United States (US), Belgium and the Netherlands — withheld aid to Burundi in an attempt to prompt the late president into negotiating with the opposition. The result was a significant reduction in government revenue which reduced government capacity to deliver public services.
The change of leadership in 2020 has led to a more moderate political tone, improved relations with donors and a slight reduction in anti-democratic tendencies. Thus, on the Current Path, Burundi will make progress in all the three dimensions of governance. As a result, Burundi's score on the composite governance security index, which is a simple average of the three dimensions of governance mentioned above, will be about 20% higher in 2043 than its level in 2019 (Chart 9). In the Governance scenario, the overall governance performance of Burundi is nearly 20% higher than the Current Path for the same year, and 9% above the average for low-income African countries.
This section presents the Current Path of demographics and health for Burundi and the impact of a scenario that aims to improve health and hasten and increase the size of the demographic dividend.
Chart 10 shows the population structure in the Current Path from 1990 to 2043.
The characteristics of a country's population can shape its long-term social, economic and political foundations. Burundi is a densely populated, poor and highly fragile country. The population is composed of three ethnic groups: the Hutu majority (85% of the population), the Tutsi (14%) and a very small Twa minority (1%). This diversity is an important factor in political, social and cultural terms and has evolved into an important source of tensions and conflict in the country. The population is predominantly Christian (60% Roman Catholic). Rundi (Kirundi), a Bantu language that is the standard medium of communication throughout the country, and French are the official languages.
The population of Burundi is growing rapidly, as shown in Chart 10. The fertility rate was 5.2 children per woman in 2019 (the eighth highest in Africa), down from 7.4 in 1990. The sharp rise in population has increased population densities and exacerbated development challenges. On the Current Path, the population will almost double by 2043 to 22.4 million. Population growth in Burundi is driven by high fertility rates, low access to modern contraceptives, limited education in family planning and limited access to healthcare facilities.
Chart 11 presents the population distribution.
Burundi is heavily populated. It has one of the highest population densities in Africa, estimated at about 4.6 people per hectare, which is well above the African average of 0.44 people per hectare. Urban centres are rare, the exceptions including Gitega in the central part of the country, Muyinga and Ngozi in the north, and Bujumbura, the largest city, sprawled along the northern tip of Lake Tanganyika (Chart 11).
Chart 12 shows the trends in urbanisation in Burundi. The country has the second-highest proportion of rural population in the world, after Papua New Guinea, and it is therefore the least urbanised country in Africa. In 2019, only 13.4% of the population lived in urban areas. However, from a low base, the urban population is rapidly growing at almost 6% per year — the highest in Africa. On the Current Path, 20% of the population will likely reside in the cities by 2043, meaning that the country will remain predominantly rural over the forecast horizon.
The Demographics and Health scenario consists of reasonable but ambitious reductions in child and maternal mortality ratio, increased access to modern contraception, reductions in the mortality rate associated with both communicable diseases (e.g. AIDS, diarrhoea, malaria and respiratory infections) and non-communicable diseases (e.g. diabetes), as well as improvements in access to safe water and better sanitation.
See Chart 29 for the impact of the Demographics and Health scenario on GDP per capita and Chart 30 for the impact of the scenario on extreme poverty.
Chart 14 shows the demographic dividend in the Current Path and the Demographics and Health scenario, from 2019 to 2043.
Demographers typically differentiate between a first, second and even third demographic dividend. We focus here on the first dividend, namely the contribution of the size and the quality of the labour force to incomes. It refers to a window of opportunity when the ratio of the working-age population (between 15 and 64 years of age) to dependants (children and elderly people) reaches at least 1.7 to 1.
A steady decline in fertility is critical to accelerating the demographic transition. In the Demographics and Health scenario, the fertility rate is 2.6 births per woman by 2043 compared to 3.7 on the Current Path in the same year. In addition, on the Current Path, the ratio of working-age people to dependants will improve slowly from 1.1 to 1 in 2019 to about 1.5 to 1 by 2043. This is below the minimum threshold of 1.7 to 1 at which point a country can expect to experience a demographic dividend, provided other enablers such as appropriate education and potential job opportunities are also available. Whereas Burundi only gets to this positive ratio around 2055 in the Current Path, the ratio of working-age people to dependants is 1.7 to 1 by 2041 in the scenario, i.e. 14 years earlier than the Current Path.
Fewer dependants to take care of frees up resources for investment in physical and human capital formation and eventually increases labour force participation, particularly that of women.
Chart 15 shows the infant mortality in the Current Path and the Demographics & Health scenario, from 2019 to 2043.
The efficacy of a country’s health system can be evaluated by several indicators such as maternal mortality, life expectancy and infant mortality.
Even though it is still high, Burundi has made progress in reducing infant mortality from 100 deaths per 1 000 live births in 1990 to 50 in 2019. Donor interventions in prevention and treatment of common childhood illnesses, and birth preparedness and maternal services have contributed to this result. However, the country is not on track to achieve the SDG target of 12 deaths per 1 000 live births by 2030. On the Current Path, the infant mortality rate will be 40 deaths per 1 000 live births by 2030 and 29 deaths by 2043. The Demographics and Health scenario will lead to a more rapid reduction in infant mortality to 29 deaths per 1 000 live births in 2030 and 17 deaths in 2043.
Improving health outcomes and accelerating the demographic transition could generate increased per capita incomes and reduce poverty in Burundi (see Chart 29 and Chart 30).
Chart 16 show the structure of the Education scenario.
The Education scenario improves the quantity and quality of education in Burundi. It represents reasonable but ambitious improved intake, transition and completion rates from primary to secondary and tertiary levels and better quality of education at primary and secondary levels. It also models substantive progress towards gender parity at all levels, additional vocational training at the secondary school level and increases in the share of science and engineering graduates to provide skilled labour to the economy.
The education system in Burundi has a structure of six years of primary education, seven years of secondary education divided into four years of lower secondary and three years of upper secondary school, and three to five years of tertiary education.
Since the introduction of the free primary education policy in 2005, Burundi has made significant progress in terms of the quantity of education, especially at primary level. The literacy rate of the youth has significantly increased from 62% in 2008 to 88% in 2017, placing Burundi among the top 20 countries in Africa. The gross enrolment rate for primary education stood at 128% in 2018, while the net primary school enrolment was 92.8% without significant variation between provinces, gender or socio-economic background.
However, significant challenges remain. While education completion rates have significantly improved, they remain below the sub-Saharan Africa average and low-income African countries average: four out of 10 children do not complete primary school and seven out of 10 do not finish secondary school. Out of school children have declined from 44% in 2010 to 39% in 2017, but the number remains high (almost 2 million). The tertiary enrolment is also very low, at 6% in 2017, but on par with the average for African low-income countries. This situation is explained by several factors, such as insufficient educational infrastructure and teachers’ and parents’ lack of resources to meet costs related to educating children.
While inequalities in the education system are minor at primary education level, they are high at secondary and tertiary levels. For instance, out of every 100 children who reach post-basic education, seven come from the poorest households and 49 from the wealthiest. Finally, urban and more affluent households obtain seven and ten times more educational resources than rural and poorer households, respectively. Females are also less likely to attend higher education than males. Burundi has achieved gender parity in primary and secondary enrolment; however, the gender parity ratio for tertiary enrolment was only 0.39 in 2019. On the Current Path, the gender parity ratio for tertiary enrolment will improve to 0.82 by 2043.
The quality of education in Burundi is also low. While performance is relatively good at the start of schooling (Grade 1 and Grade 2 of primary education), it struggles to reach desirable levels from Grade 4. According to the PASEC 2019 (Programme d'analyse des systèmes éducatifs de la CONFEMEN) report, in Grade 6 of primary education, fewer than 30% of students score above the minimum skills threshold in reading, and just 60% achieve the minimum score in mathematics — a significant drop from 2014. In addition, there is a disconnect between graduates' skills and the job market's needs. The technical and vocational education and training (TVET) sector is neglected. As of 2016, only 7% of students were enrolled in TVET. According to UNESCO, Burundi is one of the countries in sub-Saharan Africa with the least funding for its TVET sector. The government should build an effective and sustainable TVET system to provide skilled labour to the economy.
In Burundi's NDP, developing a skilled workforce is viewed as a priority for improving the country's socio-economic prospects.
Chart 17 presents the mean years of education in the Current Path and the Education scenario, from 2019 to 2043.
The average years of education in the adult population (aged 15 years and older) serves as a good first indicator of the stock of education in society. In 2015 (the last year of available data), the average years of schooling for adults aged 15 years and over was 4.1 years in Burundi, which is below its neighbours Tanzania (6.1 years), Rwanda (4.4 years), and on par with DR Congo and the average for African low-income countries.
When disaggregated by gender, males have on average 4.6 years and females 3.7 years of schooling. This means that most adults in Burundi have not completed primary education. On the Current Path, the average years of education for adults 15 years and older will likely be six years by 2043, 0.5 years lower than in the scenario.
See Chart 29 for the impact of the Education scenario on GDP per capita and Chart 30 for the impact of the scenario on extreme poverty.
Chart 18 depicts the structure of the Large Infrastructure/Leapfrogging scenario.
Infrastructure shortage is one of the significant constraints to the modernisation of the Burundian economy. In 2020, Burundi ranked 39th out of 54 African countries on the African Infrastructure Development Index (AIDI) with a score of 15.9 out of 100. Poor coverage and low-quality infrastructure in Burundi increase transaction costs and lower the return on capital and work, discouraging domestic and foreign investment and constraining economic growth. In the agriculture sector, for instance, it is estimated that transport costs represent, on average, 35% of import prices and 40% of export prices.
Despite the abundant hydroelectric potential, Burundi has Africa's second-lowest electricity access rate, only ahead of South Sudan. As of 2020, only 11.7% of the country's total population had access to electricity compared to 34% for the average for low-income Africa and 42% for the average for global low-income peers. And for those connected to grid power, supply remains unreliable mainly. Electricity demand significantly exceeds capacity, and the old, poorly maintained transmission system leads to rolling blackouts and outages. There is also a significant rural–urban disparity in terms of electricity access. In 2019, 62.7% of the population in urban areas had access to electricity, while only 3.1% of people in rural areas had access. On the Current Path, the national electricity access rate will improve modestly to 20.5% by 2043.
Burundi's transport infrastructure is also inadequate. The country mainly depends on road transport for the transportation of goods and services and has a crumbling road network of about 12 300 km, of which about 10% is paved. The communication infrastructure bottleneck also limits Burundi's growth potential. Mobile phone subscriptions in Burundi stood at about 57 per 100 people in 2019 — below its neighbours Rwanda (72) and Tanzania (70) but above DR Congo (43). The mobile broadband subscriptions per 100 people stood at 27 in 2019, compared to an average of 19 for low-income Africa. It will be at 153 by 2043.
Fixed broadband provides faster Internet access speeds with more secure connections and is important for high value-add service sectors. However, fixed broadband penetration in Burundi is strikingly low, with a subscription rate of 0.03 per 100 people, below the average of 0.2 for African low-income. On the Current Path, fixed broadband subscriptions will be 16 per 100 people by 2043.
To overcome difficulties associated with the poor telecom infrastructure, the government of Burundi has supported a number of prominent telcos in building a national fibre backbone network. This network offers onward connectivity to submarine cable infrastructure landings in Kenya and Tanzania. The first sections of this network were switched on in early 2014, and additional provinces have since been connected. In addition, in early 2018 the government kick-started the Broadband Burundi project, which aims to deliver national connectivity by 2025.
In sum, the infrastructure deficit, especially poor access to electricity and the lack of a good road network, is cited as the most significant obstacle to expanding the small private sector in the country. The NDP 2018–2027 identifies infrastructure development as one of the key pillars to structurally transform the Burundian economy for robust, sustainable, resilient and inclusive growth.
The Large Infrastructure and Leapfrogging scenario addresses these issues. It represents reasonable but ambitious investment in road infrastructure, renewable energy technologies and improved access to electricity in urban and rural areas. The scenario also includes accelerated access to mobile and fixed broadband and the adoption of modern technology that improves government efficiency and allows for the more rapid formalisation of the informal sector.
As a result of limited access to electricity, many households rely on firewood and charcoal (traditional cookstoves) for energy. It is estimated that about 90% of the population in Burundi uses charcoal for domestic use. This poses a risk to the environment with the acceleration of deforestation and poor air quality that negatively affects people’s health by causing respiratory problems. Reports estimate that in 30 years the forest cover in Burundi could be erased and major environmental problems will continue to threaten the country due to soil degradation and exhaustion, forest resource degradation and human environmental degradation if urgent action is not taken.
Chart 19 shows traditional cookstoves usage trends in the Current Path and Infrastructure/Leapfrogging scenario. As of 2019, 95% of the households in Burundi were using traditional cookstoves. On the Current Path, it is projected to decline slightly to 92% by 2043. However, in the Infrastructure/Leapfrogging scenario, it is forecast to be 86% (six percentage points lower than the Current Path forecast). The share of households using modern fuel cookstoves is 13% by 2043, almost double the Current Path forecast of 8% in the same year. These findings imply that increasing access to energy/electricity and/or off-grid renewable energy solutions, especially in rural areas, could contribute to forest protection and reduce emissions by shifting households away from traditional cooking methods to modern ones.
Chart 20 presents the rural road access in the Current Path and the Large Infrastructure and Leapfrogging scenario, from 2019 to 2043.
Access to rural roads reduces transportation time and cost and facilitates agricultural commercialisation. Poor rural road connectivity to markets may push farmers to continue to produce solely for their households’ consumption as they are unsure whether they can sell the crop in the market. Given the large rural population, improving access to rural access roads will promote positive economic impacts such as improved rural incomes, increased agricultural productivity and food security, and increased participation in the economy. Additional mobility and connectivity for rural population groups will also have other positive social impacts, such as reducing the high maternal mortality rate and improving paediatric health by means of easier access to critical services (for example, healthcare facilities).[2AfCAP, Climate adaptation: Risk management and resilience optimisation for vulnerable road access in Africa, February 2019.]
As shown in Chart 20, in 2019 the share of rural population within 2 km of an all-weather road was estimated at 38.2%, and it will reach 40.5% by 2043. As a result of investment in road infrastructure, in the Large Infrastructure and Leapfrogging scenario, it will be about 42% — 1.5 percentage points above the Current Path in 2043.
See Chart 29 for the impact of the Large Infrastructure and Leapfrogging scenario on GDP per capita and Chart 30 for the impact on extreme poverty.
Chart 21 presents the structure of the Agriculture scenario.
The Agriculture scenario represents a reasonable but ambitious improvement in agriculture productivity. To this end, it increases crop yields per hectare (reflecting better management and seed and fertiliser technology), increases land equipped and under irrigation, and reduces food loss and waste. It includes an increase in calorie consumption, reflecting the prioritisation of food self-sufficiency above exports as a desirable policy objective. The scenario also increases forest protection for sustainable land practice.
The agriculture sector in Burundi is the main source of livelihood for the majority of the population. Although its contribution to GDP has declined over time, it still provides income for about 86% of the population and remains the main supplier of raw materials to the country's agro-industry.
Heavy dependence on rain-fed agriculture increases the country's humanitarian, social and macroeconomic vulnerabilities to rising temperatures and extreme weather shocks. Burundi’s location in the Great Lakes area makes it prone to cycles of flooding and drought, and with low irrigation penetration, the sector is particularly vulnerable to rainfall variability. Climate change has already increased the frequency and severity of floods and droughts in recent years. Since the turn of the century, the country has faced 34 flooding and drought events directly affecting an estimated 3.2 million people. The 2005/2006 droughts caused particular devastation when crop failures led to food shortages especially in the eastern provinces.
Around half of Burundi's land area is considered cultivable and about one-third is suitable for pasture. Staple food crops include beans, corn (maize), cassava and sorghum, and cash crops include coffee, cotton and tea. However, the low productivity in the sector — driven by poor farming practices, insecure property rights over land and climate-related shocks — limits economic growth and poverty reduction and increases food insecurity. Burundi ranked last on the 2022 Global Hunger Index. Domestic production cannot meet the population's nutritional needs demand despite the country’s fertile land and the fact that most of the workforce work in agriculture. Many Burundians face hunger and undernutrition. It is estimated that chronic malnutrition costs Burundi about US$102 million per year.
In 2019, the average crop yield was estimated at 5.6 tons per hectare, which is above the average of 2.7 tons for low-income Africa. The average crop yield in Burundi will rise modestly to 6.6 tons per hectare by 2043, meaning that agriculture production will remain sluggish and undoubtedly be insufficient to meet the nutritional needs of the growing population, which is estimated to almost double by 2043.
Boosting agricultural productivity would not only raise the incomes of farm households, which account for more than 50% of the country's population, but it would also lower food costs for the non-farming population and pave the way for agro-industry development. To revive agricultural production and reduce the food deficit, the government of Burundi has adopted a National Agricultural Investment Plan (PNIA), divided into 16 Provincial Agricultural Investment Plans (PPIAs). Thus, a national fertiliser subsidy programme (PNSEB), a subsidy programme for selected seeds, the reorganisation of certain crops (coffee, tea, cotton, rice) into sectors and organisational and institutional reforms have been implemented. In the current NDP 2018–2027, modernisation of the agriculture sector is a critical pillar of achieving the country's development objectives.
The agricultural production and demand data in our modelling initialises from data provided on food balances by the Food and Agriculture Organization (FAO). The model contains data on numerous types of agriculture but aggregates its forecast into crops, meat and fish, presented in million metric tons. Chart 22 shows the agriculture import dependence in the Current Path and Agriculture scenario for Burundi from 1990 to 2043.
On the Current Path, the agriculture import dependence will continue to increase to 53.7% of total demand in the country by 2043. If the Agriculture scenario, agricultural production will significantly increase such that the country will record an agricultural surplus by 2037. By 2043, the agricultural surplus in the scenario will represent 6.6% of total demand. This can potentially raise farmers' incomes, but it will also increase food security and foreign reserves and provide input for the agro-industry.
See Chart 29 for the impact of the scenario on GDP per capita and Chart 30 for the impact of the scenario on extreme poverty.
Chart 23 depicts the structure of the Manufacturing scenario.
Agriculture is crucial for the economy of Burundi, but increasing agricultural productivity alone will not be enough to achieve sustainable growth and poverty reduction. Diversifying the economy from agriculture to high productivity sectors such as manufacturing is important for economic resilience.
The manufacturing sector in Burundi is underdeveloped — almost all manufactured consumer goods are imported. The sector is limited to small-scale processing, its contribution to the GDP remains low at about 15% of GDP and it employs about 2% of the population. In 2021, Burundi ranked 51st of 52 countries on the African Development Bank's African Industrialisation Index, which measures African progress in industrialisation. Beer brewing, jointly owned by the Dutch and the government, is a key industry that contributes up to 40% of government revenue. According to the Burundi Manufacturers Association, of the 82 manufacturing companies, 45% are owned by private companies, 28% by foreign companies and 27% by the government. The manufacturing sector produces diverse products including cement, cosmetics, glass, textiles and agricultural fertilisers of which about 90% are locally consumed and 10% are exported.
Industrialisation is a foundation for inclusive growth, the creation of decent jobs and many other development goals. This is recognised by the NDP 2018–2027 as industrialisation is one of the pillars to structurally transform the Burundian economy for robust, sustainable, resilient and inclusive growth, thereby creating decent jobs for all and leading to improved social welfare.
Industrialisation or economic transformation is a long-term process. It requires constructive relationships with the state encouraging and supporting the private sector. Firms need a government that has strong capabilities in setting an overall economic vision and strategy, efficiently providing supportive infrastructure and services, maintaining a regulatory environment conducive to entrepreneurial activity, and making it easier to acquire new technology and enter new economic activities and markets. The government of Burundi has undertaken several reforms in recent years to promote industrial development. These reforms have focused on: (i) improving the business climate; (ii) developing of the private sector; (iii) simplifying procedures for establishing and creating companies, (iv) protecting industrial property; (v) encouraging the use of ICT; and (vi) enacting the new investment code. However, the sector still faces several challenges, including: (i) the shortage of economic infrastructure (energy, transport, ICT, etc.); (ii) access to financial resources; (iii) and a tax policy favourable to industrial development.
The Manufacturing scenario represents reasonable but ambitious manufacturing growth through greater investment in the manufacturing sector, research and development (R&D) and improvement in government regulation of businesses. It increases total labour participation rates with a larger increase in female participation rates where appropriate. It is accompanied by an increase in welfare transfers (social grants) to unskilled workers to moderate the initial increases in inequality which is often associated with industrialisation. Rapid structural transformation may entail a trade-off between growth and inequality, which is called the developer’s dilemma. The welfare transfers are funded by increased taxes on skilled workers.
Chart 24 presents the value added by the manufacturing sector in the Current Path and the Manufacturing scenario, from 2019 to 2043.
The manufacturing sector accounted for about 15% (0.44 billion) in 2019, and on the Current Path it will increase to 22.7% of GDP (US$1.75 billion) by 2043. In the Manufacturing scenario, Burundi makes substantial progress in industrialisation such that, by 2043, the share of the manufacturing sector in GDP is about 28% of GDP (US$2.35 billion) — more than five percentage points of GDP or US$0.6 billion above the Current Path.
See Chart 29 for the impact of the Manufacturing scenario on GDP per capita and Chart 30 for its impact on extreme poverty.
Chart 25 presents the structure of the AfCFTA scenario.
The AfCFTA scenario models the impact of the full implementation of the AfCFTA by 2034. The scenario increases exports in manufacturing, agriculture, services, ICT, materials and energy. It also includes a reduction in tariffs for all sectors and an improvement in productivity growth as a result of competition and technology diffusion emanating from trade liberalisation.
The trade pattern of Burundi is similar to that of many other African countries that rely on a few key commodity exports while importing higher-value manufactured goods, consumer items and foodstuffs. The country is open to global trade with a foreign trade to GDP ratio of 32.9% in 2020 but has not made progress in export diversification. Coffee and tea remain the key exported products, accounting for more than 80% of total exports.
Burundi's trade balance is structurally in deficit, and this persistent negative net export balance has been a drag on its economic growth. In 2020, the trade deficit was equivalent to 22.8% of GDP — a slight decline compared to its pre-COVID-19 level of 23.6% of GDP. This trend will continue on the Current Path in the coming years. This situation is mainly due to the country's narrow export base and large imports of manufactured goods and fuel, its poor manufacturing sector and a lack of diversity in the tertiary sector. In 2020 and 2021, due to the COVID-19 pandemic and weak global demand, exports decreased while imports of medical products increased, deteriorating the trade balance. Burundi's external sustainability has further worsened amid higher food and energy prices, combined with the depreciation of the Burundian currency (Burundian franc) and foreign exchange shortages.
Export potentials exist in the agriculture sector (coffee and tea), mining (gold and nickel) and tourism sectors, but they are still underdeveloped. Efforts to harness export potential in these sectors could reduce the trade balance and ease pressure on foreign reserves. The NDP 2018–2027 aims to reduce import dependence by boosting the domestic production of goods and services with the modernisation and diversification of agricultural production, and support to agribusiness industries. The full implementation of the African Continental Free Trade Area (AfCFTA) could contribute to achieving this objective, and boost and diversify Burundi's exports.
Chart 26 presents Burundi's trade balance in the Current Path and AfCFTA scenario from 2019 to 2043.
Burundi's trade balance is structurally negative — a trend which is likely to persist over the forecast horizon. On the Current Path, the trade deficit will likely be equivalent to 48.3% of GDP by 2043, which is significantly higher than its level of 23.6% in 2019. In the AfCFTA scenario, where trade restrictions are loosened and productivity is increased, Burundi will not record a trade surplus or be a net exporter; however, its trade deficit can significantly improve from a deficit equivalent to 48.3% of GDP in the baseline scenario (Current Path) by 2043 to only 12.6% of GDP. The AfCFTA represents a major opportunity for African countries, including Burundi, to overcome the constraints of narrow domestic markets to boost exports. In the AfCFTA scenario, the value of Burundi's total export is about US$2.2 billion larger than the Current Path in 2043. These gains will, however, require major efforts to reduce the burden on businesses and traders to cross borders quickly and safely and with minimal interference by officials.
Chart 27 shows the structure of the Financial Flows scenario.
The Financial Flows scenario represents a reasonable but ambitious increase in external capital flows to Burundi. Specifically, the scenario increases inward flows of worker remittances and aid flows to Burundi and an increase in the stock of FDI and additional portfolio investment inflows. It also reduces outward financial flows to emulate a reduction in illicit financial outflows.
Burundi depends heavily on aid for fiscal revenues, investments and foreign reserves. Official development assistance (ODA) accounts for about 50% of the country's annual budget. Burundi ranks fourth in Africa for aid received as a percentage of GDP. However, aid flows to Burundi have been volatile over time. ODA decreased during the civil war, especially in 1996/1997 due to the sanctions imposed on the country after the military coup. After the Arusha Peace and Reconciliation Agreement, Burundi won back aid, which increased steadily to reach a peak of 40% of GDP in 2004. However, aid dropped again in the aftermath of the global financial crisis and in the run-up to the 2010 elections. The decline persisted after the 2010 elections due to concerns over financial scandals and governance. Overall, between 2004 and 2014, aid flows to Burundi more than halved — from 40% of GDP to 19%.
The political crisis in 2015 caused a further decline in aid inflows to 11% of GDP, as Western countries — led by the EU, the US, Belgium and the Netherlands — withheld aid to Burundi, in an attempt to prompt the late President Nkurunziza into negotiating with the opposition. As a result, Burundi experienced economic difficulties characterised by fiscal deficit, a shortage of foreign reserves and current account deficit. With the change of leadership, levels of aid to Burundi are again slowly increasing. For instance, earlier in 2022, the US and the EU resumed aid flows amounting to US$12 million after easing the crippling sanctions imposed in response to the explosion of political violence. On the Current Path, aid (as a percentage of GDP) will decline from 19.5% in 2019 to 12.3% by 2043.
In addition to aid, the government of Burundi is generally seeking to attract foreign investment to promote economic growth and industrialisation, but actual levels of FDI are miniscule. According to UNCTAD's 2021 World Investment Report, FDI inflows into Burundi increased exponentially from US$1 million in 2019 to US$6 million in 2020, despite the global economic crisis triggered by the COVID-19 pandemic. In recent years, the government has made some progress in terms of improving the business climate. Foreign investors enjoy the same rights as domestic ones. There are no general limits on foreign ownership or control, and foreign investments are not subject to any screening mechanism. However, in the mining sector, at least 10% of the shares must be owned by the government, and foreign investors are required to make an initial investment of US$50 000, whereas local investors are not subject to this rule.
In 2020, Burundi ranked 166th out of 190 economies in the Doing Business report. Political instability, cumbersome administrative procedures, ambiguous trade policies, poor infrastructure, corruption, low-skilled labour and lack of foreign exchange all limit FDI flows to the country. On the Current Path, FDI flows to Burundi will increase from 0.04% of GDP in 2019 to about 1.5% by 2043.
Many Burundians living abroad also send money back home (remittances), albeit significantly less than migrants from other countries in the region. For instance, in 2016, the average Burundian living abroad sent home US$140, whereas Tanzanians living abroad sent an average of US$1 448 and Kenyans abroad sent as much as US$1 593. It is possible, however, that these official statistics may be misleading, as a significant share of remittances to Africa occur via informal channels. In addition to their contribution to poverty reduction and human development, remittances tend to be less volatile to economic downturns than FDI and portfolio investment and, hence, may help reduce the striking lack of foreign exchange reserves in the country. In sum, remittances are a critical economic stabiliser and should thus be encouraged and facilitated.
An increase in foreign financial flows can bring considerable economic benefits to Burundi and reduce its persistent balance of payment difficulties.
Chart 28 shows government revenue in the Current Path and the Financial Flows scenario, from 2019 to 2043.
In the Financial Flows scenario, government revenue increases to reach 25.6% of GDP by 2043 (US$2.1 billion), up from 19.6% in 2019. This is 3.3 percentage points of GDP above the Current Path of 22.3% (US$1.7 billion) in the same year. Several reasons might explain the positive association between capital inflows and current government revenue. The first is direct because the government of Burundi relies heavily on donors for its budget. More aid means more revenue for the government to provide public services. Another is indirect: higher inflows are associated with higher tax revenue because foreign direct investors tend to have good tax compliance habits or are subject to natural resource taxes. Higher inflows could also be associated with higher economic growth and therefore higher government revenues.
See Chart 29 for the impact of the scenario on GDP per capita and Chart 30 for the impact of the scenario on extreme poverty.
Impact of sectoral scenarios on key indicators
Download to pdfChart 29 presents GDP per capita (PPP) in the Current Path and the scenarios, from 2019 to 2043.
All scenarios improve Burundi’s GDP per capita above the Current Path, as shown in Chart 29. With a GDP per capita (PPP exchange rate, US$ 2017) of US$655 in 2019, Burundi had the lowest GDP per capita in Africa. On the Current Path, the per capita income will increase to US$1 027 by 2043; however, it is still the lowest in Africa in the Current Path for other countries.
In the short to medium term, the Agriculture scenario has the greatest impact on GDP per capita, implying that efforts to improve agricultural productivity are the most viable ways to improve the living standards of Burundians until 2038. However, by 2043, the scenario with the most significant improvement in GDP per capita relative to the Current Path is the Large Infrastructure and Leapfrogging scenario, followed closely by the Governance and Agriculture scenarios.
In the Large Infrastructure and Leapfrogging scenario, GDP per capita will rise to US$1 169 by 2043 — a US$142 increase relative to the Current Path for the same year. Infrastructure cuts across all the sectors as development and improvement of infrastructure reduces transaction costs and increases return on capital with positive effect on private investment and growth.
In the Governance scenario, by 2043 the GDP per capita will increase to US$1 155 by 2043, an increase of US$128 above the Current Path, while the Agriculture scenario increases the GDP per capita by US$124 relative to the Current Path to reach US$1 151. Trade liberalisation in Africa will help countries overcome the constraints of narrow domestic markets to increase exports. It will also increase productivity through competition and technology diffusion, and ultimately increase economic growth. In the AfCFTA scenario, the average Burundian gets an additional US$118 compared to the Current Path in 2043. This indicates that the full implementation of the AfCFTA could result in economic growth rates that are above the forecast in the business-as-usual scenario in Burundi.
In the Demographics and Health scenario, Burundi’s GDP per capita will increase to US$1 118 by 2043. This is an increase of US$91 compared to the Current Path. The Manufacturing and Financial Flows scenarios, respectively, raise Burundi’s GDP per capita by US$65 and US$39 above the Current Path in 2043. The Education scenario has the least impact on average income. It only increases GDP per capita by US$16 relative to the Current Path by 2043, though this is not to say education should not be a priority to improve the future of Burundi. Human capital formation through education and improving the skills of the population are key enablers of the acceleration of the broad-based growth and development of a country. Education is vital for inclusive wealth creation as it improves the job and income prospects of poor people especially. However, these benefits take time to materialise. Investment in human capital affects labour productivity with a long time lag as it takes more than 15 years until output surpasses a programme that invests mainly in infrastructure, but its subsequent impact is enduring and increases over time.
There are numerous methodologies for and approaches to defining poverty. We measure income poverty and use GDP per capita as a proxy. In 2015, the World Bank adopted the measure of US$1.90 per person per day (in 2011 international prices), also used to measure progress towards achieving SDG 1 of eradicating extreme poverty. To account for extreme poverty in richer countries at slightly higher levels of income than in poor countries, the World Bank introduced three additional poverty lines in 2017:
- US$3.20 for lower-middle-income countries
- US$5.50 for upper-middle-income countries
- US$22.70 for high-income countries.
Chart 30 shows poverty in the Current Path and the scenarios from 2019 to 2043.
Poverty is endemic in Burundi. In 2019, the country had the third-highest extreme poverty rate globally after South Sudan and Madagascar. An estimated 74.6% of Burundians lived below the international poverty line of US$1.90 per day in 2019 — only a marginal decline (10 percentage points) from its average level of 85% in the 1980s. In 2021, the extreme poverty rate increased to 75.8%, mainly due to the shock of the COVID-19 pandemic. The extreme poverty rate in Burundi is almost double that of the average of sub-Saharan Africa, and about 30 percentage points above the average for Burundi’s income group peers on the continent.
Poverty in Burundi is more severe and highly concentrated in the rural areas. According to the World Bank, poverty in rural areas is over three times higher than in Bujumbura, the capital city, and almost twice as high as in other urban areas. This striking difference results from the combined effects of (i) the generalised disadvantage of the rural areas in terms of per capita consumption; (ii) the higher concentration of rural households in low-productivity agriculture activities and fishing as primary occupations; and (iii) the lower average education attainments of the rural population.
Another significant concern about poverty in Burundi is that an estimated 50% of the non-poor population is clustered just above the poverty line, that is to say within a range of about US$0.5 per capita per day above the international poverty line. Given the high levels of political, economic and environmental volatility the country faces, the likelihood of these people falling into extreme poverty as a result of a shock is extremely high. This is a considerable threat to Burundi’s prospects for poverty reduction.
On the Current Path, the extreme poverty rate in Burundi will likely remain high. It will decline to 61% (13.7 million people) by 2043 which is 14 percentage points lower than its current level but still the third highest in Africa.
The Governance and Agriculture scenarios contribute most significantly to reducing the extreme poverty rate by 2043. In the Agriculture scenario, the poverty rate will decline to 52.9% (equivalent to 11.8 million people) by 2043, compared to the Current Path forecast of 61% (13.7 million people). This translates to 1.9 million fewer poor people than the Current Path in 2043. Also, in the short term, the Agriculture scenario has the most significant impact on poverty reduction; for this reason, enhancing agriculture productivity through new technologies and innovations is crucial to reduce poverty in Burundi.
In the Governance scenario, the extreme poverty rate in Burundi will decline to 54.7% in 2043, which is equivalent to 1.5 million fewer poor people than the Current Path of 13.7 million poor people. Good governance as embodied, for example, in the control of corruption and the design and implementation of effective regulatory policies, significantly improves the ability of the poor to participate in and benefit from economic growth. Corruption, for instance, affects poor people by reducing the government’s ability to allocate public services in an efficient and equitable manner.
The Demographics and Health scenario has the third-lowest poverty rate. However, it has the lowest number of poor people by 2043 due to the smaller size of the population compared to other scenarios as the scenario reduces the total fertility rate in Burundi. The poverty rate in the Demographics and Health scenario will be 56.8% (11.7 million people) in 2043 — 4.2 percentage points lower than the Current Path, and 2 million fewer poor people than the Current Path. The Large Infrastructure and Leapfrogging, Manufacturing, Education and Financial Flows scenarios are much the same in reducing extreme poverty rate in Burundi by 2043 (Chart 30).
In the AfCFTA scenario, the poverty rate remains slightly below the Current Path between 2027 and 2034. However, between 2035 and 2043 (the end of the full implementation of the AfCFTA), the poverty rate in the AfCFTA scenario is above the Current Path. By 2043, in the scenario it will rise to 75.8% — nearly 15 percentage points above the Current Path in the same year. This implies that the economic growth that the full implementation of the AfCFTA is expected to generate in Burundi will likely not be inclusive (Chart 29).
Standard trade theory suggests that trade should contribute directly to reduce poverty in developing countries through the process of factor price equalisation, whereby trade increases the returns to the most abundant factor of production, which in developing countries such as Burundi tends to be low-skilled labour. However, empirical studies have produced mixed evidence. Workers in import-competing sectors in Burundi could suffer from layoffs due to intense competition following the full implementation of the AfCFTA. This would increase unemployment and poverty. Also, many studies conclude that the benefits of trade liberalisation in terms of poverty reduction are not automatic, but rather depend on good domestic policies. This implies that trade liberalisation could increase poverty in the absence of the right complementary policies. Policies could include carefully designed trade adjustment assistance programmes and training in new skills that would be valuable in the growing sectors of the economy. Burundian authorities could also target the most critical sectors for the poor through policies to increase their productivity and efficiency of trade.
In sum, the policy impact simulation exercise has shown that better governance and agriculture development and the acceleration of the demographic transition are the low hanging fruits to significantly reduce poverty in Burundi.
Chart 31 shows Burundi's carbon emissions in the Current Path and the Combined scenario, from 2019 to 2043.
The implementation of these scenarios will likely come at a cost to the environment and the various sectoral pathways will bear varying levels of carbon emissions, as shown in Chart 31.
By 2043, the AfCFTA and Agriculture scenarios will result in the greatest carbon emissions at 1.5 million tons, while the Demographics and Health scenario will result in lower carbon emissions compared to the Current Path. Agricultural modernisation is crucial for reducing poverty and accelerating economic growth but it will likely come at the cost of environmental degradation. The government of Burundi should therefore seek to accelerate agricultural development in an environmentally sustainable way.
The Combined Agenda 2063 scenario is a combination of all eight sectoral scenarios (Governance, Demographics and Health, Education, Large Infrastructure and Leapfrogging, Agriculture, Manufacturing, AfCFTA, and Financial Flows). It is an integrated development push scenario where Burundi authorities make a concerted effort to address the binding constraints on inclusive growth and development.
Chart 32 compares the size of the economy in the Current Path with the Combined scenario at market exchange rates (MER). The Combined scenario dramatically impacts the expansion of the Burundian economy. In the scenario, the GDP will expand from US$2.7 billion in 2019 to US$17.2 billion in 2043, which is a 537% increase over the period compared to a 185.2% increase on the Current Path. In 2043, the GDP of Burundi in the Combined scenario is US$9.5 billion larger than the Current Path. Thus, this scenario shows that a policy push across all the development sectors is necessary to achieve greater and sustained growth in Burundi.
Chart 33 presents GDP per capita in the Current Path and the Combined scenario from 2019 to 2043.
The Combined scenario has a much greater impact on GDP per capita compared to the individual thematic scenarios. By 2033, the GDP per capita of Burundi is US$304 larger than in the Current Path, and by 2043 it will come to US$1 909 (i.e. US$883 more than in the Current Path in that year). In 2043, the GDP per capita in the Combined scenario is almost double the Current Path, indicating that the scenario shows how an integrated push across all the development sectors could significantly improve the living standard of Burundians.
Our modelling uses data from the GTAP to classify economic activity into six sectors: agriculture, energy, materials (including mining), manufacturing, services and ICT. Most other sources use a threefold distinction between only agriculture, industry and services, with the result that data may differ.
Chart 34 compares the value added by sector in the Current Path and the Combined scenario from 2019 to 2043.
Implementing the Combined scenario will increase the value added of agriculture, manufacturing and services above the Current Path. In 2043, the agriculture value added in the Combined scenario is about US$1.7 billion, which is larger than the Current Path in the same year. The manufacturing and services value added are US$2.7 billion and US$4.5 billion, respectively, higher than the Current Path in 2043.
Implementing the Combined scenario can accelerate the structural transformation of the Burundian economy, with the share of the manufacturing sector of the GDP increasing from 16% in 2019 to 26% in 2043 — 3.3 percentage points of GDP above the Current Path in 2043. The share of the agriculture sector in GDP declines from 31% in 2019 to 16% in 2043. The service sector remains the dominant sector in the economy, although its contribution to GDP in the Combined scenario (50% in 2043) is lower than the Current Path of 54% in the same year.
Chart 35 shows extreme poverty in the Current Path and the Combined scenario from 2019 to 2043.
In the Combined scenario, by 2033, 55% of Burundians will be living in extreme poverty compared to 71% in the Current Path. This represents about three million fewer people living in extreme poverty compared to 12.4 million people in the Current Path. By 2043, the extreme poverty rate at the US$1.90 poverty threshold will decline to roughly 12.4% (2.5 million people) compared to 61% (13.7 million people) in the Current Path. Even though the Combined scenario does not completely eliminate extreme poverty in Burundi, its materialisation can have a dramatic impact on poverty reduction in the country. In 2043, the extreme poverty rate in the Combined scenario is about 49 percentage points below the Current Path, equivalent to 11.2 million fewer poor people than in the Current Path.
Chart 36 shows the trends in life expectancy in the Current Path and the Combined scenario from 2019 to 2043.
Despite an increase of 13 years between 2000 and 2019, at 61 years, life expectancy at birth in Burundi remains three years below the sub-Saharan African average and two years below the average for low-income African countries.
Burundi’s high communicable disease burden impedes progress in life expectancy. On the Current Path, life expectancy in Burundi will steadily increase to 67.5 years by 2043, which is almost seven years more than the current level. In the Combined scenario, the average Burundian can expect to live two years more at 69.5 years, which is on par with the projected average for global low-income countries and one year below the average for sub-Saharan Africa.
Chart 37 represents income inequality in the Current Path and the Combined scenario, from 2019 to 2043.
The Gini coefficient is a standard measure of the level of inequality. In contrast to the high poverty rate, inequality is relatively low in Burundi. With a Gini index estimated at 0.38 in 2019, the level of income inequality in Burundi is lower than the averages of 0.41 for sub-Saharan Africa and 0.39 for low-income Africa, as indicated in Chart 37. It is also lower than the levels in the neighbouring countries of Tanzania, DR Congo and Rwanda.
On the Current Path, income inequality will slightly decline. The projected Gini coefficient is 0.34 by 2043, which is 10.5% lower than its current level. However, Burundi can see a significant decline in income inequality if the Combined scenario were implemented. The Gini coefficient in the scenario is 0.29, implying that it has the potential to generate inclusive growth in Burundi.
Carbon is released in many ways, but the three most important contributors to greenhouse gases are carbon dioxide (CO2), carbon monoxide (CO) and methane (CH4). Since each has a different molecular weight, our modelling uses carbon. Many other sites and calculations use CO2 equivalent.
The model forecasts six types of energy, namely oil, gas, coal, hydro, nuclear and other renewables. To allow comparisons between different types of energy, the data is converted into billion barrels of oil equivalent (BBOE). The energy in a barrel of oil is approximately 5.8 million British thermal units (MBTUs) or 1 700 kilowatt-hours (kWh) of energy.
Chart 38 compares carbon emissions in the Current Path and the Combined scenario from 2019 to 2043. It shows that achieving the Combined scenario and the associated rapid economic growth in Burundi will increase carbon emissions above the Current Path. However, carbon emissions in Burundi are currently very low. In the Combined scenario, carbon emissions increase from a very low base of 0.2 million tons of carbon in 2019 to 2 million tons by 2043, which is a 900% increase in this period compared to a 550% increase on the Current Path. In 2043, carbon emissions in the Combined cenario are 0.7 million tons higher than on the Current Path.
Chart 39 summarises the findings.
Burundi is at a critical stage in its development. More than a decade of conflict devastated much of the country's physical, social and human capital until the Arusha Peace Agreement was signed in 2000. Since then, Burundi has made progress in consolidating peace and security, establishing a relatively stable macroeconomic environment, rebuilding institutions and improving sector outcomes, particularly in basic health and education. Burundi now needs to intensify efforts to achieve greater stability and prosperity.
The aim of this report was therefore to examine Burundi's human and economic development prospects on its current trajectory (Current Path) and a set of complementary scenario interventions that could propel the country onto the path of shared prosperity.
Political fragility, poor infrastructure, weak governance and institutions, poor human capital, low agriculture productivity and limited economic diversification have stunted development outcomes in Burundi. The country ranks bottom on several key development indicators. On its current trajectory, Burundi is forecast to improve its economic and human development outcomes but not fast enough. As a result, the country will likely continue to lag behind its peers on several development indicators and miss many of the SDGs by 2030.
Key findings from the scenario analysis highlight the critical role of agriculture in providing livelihoods for the majority of the population, though it remains vulnerable to climate change and low productivity. Diversifying into manufacturing and improving infrastructure is essential to bolster economic resilience and reduce dependency on aid, which currently constitutes a substantial portion of the national budget. The scenario analysis also reveals that a coordinated policy push across all the development sectors is the most viable way to significantly improve the future of the country. However, this progress must be balanced with environmental sustainability to mitigate the impact of increased carbon emissions.
The Government of Burundi should:
- Promote good governance by investing in solid institutions, combat corruption through better transparency, improve judicial independence, enhance public service delivery and increase capacity to mobilise domestic revenues and improve spending quality.
- Invest in modernising the agricultural sector, e.g., in irrigation, mechanisation, and sustainable farming practices, to increase productivity and commercialisation, ensure food security, and employment, and reduce extreme poverty.
- Invest in human capital and skills development with particular attention to vocational education and training; boost health outcomes, and enhance social protection through support programs for vulnerable populations.
- Increase the transport infrastructure network (especially in rural areas) and invest in climate-resilient infrastructure as well as road networks, electricity access and ICT.
- Transform and diversify the economy. The government should start by improving the regulatory and legal environment, promote regional integration by leveraging the AfCFTA, establish a stable political and security climate in order to stimulate private investment, particularly investment in the manufacturing sector.
By implementing these strategies, Burundi can forge a prosperous future for its citizens.
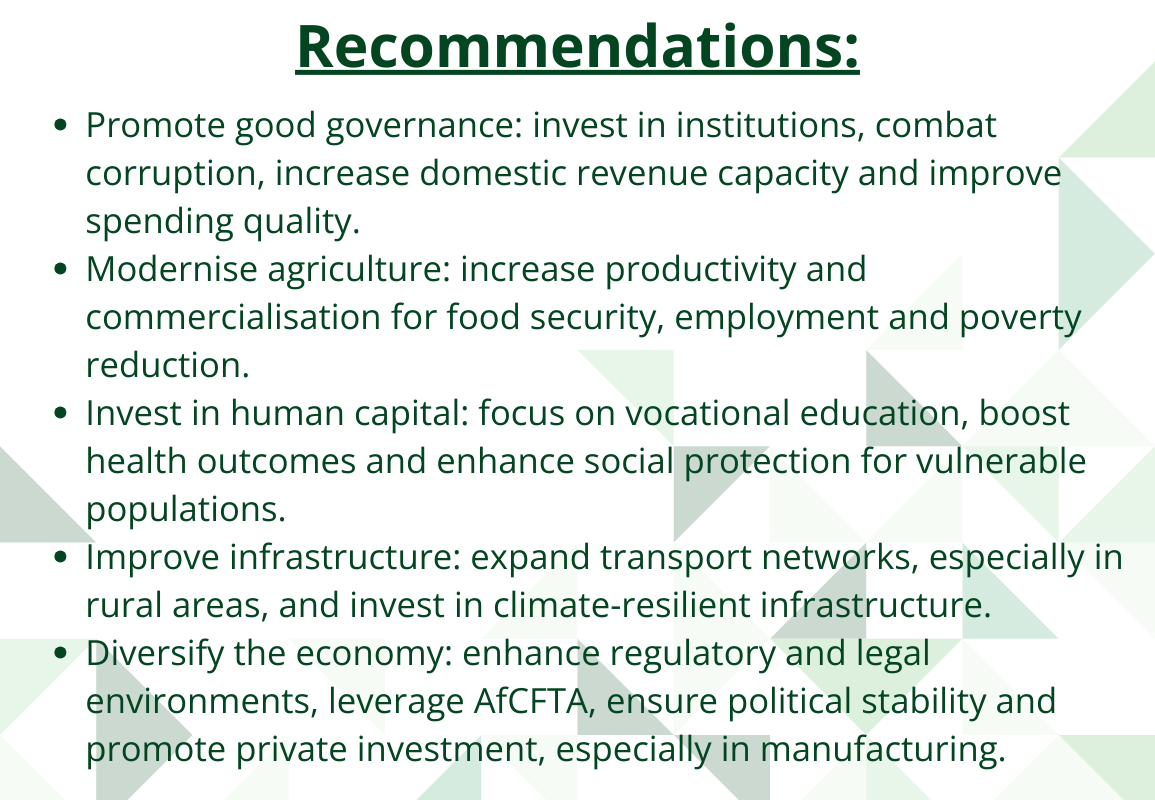
|
Name |
Description |
Country or Group |
Adjustments within IFs 7.84 |
Remarks |
|
Governance scenario |
||||
|
democm |
Democracy multiplier |
Burundi |
Interpolate from 1 to 1.4 over 10 years between 2024 and 2033. |
Burkina Faso improved its democracy by 60% between 2008 and 2018. In the Governance scenario, democracy in Burundi improves by 35% above the Current Path forecast in 2043 to 14.3, above the average for low-income Africa (11.5) but below 13 of 23 low-income African countries. |
|
econfreem |
Economic freedom (1–10) |
Burundi |
Interpolate from 1 to 1.1 over 10 years. |
Rwanda improved its score by about 23% between 2000 and 2010. Average score for Burundi in the scenario increases by 13% above the Current Path forecast in 2040. In the scenario, Burundi ranks fifth in its peer income group by 2040. |
|
gemm Gender |
Empowerment (0–1) |
Burundi |
Interpolate from 1 to 1.10 over 10 years. |
Between 1995 and 2009, gender empowerment improved by 126% in Ethiopia. Between 2024 and 2033, the intervention improves gender empowerment by 10.5% above the average for low-income Africa. In the scenario, Burundi ranks fifth in its peer income group by 2043. |
|
govcorruptm |
Government corruption multiplier (1–10) |
Burundi |
Interpolate from 1 to 1.2 over 10 years. |
Tanzania improved its transparency by 58% between 1998 and 2008. The intervention improves transparency in Burundi by about 38% between 2024 and 2033 — above the low-income Africa average but below Rwanda, Burkina Faso and Ethiopia. |
|
goveffectm |
Government effectiveness multiplier (0–5) |
Burundi |
Interpolate from 1 to 1.5 over 10 years. |
Rwanda improved its government effectiveness by 54% between 2005 and 2015. The intervention increases Burundi’s score by 70% between 2024 and 2033 — above the average for low-income Africa. In the scenario, Burundi ranks second in government effectiveness among low-income African countries, only behind Rwanda. |
|
govriskm |
Government security risk multiplier (0–1) |
Burundi |
Interpolate from 1 to 0.90 over 10 years from 2024 to 2033. |
IFs initialises government risk from 2017. Improved government security is a precondition for sustainable development. The intervention improves government security in Burundi by 16.8% between 2024 and 2033, above the low-income Africa average. The intervention places Burundi only next to Gambia in the government security index by 2043. |
|
sfintlwaradd |
State failure/internal war, addition – probability (−1 to 1) |
Burundi |
Interpolate from 0 to −0.5 over 10 years from 2024 to 2033. |
Between 1990 and 2000, Rwanda reduced the probability of state failure by 100%. The intervention reduces the probability of state failure in Burundi to zero by 2029. |
|
svmulm |
Reduce societal violence – (conflict and terror) |
Burundi |
Interpolate from 1 to 0.8 over 10 years. |
Long-term peace and security are necessary for Burundi’s inclusive and sustainable development. Rwanda was able to reduce total death per 1 000 people from societal violence by 91% between 1995 and 2005. The intervention will reduce death (per 1 000 people) from societal violence by 8% between 2024 and 2033. By 2043 Burundi is forecast to have the eighth lowest societal violence among low-income African countries. |
|
Demographics and Health scenario |
||||
|
contrusm |
Contraception use multiplier |
Burundi |
Interpolate from 1 to 1.6 over 10 years. |
The intervention increases contraceptive use by 78.5% between 2024 and 2033. By 2043, the rate of contraception use in Burundi will be above the low-income Africa average but still lower than in Rwanda and Malawi. |
|
Watsafem (piped water) |
Increase pop with access to piped water |
Burundi |
Interpolate from 1 to 1.5 over 10 years from 2024 to 2033. |
Between 2010 and 2020, Ethiopia increased population with access to piped water by 93%, and DR Congo by nearly 70%. The intervention improves access to piped water by 20% between 2024 and 2033. By 2043 access to piped water in Burundi (47%) is forecast to be below the average for low-income Africa of 53%. |
|
anitation (improved) |
Increase pop with access to improved sanitation |
Burundi |
Interpolate from 1 to 1.5 between 2024 and 2033. |
Mali increased its population with access to improved sanitation by 87% between 2000 and 2010. The intervention increases the population with access to improved sanitation by 27.8% between 2024 and 2033 making it the country with the seventh highest access rate among low-income African countries by 2043. |
|
malmortratiom |
Maternal mortality ratio multiplier |
Burundi |
Interpolate from 1 to 0.8 between 2024 and 2033. |
Between 2007 and 2017 Ethiopia reduced its maternal mortality rate by 45% and CAR by 26%. The intervention reduces the maternal mortality rate in Burundi by 53.6% between 2024 and 2033. By 2043, Burundi will rank sixth lowest among low-income African countries at 108.1 per 1 000 deaths. |
|
hlmortcdchldm |
Reduces Mortality for children under-five |
Burundi |
Interpolate from 1 to 0.75 over 10 years. |
Between 2006 and 2016 Malawi reduced its under-five mortality rate by 50%, while Burkina Faso achieved over 40% reduction within the same period. The intervention will reduce under-five mortality in Burundi by 48.7% between 2024 and 2033. The rate is lower than the average of low-income African countries and ranks sixth lowest among the group by 2043. |
|
hlmortm (AIDS) |
Mortality multiplier |
Burundi |
Interpolate from 1 to 0.7 between 2024 and 2033. |
Burkina Faso reduced deaths from AIDS (in millions) by 66% between 2004 and 2014. The Demographics and Health scenario will reduce death from AIDS in Burundi by 60% between 2024 and 2033, on par with Ethiopia and DR Congo by 2043. |
|
hlmortm (diarrhea) |
Mortality multiplier |
Burundi |
Interpolate from 1 to 0.7 over 10 years. |
In the past, Burundi was able to reduce mortality by 42% between 1998 and 2008. The intervention will reduce death in Burundi by 51.7% between 2024 and 2033, and by 2043 the intervention will reduce the death from diarrhoea in Burundi lower than the average for low-income African countries and 17th others by 2043. |
|
hlmortm (malaria) |
Mortality multiplier |
Burundi |
Interpolate from 1 to 0.8 over 10 years. |
Between 2007 and 2017 Guinea was able to reduce mortality from malaria by 72%. The intervention will reduce deaths in Burundi by 41% between 2024 and 2033, though still higher than average for low-income African countries of 132 deaths per 1 000 people. |
|
hlmortm (respinfection) |
Mortality multiplier |
Burundi |
Interpolate from 1 to 0.7 over 10 years. |
Between 2010 and 2020 Malawi reduced deaths from respiratory infections by 40%. The intervention is poised to decrease deaths in Burundi by 42% between 2024 and 2033. By 2043, Burundi will have a respiratory infection death rate lower than the low-income Africa average of 183.7 but higher than in 11 other peer countries. |
|
hlmortm (diabetes) |
Mortality multiplier |
Burundi |
Interpolate from 1 to 0.7 over 10 years. |
Rwanda reduced death from diabetes by 50% between 1992 and 2002. The intervention will reduce deaths from diabetes by 40% lower than in the Current Path by 2033. By 2043, death from diabetes in Burundi will be lower than in 15 other low-income African countries. |
|
hlmortm (OthCommumDis) |
Mortality multiplier
|
Burundi |
Interpolate from 1 to 0.8. |
Between 2007 and 2017 Ethiopia reduced its death from other communicable diseases by about 40%. The intervention reduces deaths in Burundi by 37.6% between 2024 and 2033, and by 2043 Burundi will have lower deaths from other communicable diseases than 13 low-income countries by 2043. |
|
hlmortm (OtherNonComm) |
Mortality multiplier
|
Burundi |
Interpolate from 1 to 0.95 over 10 years. |
Malawi reduced deaths from other non-communicable diseases by 21% between 1994 and 2003. The intervention reduces deaths by 4% between 2024 and 2033, and by 2043 Burundi will have fewer deaths from other non-communicable diseases than 14 other low-income countries. |
|
Education scenario |
||||
|
edseclowrvocadd |
Lower secondary, vocational share, additive factor, decimal rate |
Burundi |
Interpolate to 5 |
Burkina Faso increased vocational training in lower secondary schools by 60% between 2009 and 2019. The intervention will increase vocational enrolment at lower secondary schools by 90% between 2024 and 2033, and by 2043 it will push Burundi above the average for low-income African countries by 2043. |
|
Edsecupprvocadd
|
Upper secondary, vocational share, additive factor, decimal rate |
Burundi |
Interpolate to 5 |
Coming from a low base of 2.6, Ethiopia increased vocational training share of upper secondary education from 21.56% to 59.2% between 2001 and 2011. The intervention will see Burundi improve its upper secondary vocational training by 17.3% between 2024 and 2033, and by 2043 Burundi will be slightly above the average for low-income countries. |
|
edterscienshradd |
Tertiary, Sci-Eng share of graduates, additive factor, decimal rate |
Burundi |
Interpolate to 5 between 2024 and 2033. |
Increase in science and engineering graduates is necessary for quality human capital for sustainable growth and development. The intervention pushes the science and engineering graduate share by 49.3%, and by 2043 the share in Burundi is forecast to be slightly above the peer income group average. |
|
edprisurm |
Primary, survival rate, multiplier (total) |
Burundi |
Interpolate from 1 to 1.25 over 10 years. |
Malawi improved the survival rate at primary level by 60% between 2004 and 2013. The intervention will push the survival rate in Burundi by 30% between 2024 and 2033. |
|
EDSECLOWRTRAN |
Lower secondary transition rate |
Burundi |
Interpolate from 1 to 1.25 over 10 years. |
Between 2000 and 2010, Niger improved by 45%. The intervention will quickly push Burundi to 100% by 2026 from 97.5% in 2023. |
|
EDSECUPPRTRAN |
Upper secondary transition rate |
Burundi |
Interpolate from 1 to 1.25 over 10 years. |
Upper secondary transition is low in Burundi, initialised at 39%. The intervention will quickly push Burundi to 100% by 2024 from 98.7% in 2023. |
|
edseclowrgram |
Lower, secondary, graduation rate, multiplier |
Burundi |
Interpolate from 1 to 1.3. over 10 years. |
The intervention increases lower secondary graduation rate by 34% between 2024 and 2033. By 2043, the graduation rate in Burundi will be above low-income average but still below the level for five low-income African countries. |
|
edsecupprgram |
Upper secondary, graduation rate, multiplier (total) |
Burundi |
Interpolate from 1 to 1.3. |
From an initial low base, the intervention pushes the upper secondary graduation rate by 33.7% between 2024 and 2033. The upper secondary graduation rate in Burundi is lower than the average for low-income African countries by 2043 but still ahead of three other countries. |
|
edterintm |
Tertiary, intake rate, multiplier, total |
Burundi |
Interpolate from 1 to 1.2 over 10 years. |
Madagascar improved its tertiary intake by 61% between 2007 and 2017. The intervention will see Burundi improve its tertiary intake by 85.7% by 2033 (from 2024). Burundi will have a lower tertiary intake than an average peer income group member in Africa by 2043. |
|
edtergradm |
Tertiary, graduation rate multiplier |
Burundi |
Interpolate from 1 to 1.2 over 10 years. |
Between 2007 and 2017, Madagascar improved graduation from tertiary education by 160%. Burundi will see a 70% improvement in tertiary graduation rate. Though below the low-income average, Burundi will have a tertiary graduation rate higher than six low-income African countries by 2043. |
|
edqualpriallm |
Quality, multiplier on primary (total) |
Burundi |
Interpolate from 1 to 1.05 over 10 years. |
Burkina Faso improved quality at primary level by 31% between 2008 and 2018. The intervention improves quality by 8% from 2024 to 2033, and by 2043 education quality in Burundi will be lower than the average of low-income Africa but lower than Sudan, Ethiopia and Burkina Faso. |
|
edqualsecallm |
Quality, multiplier on secondary (total) |
Burundi |
Interpolate from 1 to 1.05 over 10 years. |
The intervention increased the quality of secondary education by 1.5% between 2024 and 2033, below the average for low-income Africa but higher than in Niger by 2043. |
|
Agriculture scenario |
||||
|
ylm |
Yields multiplier |
Burundi |
Interpolate from 1 to 1.80 over 10 years. |
Mali improved yields per hectare by 100% between 2009 and 2019. The intervention will improve agricultural yield in Burundi by 90% between 2024 and 2033. By 2043, only Malawi will have more yield per hectare than Burundi among low-income African countries. |
|
landirareaactualm |
Multiplier on land actually irrigated |
Burundi |
Interpolate from 1 to 1.1 by 2033. |
The intervention improves land irrigated by 14.5% between 2024 and 2033. By 2043, the land area forecast to be irrigated is less than the average for low-income African countries but still larger than in ten income group peer countries. |
|
landirareaequipm |
Multiplier on land equipped for irrigation |
Burundi |
Interpolate from 1 to 1.1 by 2033. |
Ethiopia improved its land equipped for irrigation significantly by 5% between 2024 and 2033. |
|
aglossprodm |
Loss rate of agricultural production (crop) |
Burundi |
Interpolate from 1 to 0.7. |
The intervention reduces crop loss by 30% between 2024 and 2033. By 2043, Burundi will suffer the least loss rate of agricultural production among its income group peers in Africa. |
|
aglosstransm |
Loss rate of agriculture as moves from producer to consumer multiplier (crop) |
Burundi |
Interpolate from 1 to 0.7. |
The intervention reduces food waste by 25% between 2024 and 2033. By 2043, Burundi will reduce food waste lower than average low-income African peers but higher than Eritrea and South Sudan. |
|
clpcm |
Per capita calorie demand multiplier (total) |
Burundi |
Interpolate from 1 to 1.15 by 2033. |
Between 2000 and 2010, per capita calorie available in Uganda increased by 42%. The intervention will increase Burundi’s available calories by 58.5% between 2024 and 2033. By 2043, Burundi will have more calories available than eight low-income African countries. |
|
Manufacturing scenario This scenario consists of two sce files: manuf and grants |
||||
|
govhhtrnwelm (unskilled) |
Government to household welfare transfers |
Burundi |
Interpolate from 1 to 1.15. |
Transfers to the household are necessary to smooth the negative redistributional effect of manufacturing on households. The intervention will push government household transfers from 0.5% to 1.2% in 2033. By 2043, the government of Burundi will only make more transfers to households than that of Madagascar. |
|
hhtaxrm |
Household tax rate multiplier, by skill level |
Burundi |
Unskilled labour: Interpolate from 1 to 0.6.
Skilled labour: Interpolate from 1 to 1.05. |
The intervention increases government tax revenue from taxing unskilled labour by 37.5% and skilled labour by 108% between 2024 and 2033. |
|
govbusregindm |
Government regulation of business index multiplier |
Burundi |
Interpolate from 1 to 0.8 over 10 years. |
Private sector-led growth is supported by little government interference in the day-to-day operations of businesses. Reducing government regulation is necessary for promoting manufacturing in Burundi. |
|
idsm |
Investment in manufacturing sector |
Burundi |
Interpolate from 1 to 1.2. |
The intervention improves the manufacturing investment share of GDP by 128% between 2024 and 2033. By 2043, Burundi’s projected manufacturing share of GDP is less than the average for its income group peers but higher than in seven low-income African countries. |
|
randdexpm |
Increase research development activities (total) |
Burundi |
Interpolate from 1 to 1.1. |
The intervention improves R&D share of GDP between 2024 and 2033. By 2043, Burundi ranks seventh in R&D among its income group peers in Africa. |
|
labparm |
Total labour participation rate (male & female); female more aggressive |
Burundi |
Male: Interpolate from 1 to 1.1 over 10 years from 2023 to 2033.
Female: Interpolate from 1 to 1.2 over 10 years from 2023 to 2033.
|
Historically, male labour participation has been declining in Burundi. The intervention will push male labour participation by 8.9% between 2024 and 2033. By 2043, Burundi will have the fifth highest male labour force participation rate.
Female participation rate will improve by 16.4% between 2024 and 2033. By 2043, Burundi will have the highest female participation rate among its low-income peers. |
|
Infrastructure/Leapfrogging scenario |
||||
|
qem – Q (OthRenew) |
Capital cost to output ratio in energy |
Burundi |
Interpolate from 1 to 0.9. |
Lower energy cost to output will enhance the production of more energy to fuel economic growth and development. |
|
Enpm (OthRenew) |
Energy production multiplier for other renewables |
Burundi |
Interpolate from 1 to 1.2 over 10 years from 2023 to 2033. |
The intervention increases other renewable energy production from nothing in 2024 to 2 million barrels in 2033. By 2043, Burundi’s production of other renewable energy will be below average for low-income African countries but still ahead of 12 income group peers. |
|
infraelecaccm (urban) |
Electricity access multiplier urban |
Burundi |
Interpolate from 1 to 1.2 over 10 years from 2023 and 2033. |
Burkina Faso improved urban electricity access by 45% between 2009 and 2019. The intervention improves urban electricity access by 21% between 2024 and 2033. By 2043, Burundi is projected to provide 96% of the urban population with access, above average for low-income peers countries in Africa but still below 100% as in Eritrea and Togo. |
|
infraelecaccm (rural) |
Electricity access multiplier rural |
Burundi |
Interpolate from 1 to 1.8 over 10 years from 2023 to 2033. |
Between 2009 and 2019, Eritrea improved rural access to electricity by 99%. Starting from just 2.29% in 2024, the intervention improves rural access by 224% by 2033. By 2043, Burundi will have the least rural access to electricity among its income peers in Africa. |
|
ictbroadmobilm |
ICT mobile broadband multiplier |
Burundi |
Interpolate from 1 to 1.30. |
From a low base, Rwanda improved mobile broadband subscription by nearly tenfold between 2012 and 2017. The intervention improves mobile broadband subscription by 100% between 2024 and 2033 in Burundi. |
|
ictbroadcostm |
ICT broadband multiplier on cost of adding a connection |
Burundi |
Interpolate from 1 to 0.9. |
Reducing the cost of adding a connection improves connectivity to ICT broadband infrastructure. Burundi will need more broadband connections to leverage the opportunities that digitalisation offers. |
|
ictbroadm |
ICT broadband multiplier |
Burundi |
Interpolate from 1 to 1.5. |
Starting from just 0.02% Togo improved its connection to 0.6% in 2017. The intervention improves fixed broadband subscriptions by 372% between 2024 and 2033. By 2043, Burundi will have more fixed broadband subscriptions than the average low-income African country but still fewer than 14 peers. |
|
infraroadpavedpcntm |
Paved road |
Burundi |
Interpolate from 1 to 1.20 over 10 years from 2023 to 2033. |
Guinea Bissau increased its proportion of paved roads as a percentage of total roads by 200% between 1992 and 2002. The intervention improves paved roads share of total roads by 100% and pushes Burundi on slightly above the average for its low-income peers in Africa by 2043. |
|
gdpinformshrm |
Reduce informality |
Burundi |
Interpolate from 1 to 0.8. |
The intervention decreases informality by 21.7% between 2024 and 2033. |
|
AfCFTA scenario |
||||
|
XSM |
Export multiplier – Manufacturing |
Burundi |
Interpolate from 1 to 1.2. |
Manufacturing export value as per cent of GDP improves by 175% between 2024 and 2033. By 2043, Burundi’s projected manufacturing export share of GDP is only higher than in Sudan among low-income African countries. |
|
XSM |
Export multiplier – Agriculture |
Burundi |
Interpolate from 1 to 1.2. |
Agricultural export share of GDP declines by 85% between 2024 and 2033. By 2043, Burundi will have an agriculture export share lower than the average for its income group peers but higher than in eight low-income African countries. |
|
XSM |
Export multiplier – Services |
Burundi |
Interpolate from 1 to 1.2. |
Services export in Burundi increases by 294% between 2024 and 2033. By 2043, Burundi will have the highest services export share among low-income African countries. |
|
XSM |
Export multiplier – ICT |
Burundi |
Interpolate from 1 to 1.1. |
Coming from a low base, the ICT export share will improve by 178% between 2024 and 2033 — above average for its income group peers but still below 10 other low-income African countries by 2043. |
|
XSM |
Export multiplier – Materials |
Burundi |
Interpolate from 1 to 1.25. |
Export share of material will improve by more than 314% between 2024 and 2033 — below the average for low-income Africa by 2043. |
|
mfpadd |
Increase multifactor productivity |
Burundi |
Interpolate from 0 to 0.006 over 10 years from 2023 to 2033. |
Free trade unleashes productivity growth. |
|
XSM |
Export multiplier – Energy |
Burundi |
Interpolate from 1 to 1.15. |
The share of energy exports in Burundi will improve by 77% between 2024 and 2033. By 2040, Burundi is projected to rank 16th among income group peers in energy export. |
|
mtarifftaxrm |
Import tariff tax multiplier by country and sector |
Burundi |
Interpolate from 1 to 0.8. |
Lower import tariffs promote free trade between countries and boost growth and development. |
|
External Financial Flows scenario |
||||
|
xworkremitinm |
Worker remittances multiplier (positive numbers are receipts) |
Burundi |
Interpolate from 1 to 1.2 over 10 years from 2023 to 2033. |
South Sudan increased its remittance share of GDP by significantly from a net sender of 0.004% of GDP in 2014 to 17% of GDP in 2018. The intervention improves remittance share of GDP by 117.5% above the Current Path forecast in 2033. By 2043, Burundi will be a net remittance sender. |
|
aidrecm |
Aid (foreign) receipts multiplier |
Burundi |
Interpolate from 1 to 1.22 over 10 years from 2023 to 2033. |
Between 2006 and 2016 the Central African Republic improved its aid receipt share of GDP by 197%. The intervention improves aid receipt in Burundi slightly by 3% between 2024 and 2033. By 2043, Burundi is projected to have the third largest aid receipt (as per cent of GDP) in low-income Africa. |
|
xfdistockm |
Foreign direct investment, stocks of investment from abroad, multiplier |
Burundi |
Interpolate from 1 to 1.05 over 10 years from 2023 to 2033. |
Togo was able to improve its FDI receipt by 132% between 2010 and 2020. In the intervention, FDI inflow to Burundi is projected to rise by 140% between 2024 and 2033. By 2043, Burundi will receive more FDI (share of GDP) than the Central African Republic, Burkina Faso and South Sudan. |
|
xfdistoutm |
Foreign direct investment, stocks of outward investment, multiplier |
Burundi |
Interpolate from 1 to 0.9 over 10 years from 2023 to 2033. |
As a proxy for capital flight, reducing outflow of FDI is paramount to building the domestic capital stock of Burundi. |
|
xportfoliom |
Portfolio investment, stocks of investment from abroad, multiplier |
Burundi |
Interpolate from 1 to 1.1. |
Investment in financial assets in Burundi promotes the financial market development and its long-term growth. |
Endnotes
For the purposes of modelling and measuring governance in IFs, Hughes et al use modernisation theory and the notion that governance historically develops through three sequential transitions: a security transition, followed by a capacity transition, and finally a transition towards greater inclusion. Although Africa did not follow this pattern of state formation, the three transitions provide a useful analytical lens through which to view governance. To this end, IFs includes an index (0 to 1) for each dimension, with higher scores indicating improved outcomes. A composite governance index is a simple average of the three. BB Hughes et al, Patterns of Potential Human Progress: Strengthening Governance Globally, Boulder: Oxford University Press, 2014, 6.
AfCAP, Climate adaptation: Risk management and resilience optimisation for vulnerable road access in Africa, February 2019.
Page information
Contact at AFI team is Kouassi Yeboua and Mustapha Jobarteh
This entry was last updated on 28 May 2026 using IFs v7.84.
Donors and sponsors


Reuse our work
- All visualizations, data, and text produced by African Futures are completely open access under the Creative Commons BY license. You have the permission to use, distribute, and reproduce these in any medium, provided the source and authors are credited.
- The data produced by third parties and made available by African Futures is subject to the license terms from the original third-party authors. We will always indicate the original source of the data in our documentation, so you should always check the license of any such third-party data before use and redistribution.
- All of our charts can be embedded in any site.
Cite this research
Kouassi Yeboua and Mustapha Jobarteh (2026) Burundi Development Futures. Published online at futures.issafrica.org. Retrieved from https://futures.issafrica.org/geographic/countries/burundi/ [Online Resource] Updated 28 May 2026.