 South Africa
Feedback welcome
Our aim is to use the best data to inform our analysis. See our Technical page for information on the IFs forecasting platform. We appreciate your help and references for improvements via our feedback form.
The page provides an in-depth analysis of South Africa's current and projected future development, examining various sectoral scenarios and their potential impacts on the country's growth. It explores the individual and combined impact of eight sectors including demographic, economic, and infrastructure-related outcomes for South Africa to 2043. The analysis offers insights into policy actions that could enhance South Africa's developmental trajectory.
Please see the Technical page for more information about the International Futures (IFs) modelling platform we use to develop the various scenarios.
Summary
We begin this page with an overview of South Africa's geographical and political landscape, noting its status as one of eight upper-middle-income countries in Africa and its membership in regional bodies such as the South African Customs Union (SACU) and the Southern African Development Community (SADC). The introduction highlights South Africa's diverse geography and its wide range of climatic conditions. It covers its complex history, from the apartheid era to the transition to democracy in 1994, which brought significant political and socio-economic reforms. It discusses the country's ongoing challenges, including inequality, unemployment, deindustrialisation, and recent efforts to improve investor confidence and infrastructure despite recent political and governance issues.
The introduction is followed by an analysis of South Africa’s Current Path prospects, which informs the country’s likely development trajectory to 2043. It is based on current development trends and assumes that no significant shocks would occur in a ‘business-as-usual’ future. The Current Path suggests that South Africa’s:
- Population is likely to grow from 63.8 million in 2023 to 77 million by 2043, together with a declining fertility rate, an increasing median age from 29.1 years in 2023 to 34.1 years by 2043, and an ageing population with those aged 65 and older increasing from 6.6% in 2023 to 10.7% in 2043.
- Urbanisation will continue to rise, with the proportion of the population living in urban areas increasing from 66% in 2023 to 72% by 2043. This will place pressure on urban infrastructure and services, necessitating substantial investments to accommodate the growth, safely and sustainably.
- Economy will grow steadily, with GDP increasing by 60%, from US$392.1 billion in 2023 to US$628.3 billion by 2043. However, this growth is relatively modest compared to other upper-middle-income countries (UMICs), reflecting ongoing structural challenges in the economy.
- The informal economy will remain a relatively small part of the overall economy with its contribution to GDP declining slightly from 13% in 2023 to 12% in 2043. Different to most other African countries many South Africans are unemployed and not economically active. The limited size and slow growth of the informal sector constrains economic opportunities for those outside the formal labour market, constraining poverty reduction efforts.
- Poverty levels are anticipated to remain significant. The percentage of people living below the upper-middle-income poverty line of US$6.85 per day will decline modestly from 62% in 2023 to 58% in 2043. Poverty rates are extraordinarily high, exacerbated by persistent inequality and high unemployment.
- Development challenges will persist, including unemployment and underinvestment in critical areas such as healthcare and education. The Current Path underscores the need for effective structural reforms and policy interventions, as outlined in the 2011 National Development Plan (NDP), to promote inclusive growth and improve socio-economic outcomes.
The analysis then compares progress on the Current Path with eight sectoral scenarios: Demographics and Health; Agriculture; Education; Manufacturing; the African Continental Free Trade Area (AfCFTA); Large Infrastructure and Leapfrogging; Financial Flows; and Governance. Each scenario is benchmarked to present an ambitious but reasonable aspiration in that sector.
- The Demographics and Health scenario projects significant improvements in health outcomes, with life expectancy increasing to 73 years by 2043, compared to 70.4 years on the Current Path. Infant mortality rates decline from 31.3 per 1 000 live births in 2023 to 21 per 1 000 by 2043, and new treatments mean substantially lower AIDS-related deaths. This scenario highlights the boost in the economic productivity of the working-age population due to better health and reduced disease burden.
- The Agriculture scenario sees average crop yields increase from 5.6 metric tons per hectare in 2023 to 7.2 metric tons per hectare by 2043, compared to the Current Path of 5.5. As a result, crop production will reach 87 million metric tons by 2043, exceeding the projected demand. Targeted investments in the sector boost its contribution to GDP, increase export earnings, reduce import dependence and lift approximately 180 000 additional people out of extreme poverty by 2043 compared to the Current Path.
- In the Education scenario, upper-secondary completion rates increase to 83% by 2043, compared to 68% in the Current Path. In 2023, they stood at 62%. Additionally, the scenario includes a 13% quality improvement in primary and a 17% quality improvement in secondary education. Mean years of education among the 14- to 24-year-old age cohort reach 10.7 years by 2043, contributing to a more skilled and knowledgeable workforce.
- In the Manufacturing scenario, the contribution of manufacturing to GDP increases from 11.62% (US$46 billion) in 2023 to 18.8% in 2043, equivalent to US$129 billion in 2043. This growth increases the total size of the South African economy by 9.3% to US$687 billion in 2043, instead of US$628 billion.
- In the African Continental Free Trade Area (AfCFTA) scenario, South Africa's total trade (exports plus imports) as a percentage of GDP will increase from 57% in 2023 to 72% by 2043, compared to 62% on the Current Path. South Africa's GDP will be 9% larger by 2043, amounting to an additional US$54 billion compared to the Current Path. GDP per capita will increase to US$15 600 in the AfCFTA scenario, an improvement of almost 6% over the Current Path, highlighting the substantial benefits of enhanced regional and global trade integration.
- The Large Infrastructure and Leapfrogging scenario forecasts significant increases in infrastructure investment and capacity, leading to an economy that is US$20 billion larger by 2043 compared to the Current Path. Additionally, GDP per capita would be US$320 higher, and an extra 280 000 people would be lifted out of extreme poverty. The scenario boosts fixed broadband subscriptions to 26 per 100 people by 2043, up from the Current Path of 22. These improvements drive economic growth and enhance social and environmental outcomes, including a substantial reduction in carbon emissions through more renewables, solar and wind in particular. This is done on the back of electricity access increasing to near universal levels with reliance on a much more diverse and sustainable energy mix by 2043.
- The Financial Flows scenario envisions a significant rise in FDI inflows, reaching 4.7% of GDP by 2043, compared to 2.2% on the Current Path. This increase would boost South Africa’s FDI stock to US$357 billion, significantly higher than the Current Path of US$203 billion. The scenario will result in substantial economic benefits, including an economy that is US$38.5 billion larger by 2043, and an increase in per capita income by US$610 compared to the Current Path. Achieving these elevated FDI levels would require policy certainty, regulatory improvements and enhanced credit ratings, which would accelerate growth and improve living standards for South Africans.
- The Governance scenario will significantly reduce poverty and drive economic growth, positioning South Africa ahead of Namibia and narrowing the gap with Botswana. By tackling security challenges and institutional weaknesses, the scenario boosts investment confidence and economic stability, leading to an expected GDP per capita increase of approximately US$840 above the Current Path. While South Africa already excels in inclusion, targeted reforms in capacity and security will be essential to ensuring long-term development, restoring public trust and unlocking economic potential.
In the fourth section, we compare the impact of each of these eight sectoral scenarios with one another and subsequently with a Combined scenario (the integrated effect of all eight scenarios). In our forecasts, we measure progress on various dimensions such as economic size (in market exchange rates), gross domestic product per capita (in purchasing power parity), extreme poverty, carbon emissions, the changes in the structure of the economy, and selected sectoral dimensions such as progress with mean years of education, life expectancy, the Gini coefficient or reductions in mortality rates. Because we include large increases in welfare transfers in the Governance scenario, it does best in extreme poverty reduction, followed by the Manufacturing and Education scenarios. The Manufacturing scenario also delivers the highest GDP per capita by 2043, followed by the AfCFTA and Governance scenarios.
The Combined scenario forecasts:
- a substantial 33% increase in GDP per capita above the Current Path by 2043. This equates to an additional US$4 920 per person, indicating a more prosperous economic outlook for most South Africans. As a result, GDP per capita will recover to its 2013 peak level by 2031, eight years earlier than on the Current Path. This reflects a more rapid economic recovery following years of stagnation and decline.
- that among the sectoral scenarios, the Manufacturing scenario shows the largest impact on GDP per capita with a 6.3% increase (US$930) above the Current Path by 2043. This is followed by gains in the AfCFTA (5.8%), Governance (5.7%) and Financial Flows (4.1%) scenarios, highlighting the importance of diverse sectoral interventions for broad-based economic development.
- a solid reduction in the poverty rate (using US$6.85) to 50% by 2043, down from 62% in 2023. This represents a meaningful decrease of 6.1 million fewer poor people compared to the Current Path, still leaving South Africa with a large poverty burden.
- that the steady replacement of coal by renewables (reflected in the Large Infrastructure and Leapfrogging scenario) will rapidly reduce South Africa’s carbon emissions such that the emissions in the Combined scenario in 2043 will be 37% below the Current Path, in spite of the fact that the economy will be 53% larger.
We end this page with a summarising conclusion offering key recommendations for decision-making. To achieve sustainable growth and reduce inequality, South Africa must focus on competent leadership, evidence-based policies and fostering a culture of accountability and inclusivity. This requires a shift towards an export-led growth path and significant investments in human capital, infrastructure and green technologies, which are supported by both public and private sectors.
All charts for South Africa
- Chart 1: Political map of South Africa
- Chart 2: Population structure in the Current Path, 1990–2043
- Chart 3: Population distribution map, 2023
- Chart 4: Urban and rural population in the Current Path, 1990-2043
- Chart 5: GDP (MER) and growth in the Current Path, 1990-2043
- Chart 6: Size of the informal economy in the Current Path, 2019-2043
- Chart 7: GDP per capita in Current Path, 1990-2043 compared to global income group
- Chart 8: Poverty in Current Path, 2019-2043
- Chart 9: National Development Plan of South Africa
- Chart 10: Relationship between Current Path and scenarios
- Chart 11: Mortality distribution in Current Path, 2023 and 2043
- Chart 12: Infant mortality rate in Current Path and Demographics and Health scenario, 2019-2043
- Chart 13: Demographic dividend in Current Path and Demographics and Health scenario, 2019-2043
- Chart 14: Crop production and demand in Current Path, 1990-2043
- Chart 15: Import dependence in Current Path and Agriculture scenario, 2019-2043
- Chart 16: Progress through education funnel in Current Path, 2023 and 2043
- Chart 17: Mean years of education in Current Path and Education scenario, 2019-2043
- Chart 18: Value-add by sector as % of GDP in Current Path, 2023 and 2043
- Chart 19: Value-add by the manufacturing sector in Current Path and Manufacturing scenario, 2019-2043
- Chart 20: Exports and imports as % of GDP in the Current Path, 2000-2043
- Chart 21: Trade balance in Current Path and AfCFTA scenario, 2019-2043
- Chart 22: Electricity access: urban, rural and total in Current Path, 2000-2043
- Chart 23: Energy Demand and production in Current Path and Large Infra/Leapfrogging scenario, 2019–2043
- Chart 24: Access to mobile and fixed broadband in Current Path and Large Infra/Leapfrogging scenario, 2019-2043
- Chart 25: FDI, foreign aid and remittances as % of GDP in Current Path and Financial Flows scenario, 1990-2043
- Chart 26: Government revenue in Current Path and Financial Flows scenario, 2019-2043
- Chart 27: Government effectiveness score in the Current Path, 2002-2043
- Chart 28: Composite governance index in Current Path and Governance scenario, 2023 and 2043
- Chart 29: GDP per capita in Current Path and all scenarios, 2019-2043
- Chart 30: Poverty in Current Path and all scenarios, 2019-2043
- Chart 31: GDP (MER) in Current Path and Combined scenario, 2019-2043
- Chart 32: Value added by sector in Current Path and Combined scenario, 2023 and 2043
- Chart 33: Informal sector in Current Path and Combined scenario, 2019-2043
- Chart 34: Life expectancy in Current Path and Combined scenario, 2023 and 2043
- Chart 35: Domestic Gini in Current Path and Combined scenario, 2019-2043
- Chart 36: Carbon emissions in Current Path and Combined scenario, 2019-2043
- Chart 37: Energy demand and production by type in Current Path and Combined scenario, 2019-2043
- Chart 38: Recommendations
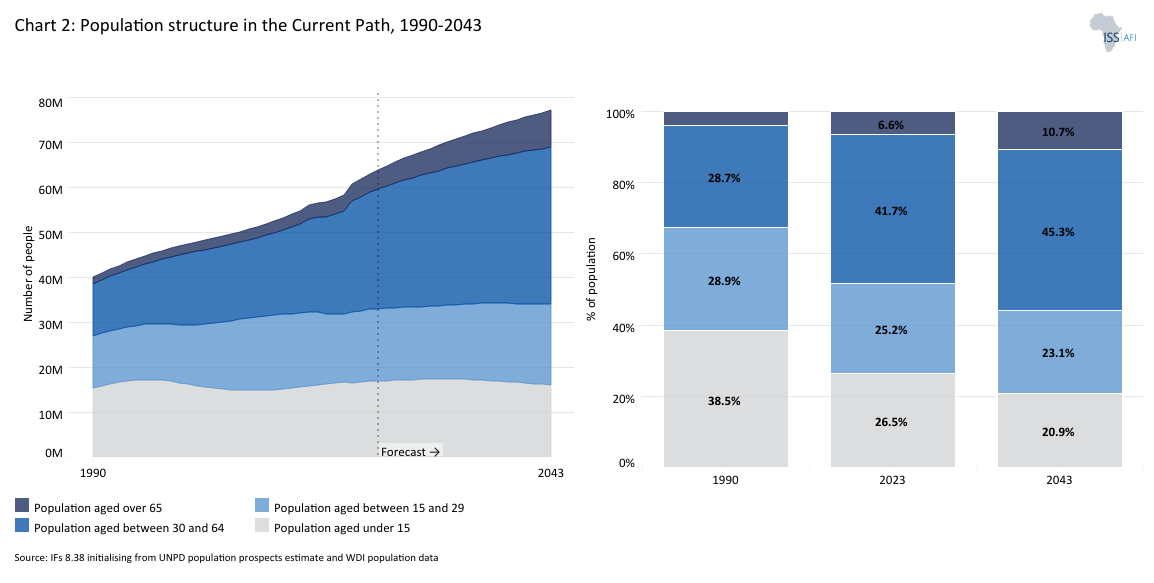
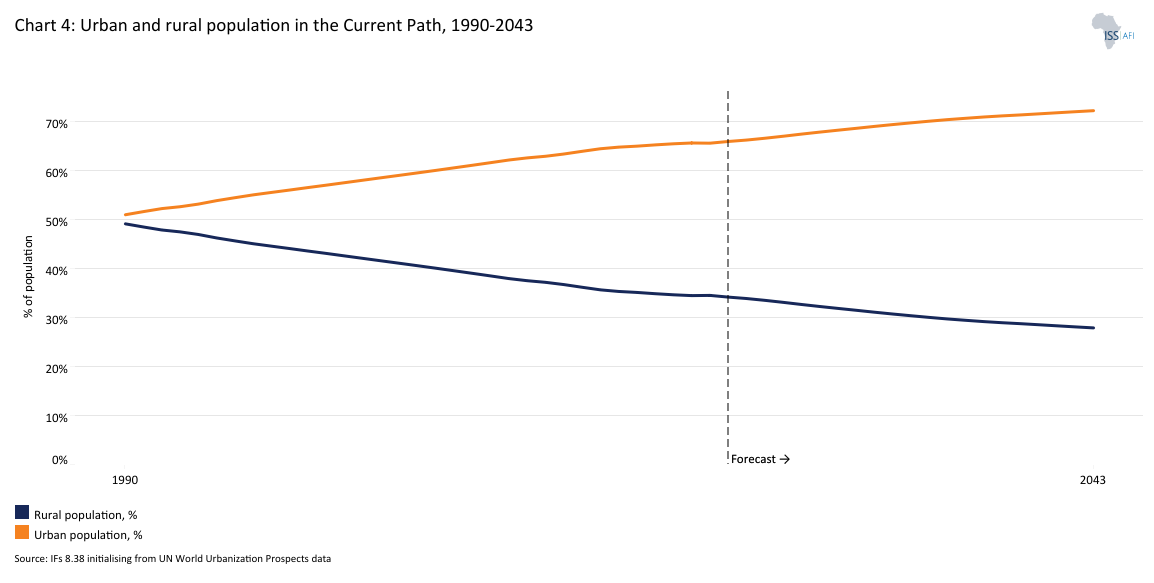
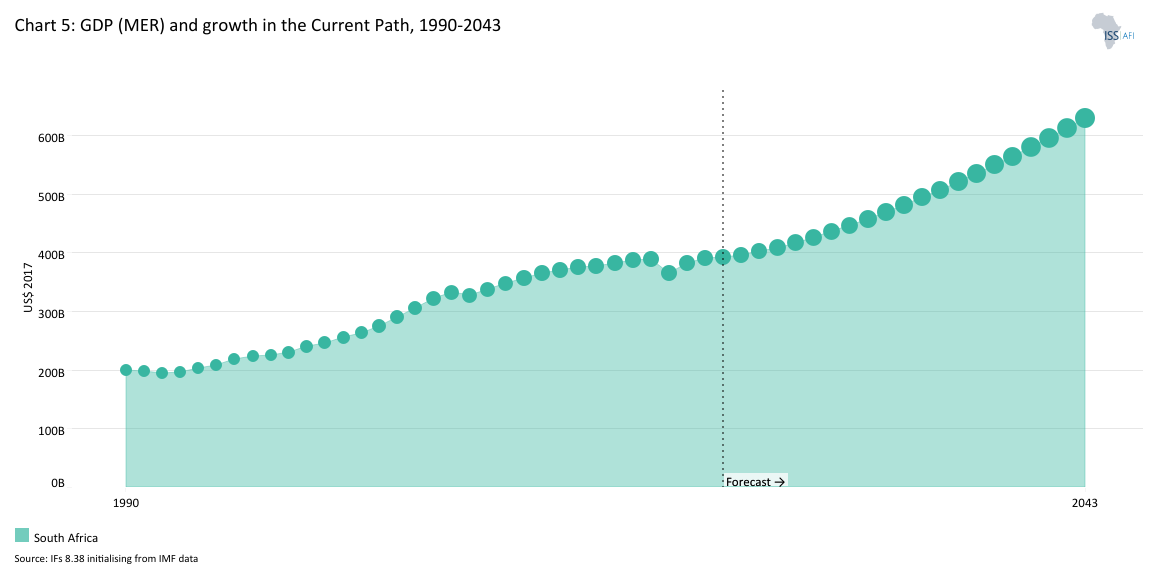
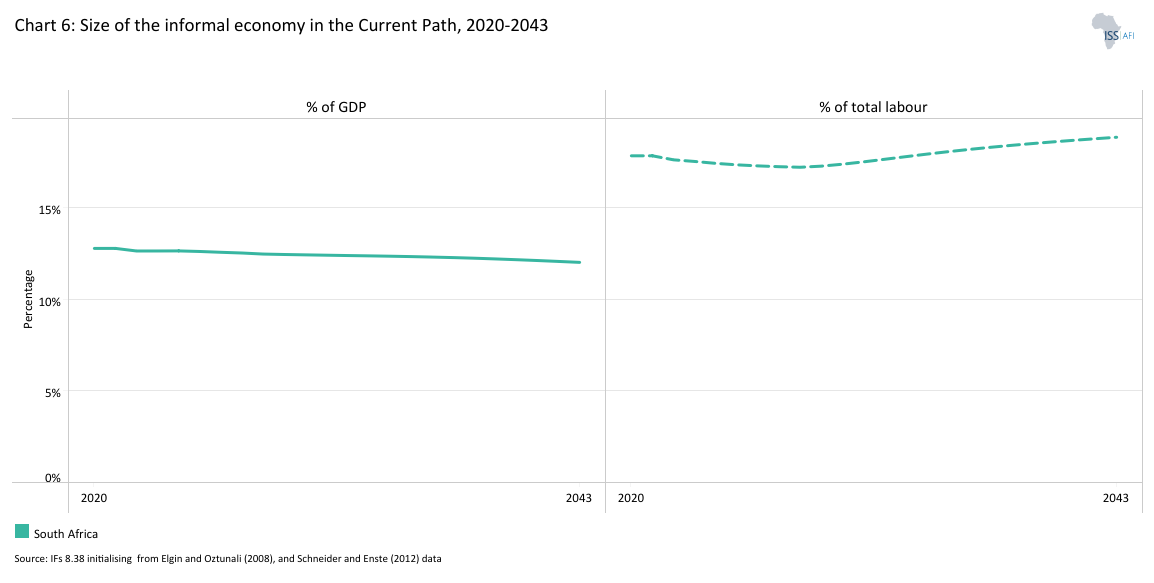
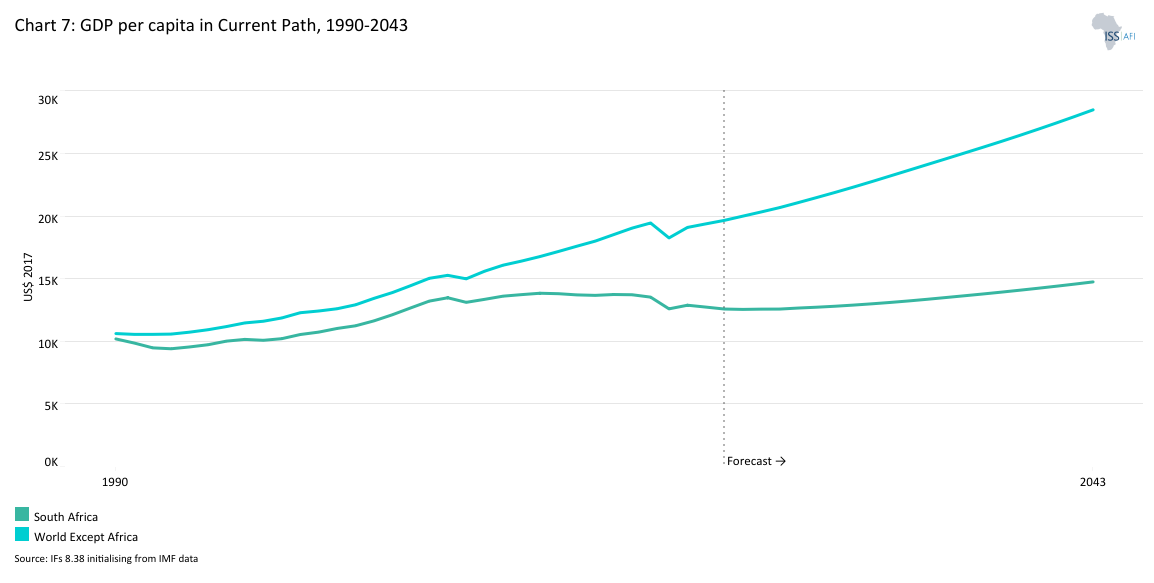
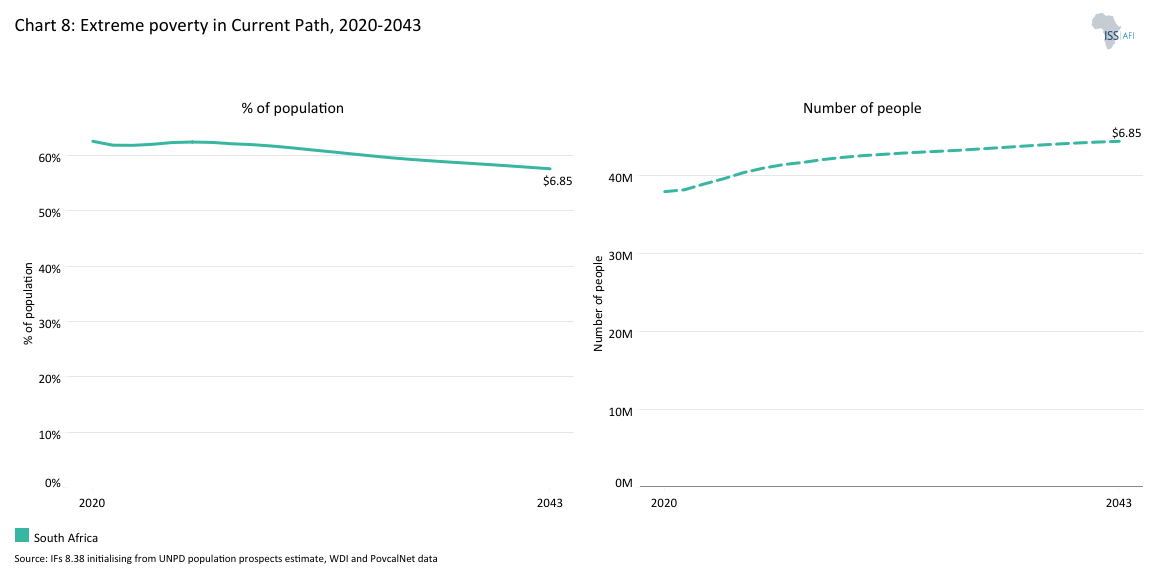
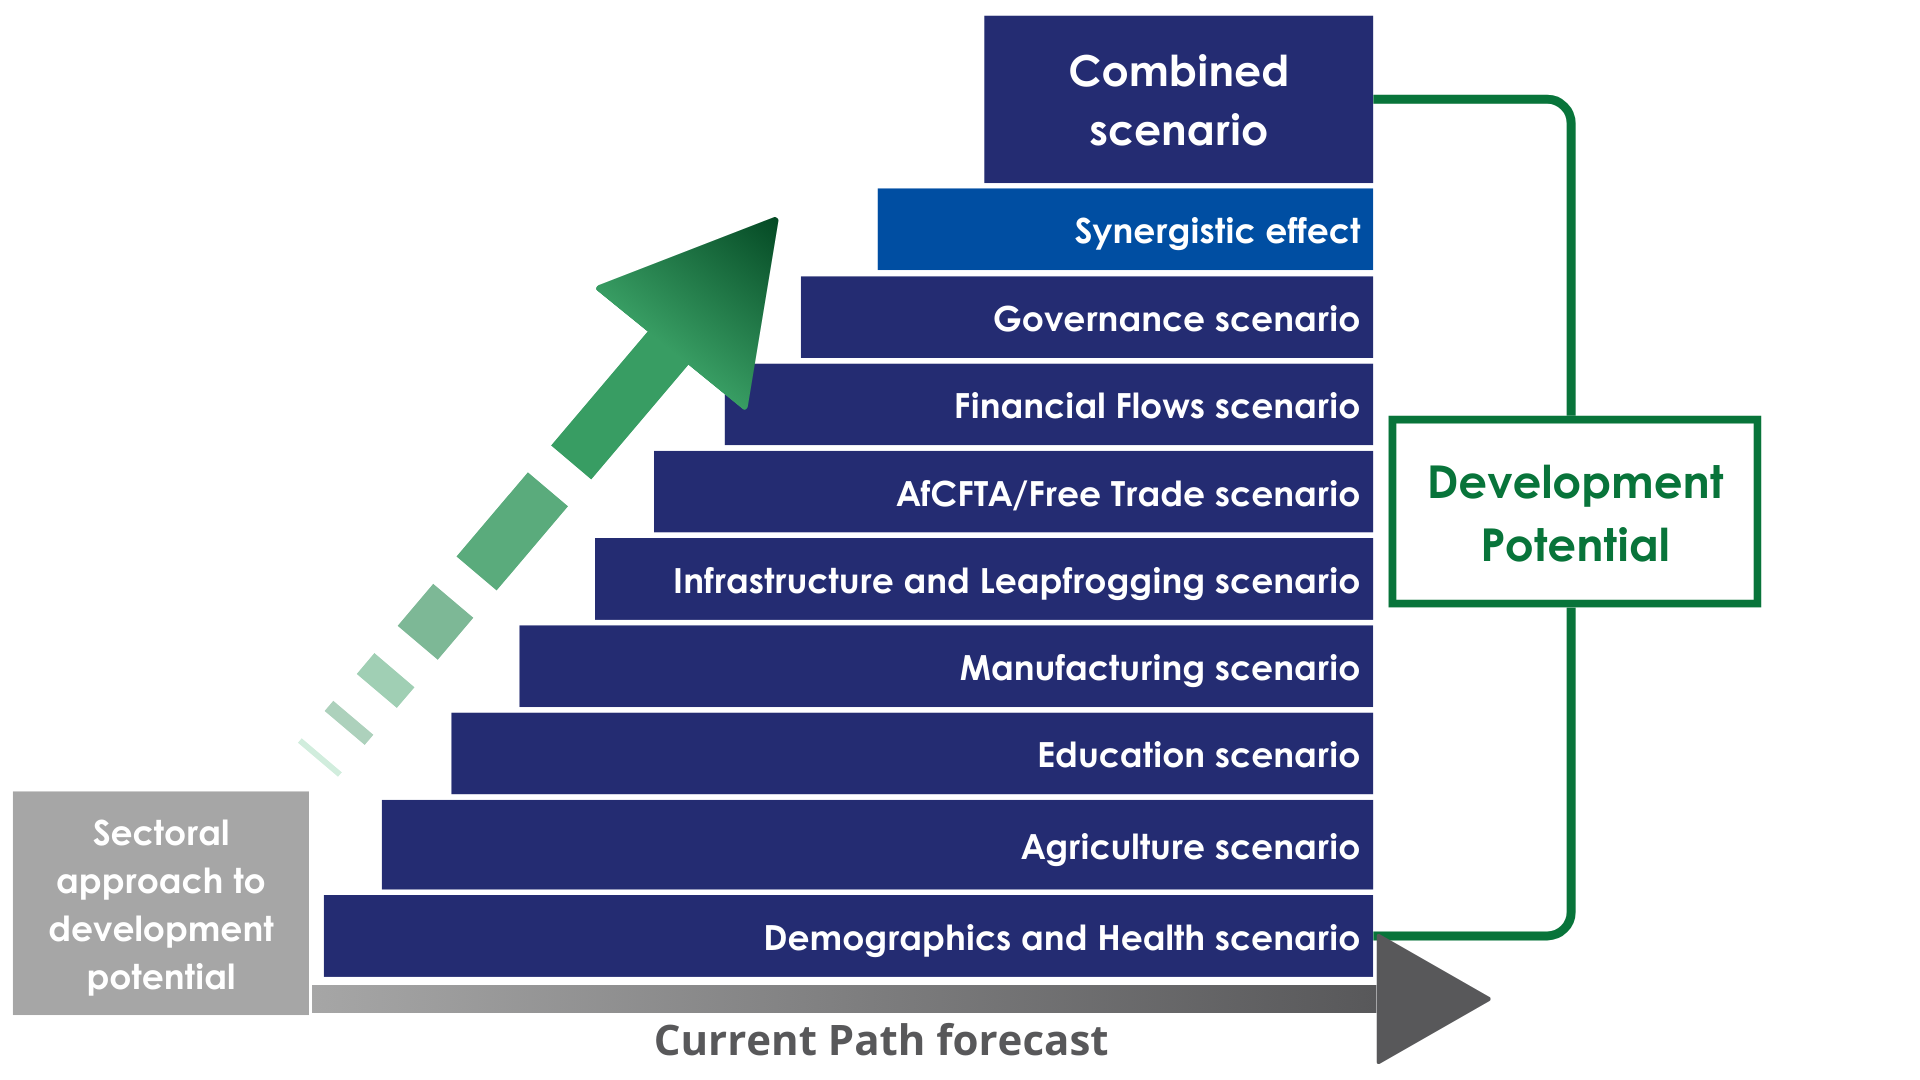
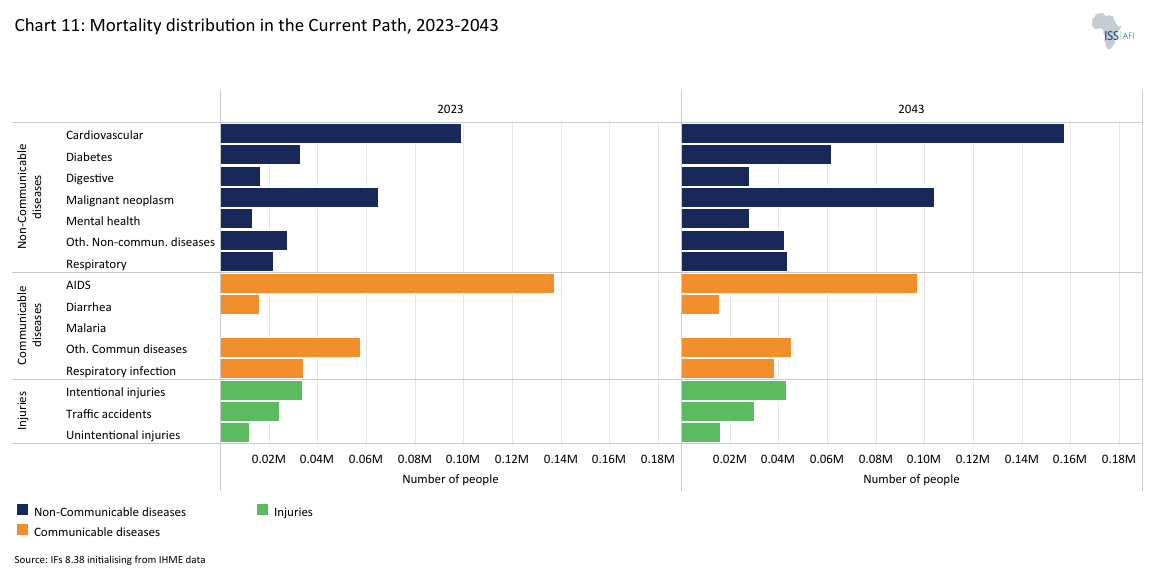
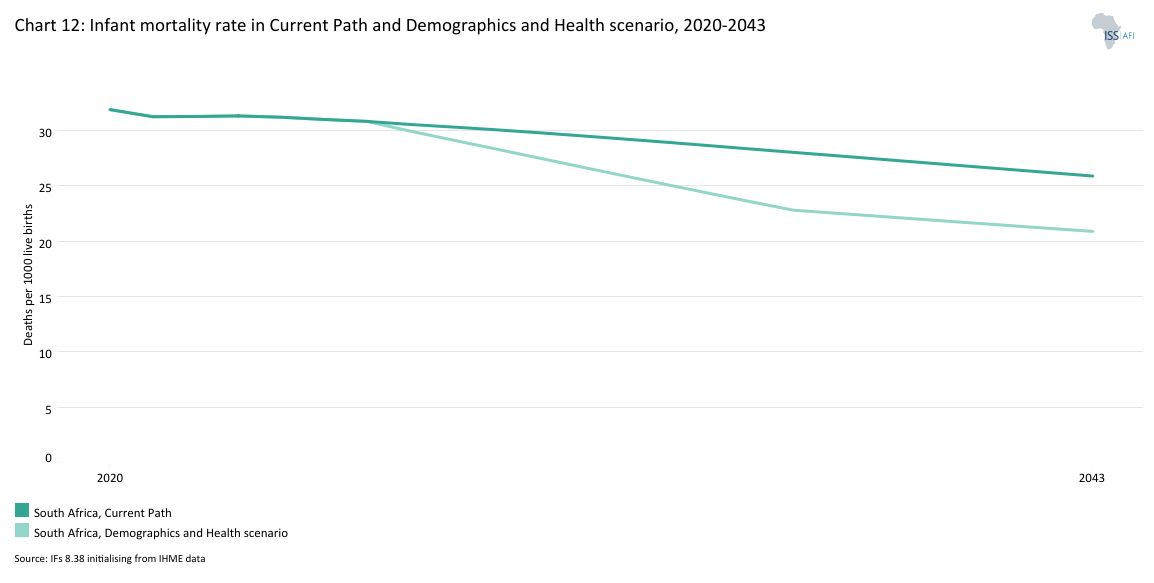
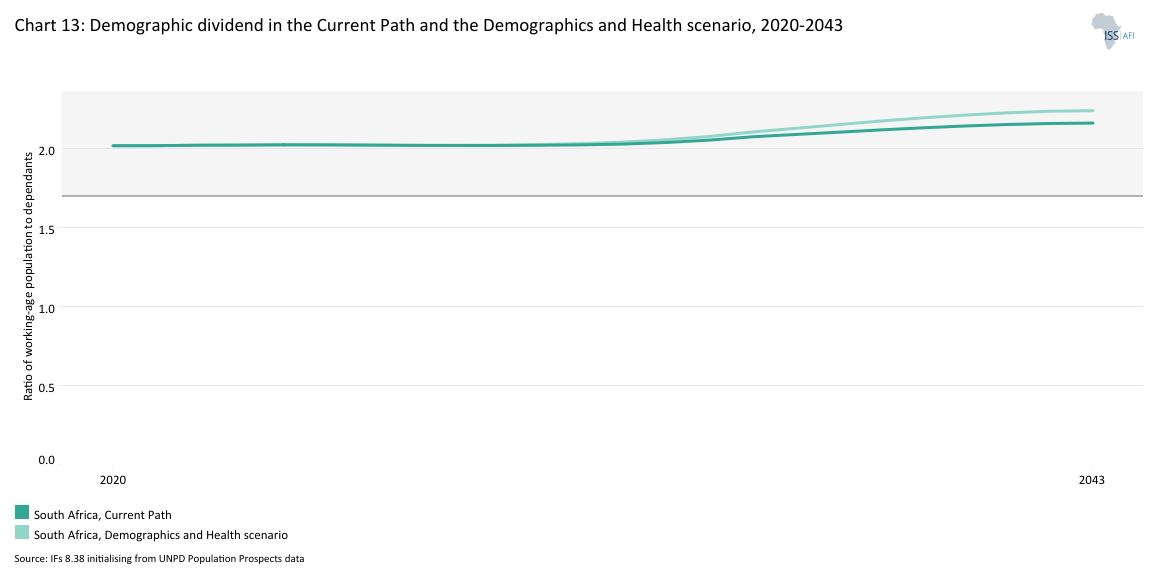
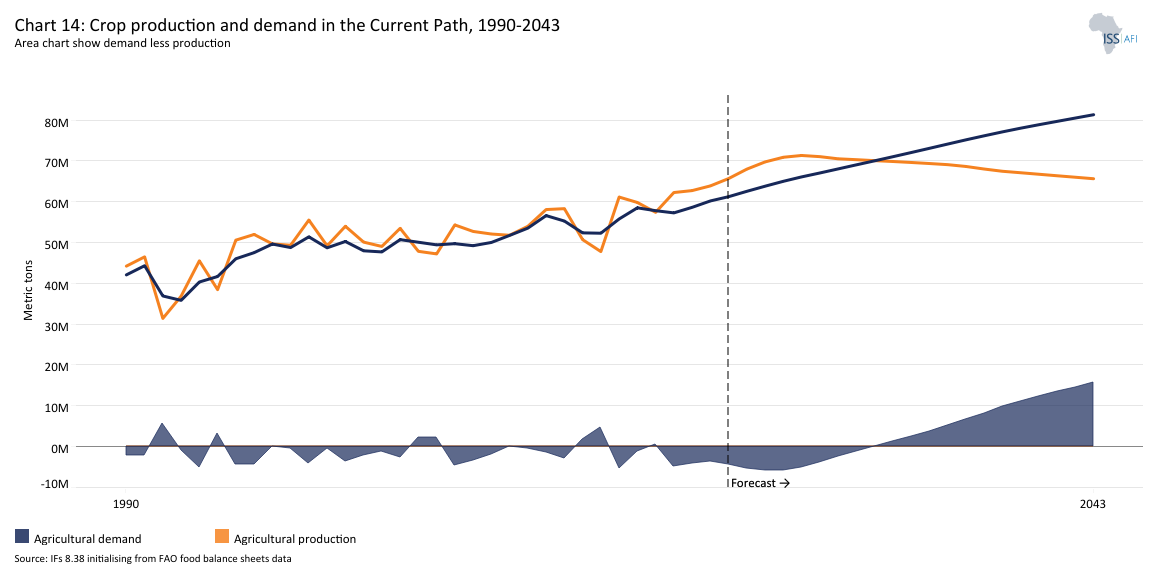
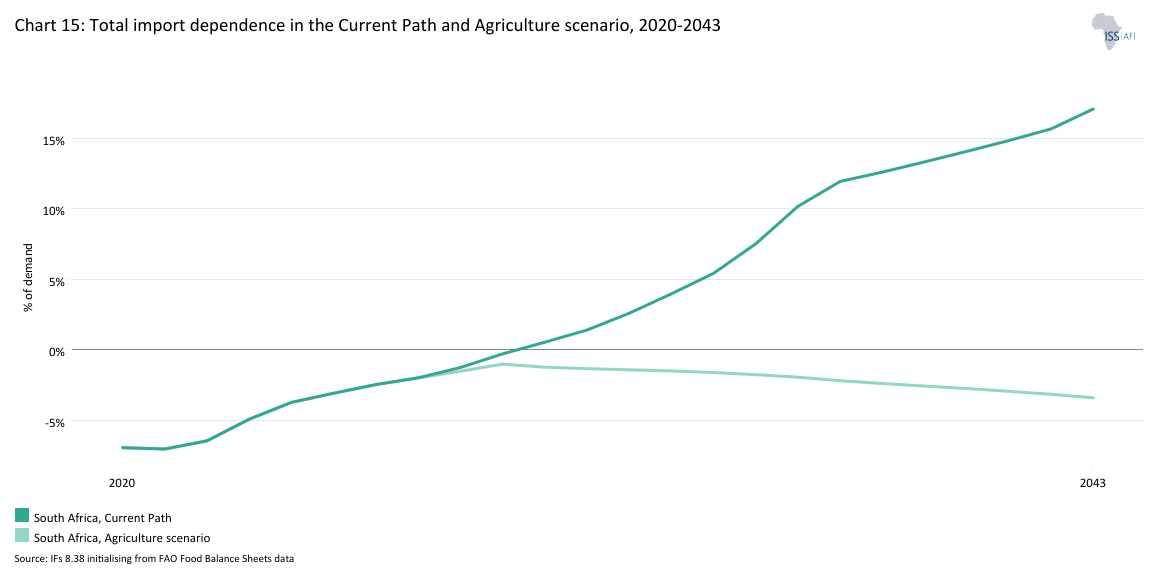
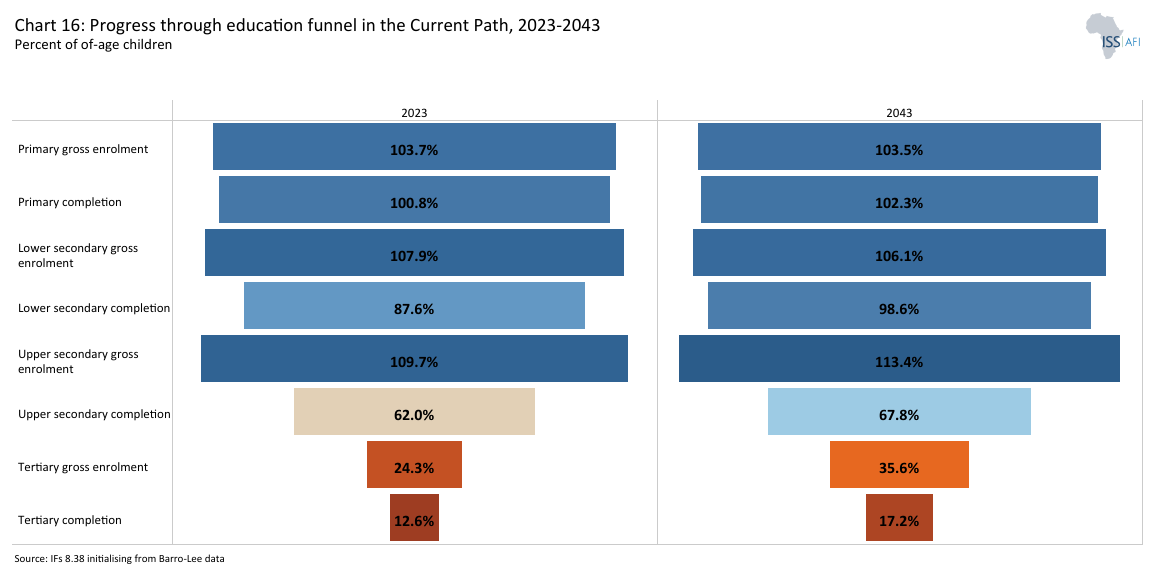
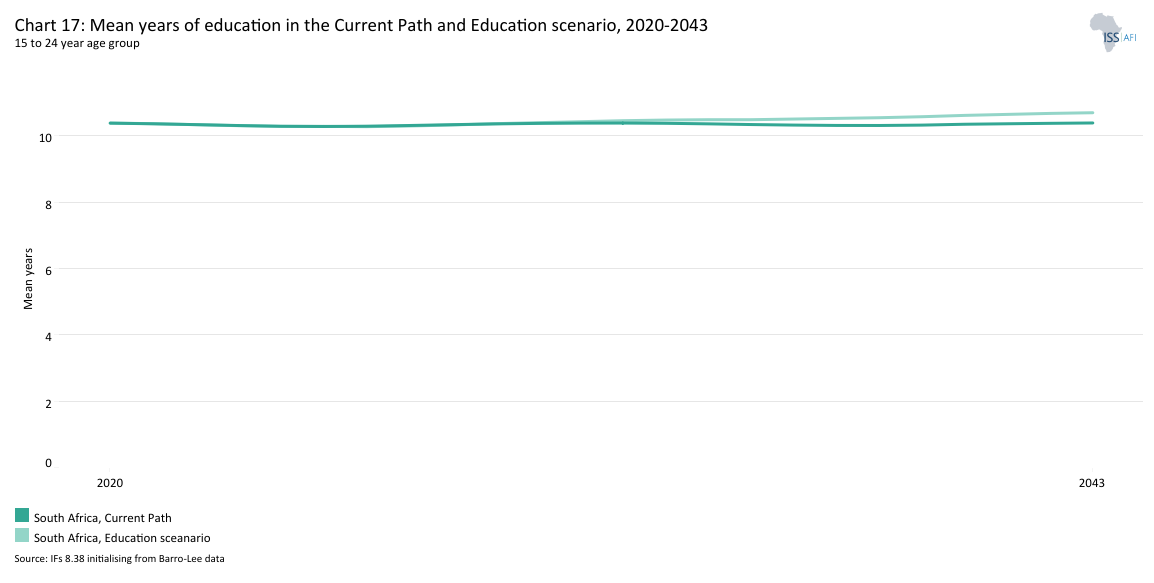
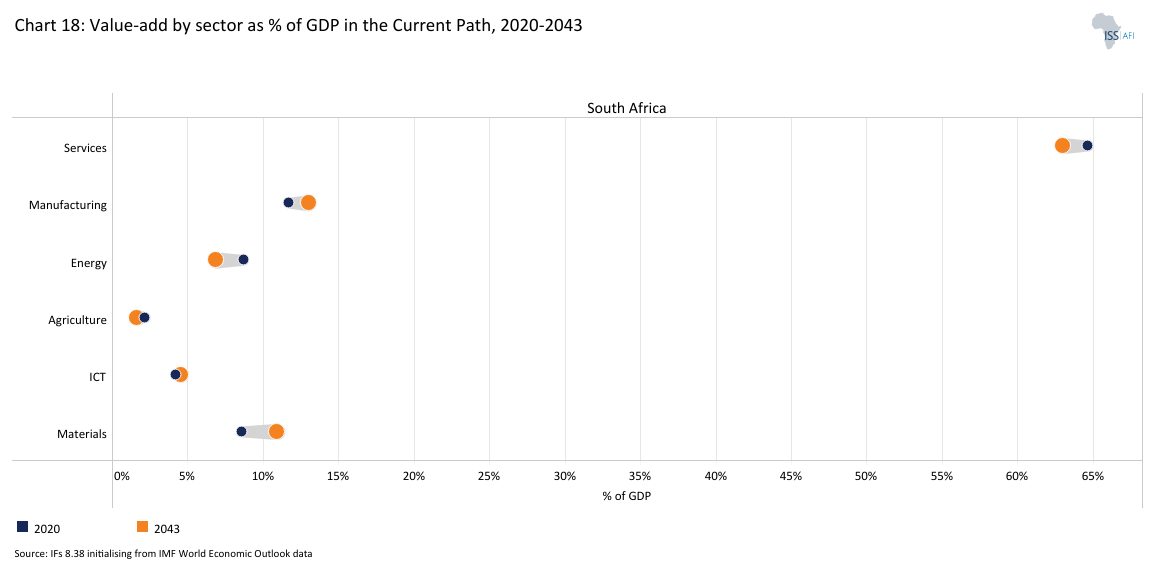
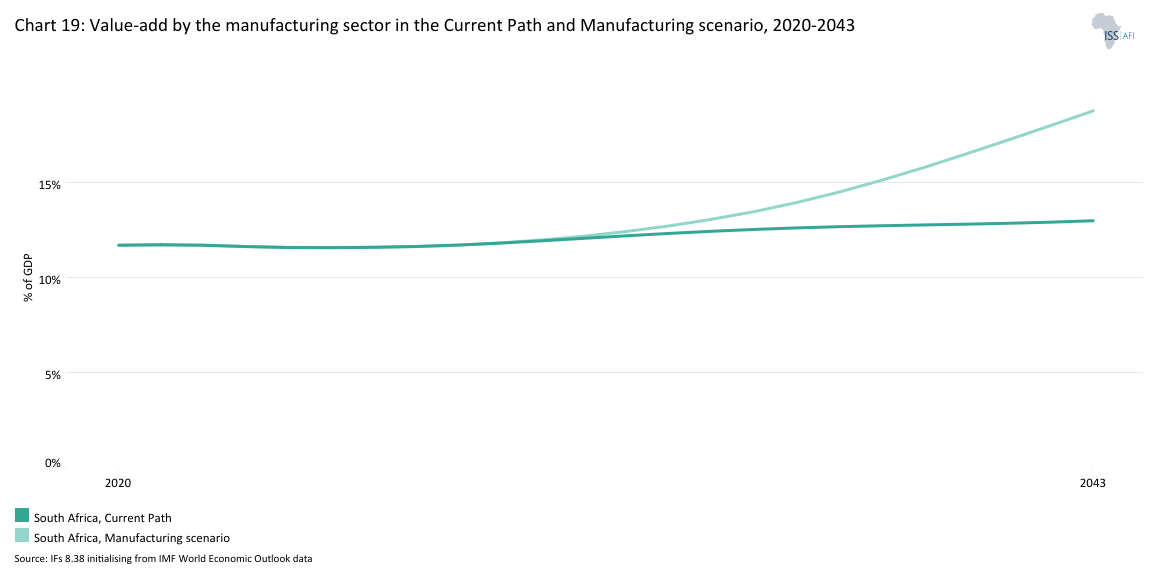
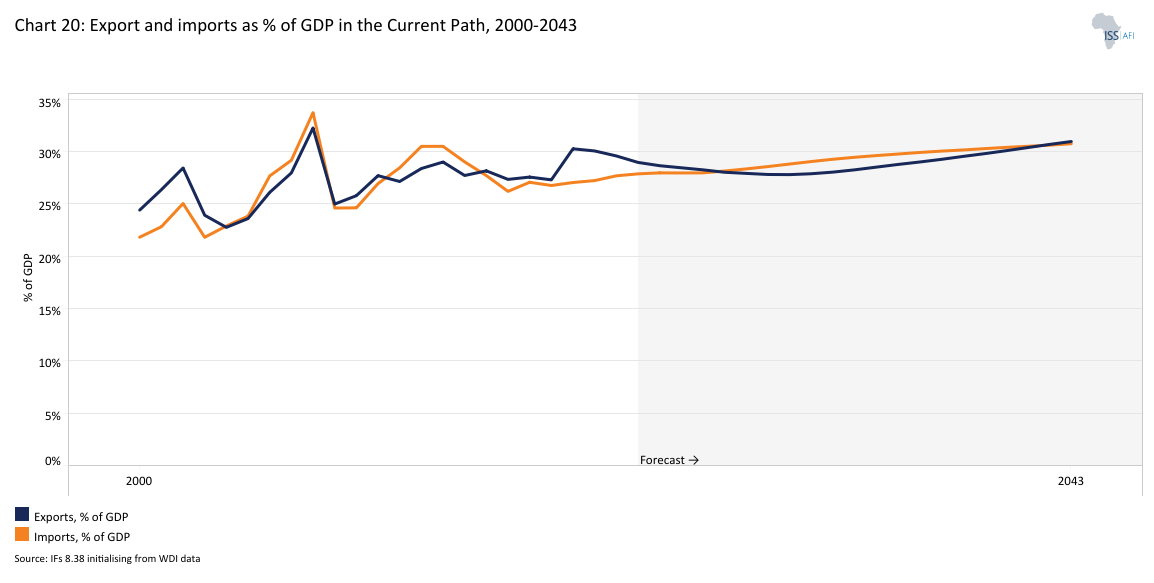
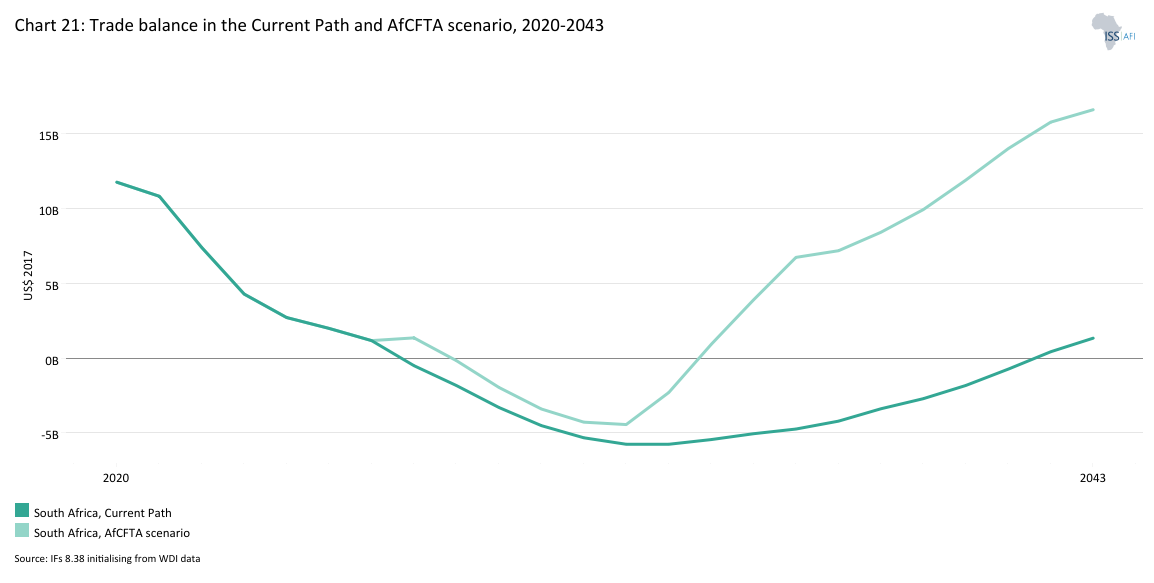
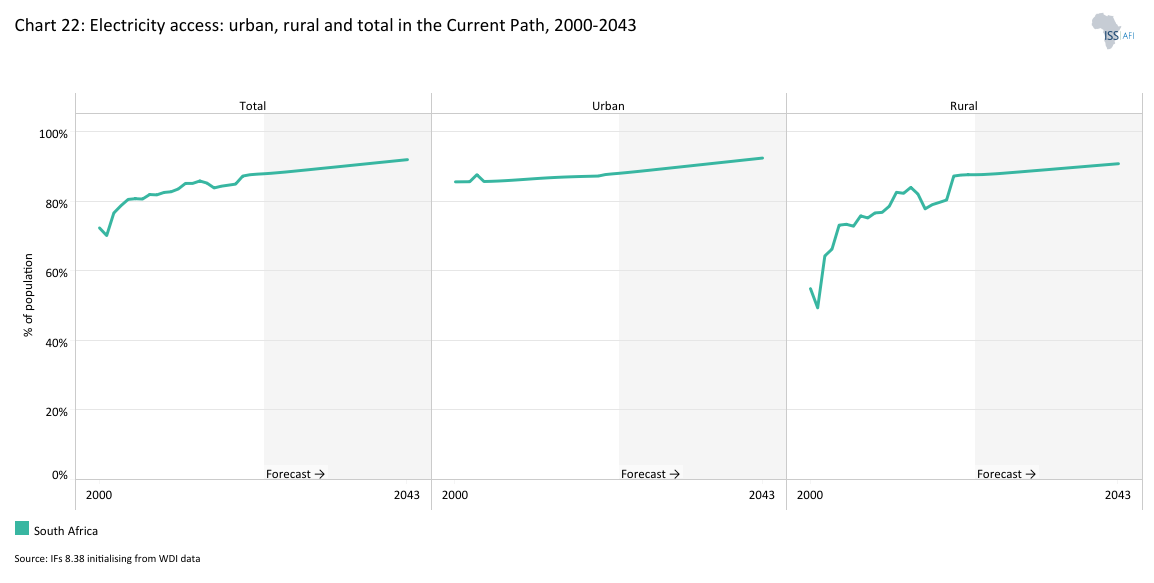
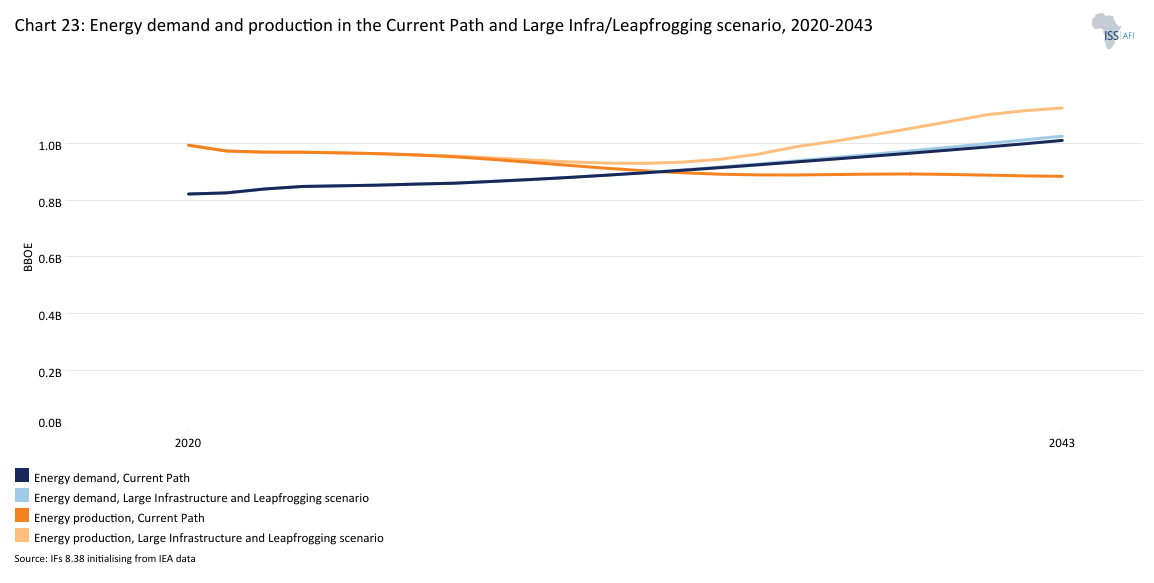
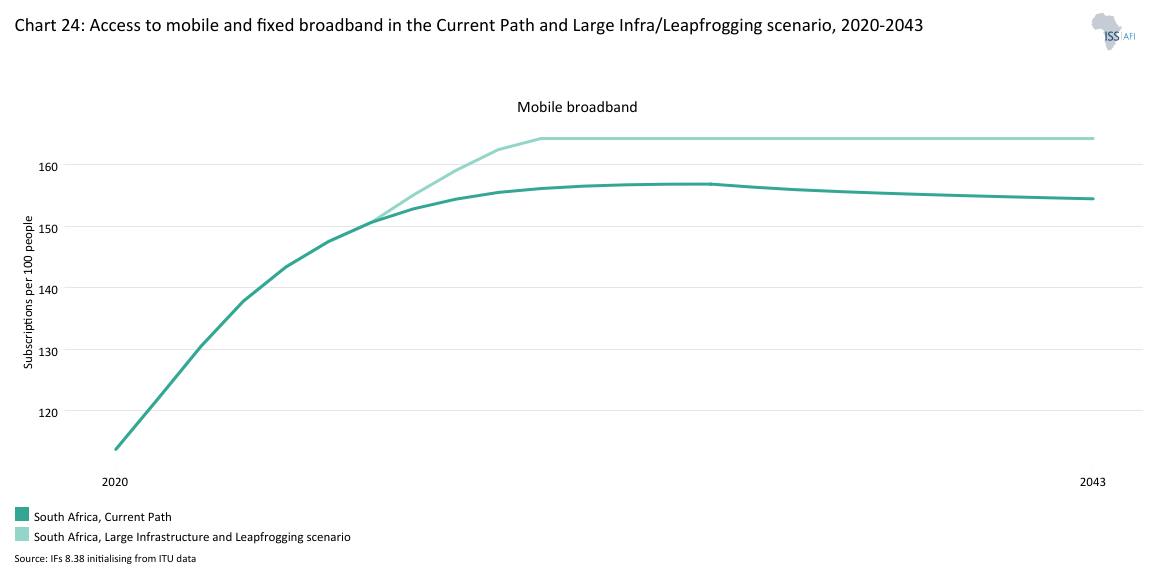
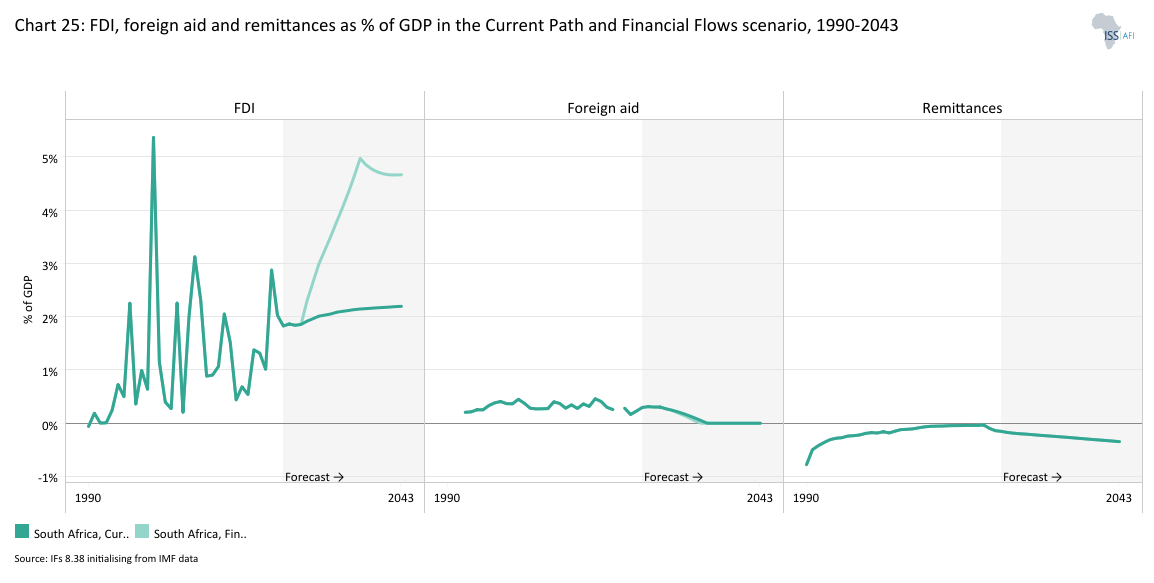
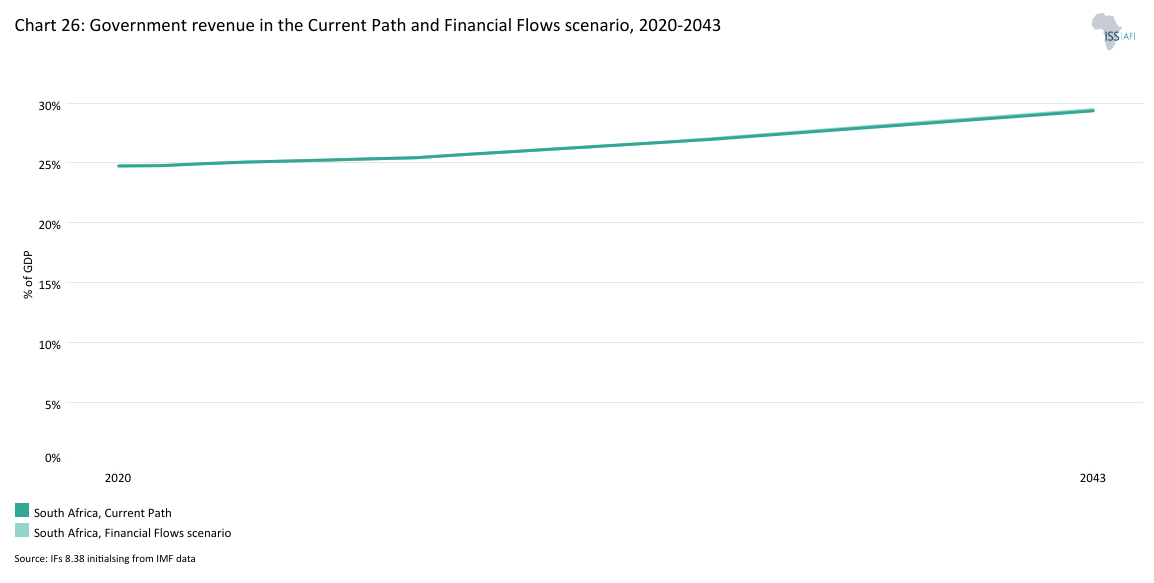
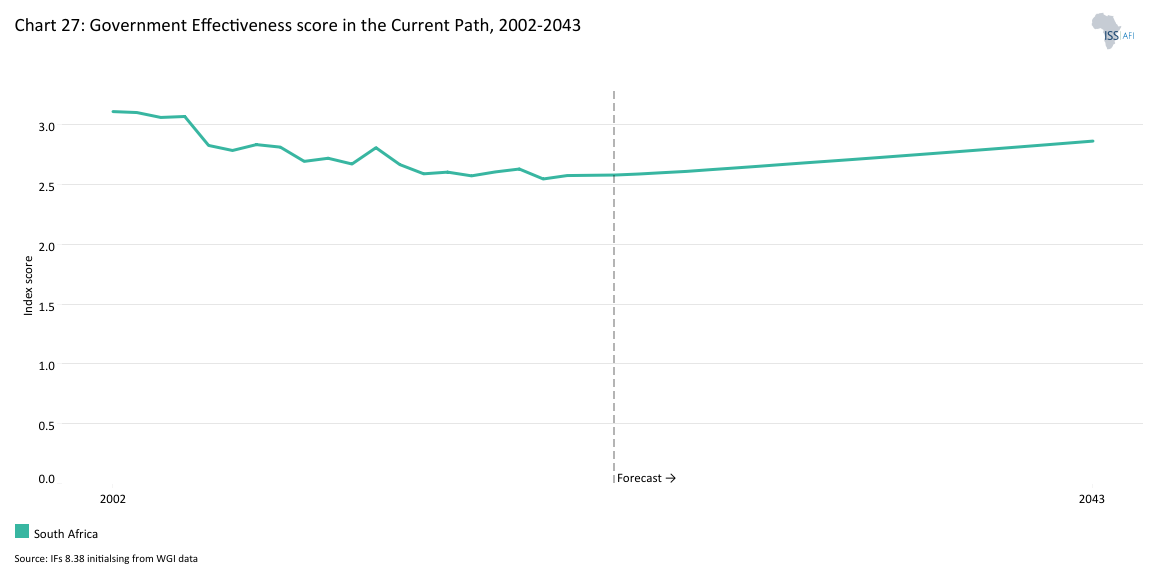
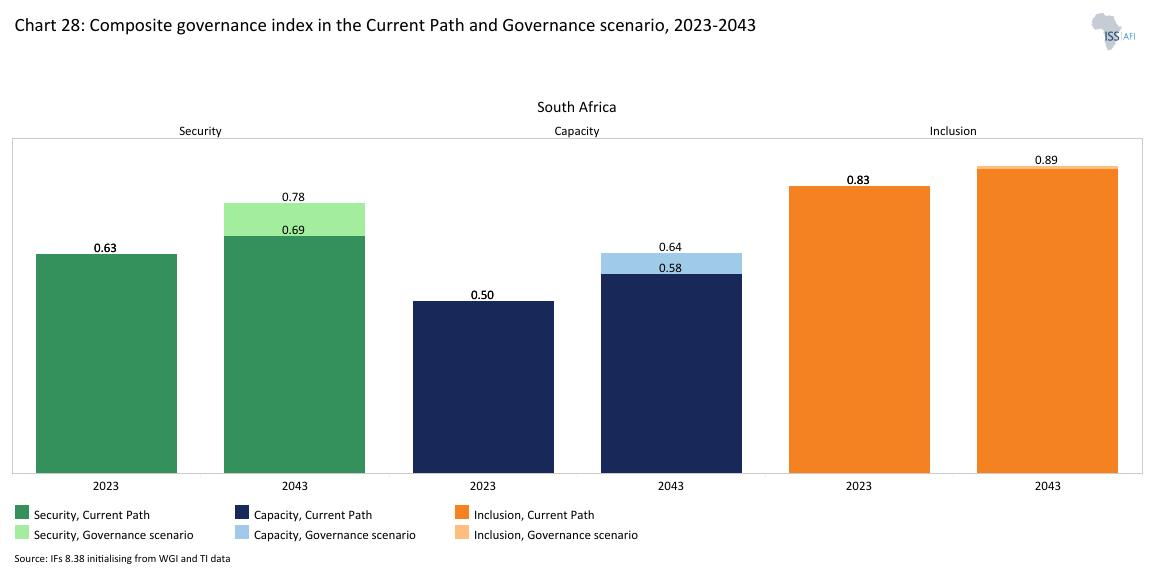
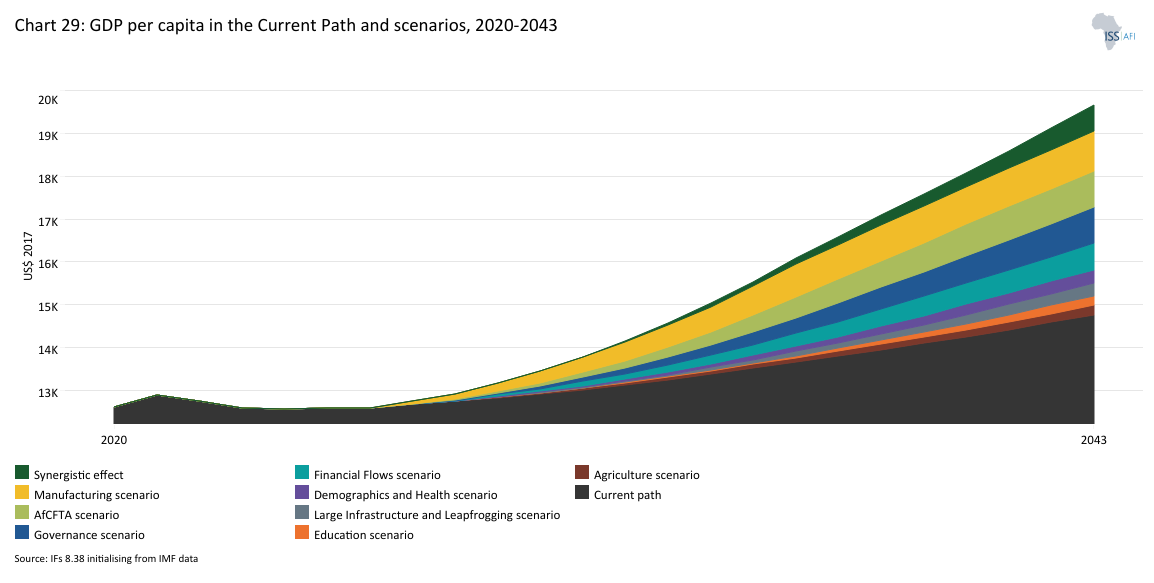
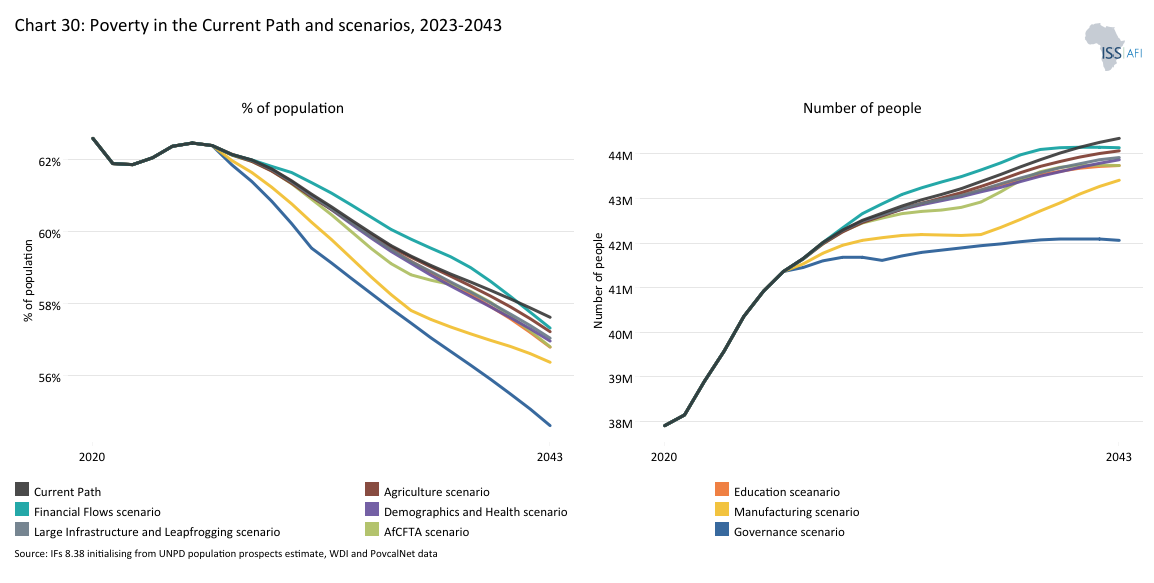
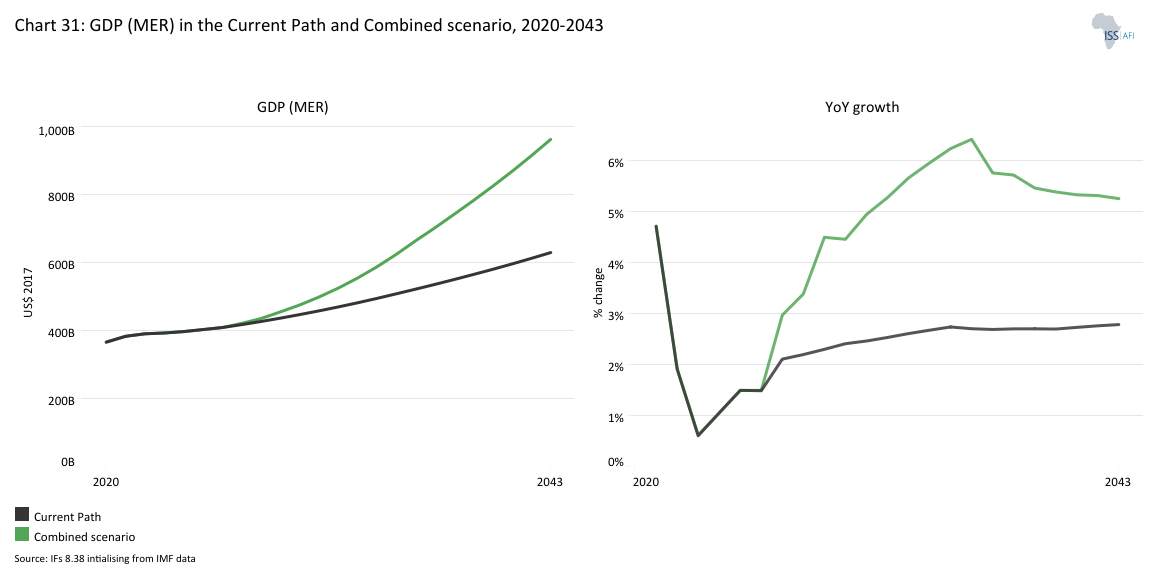
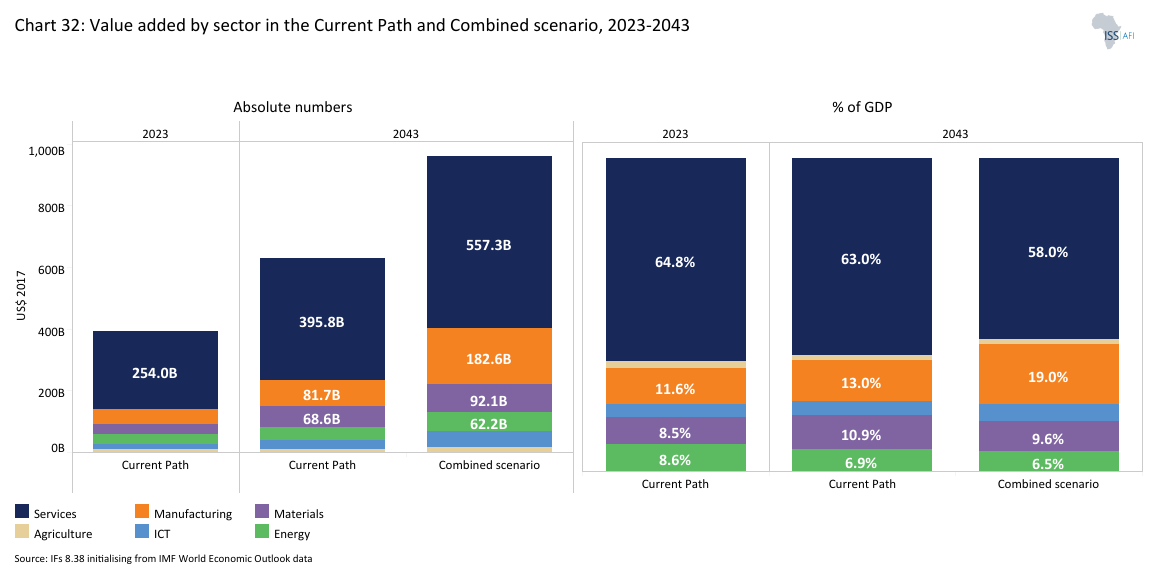
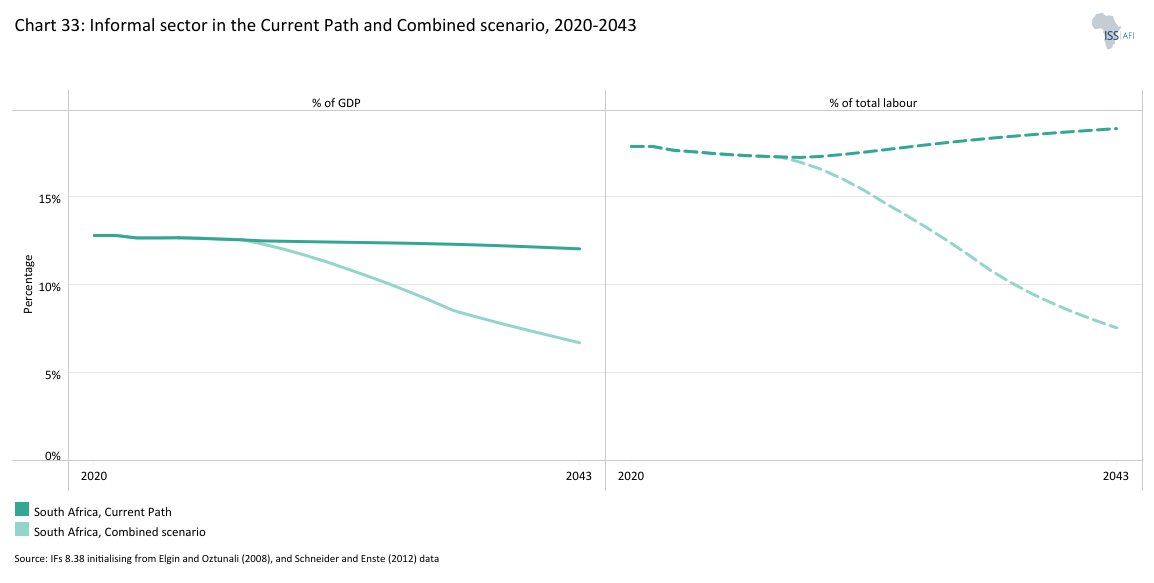
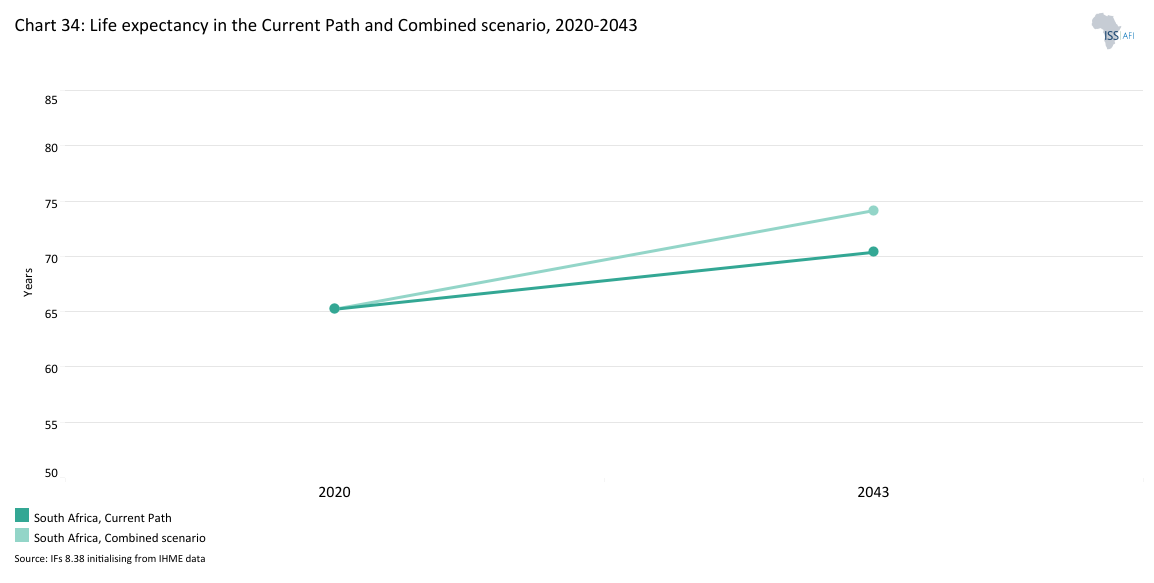
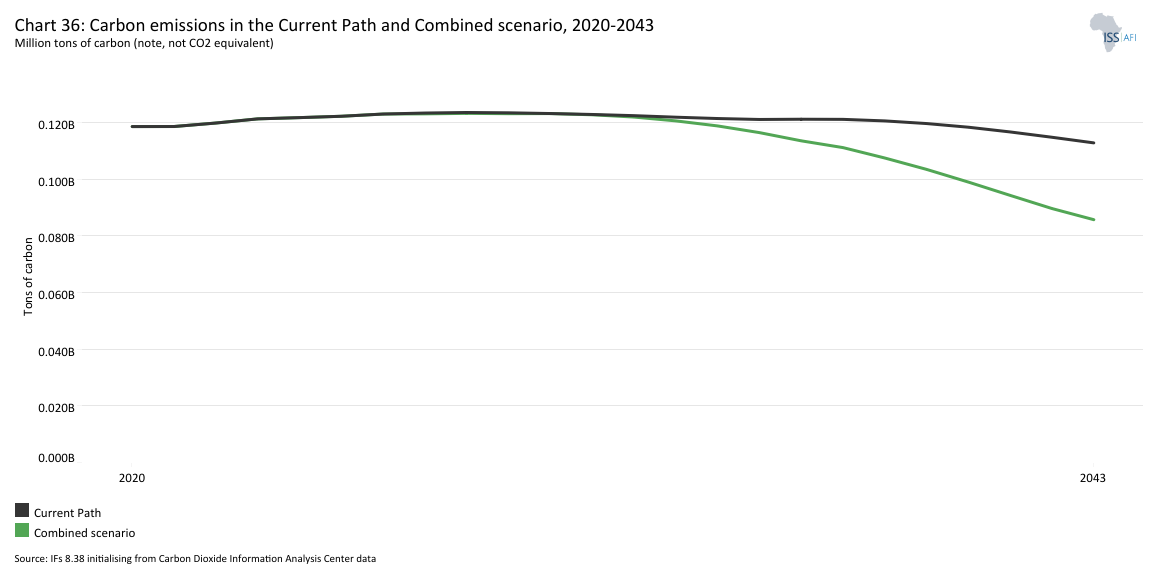
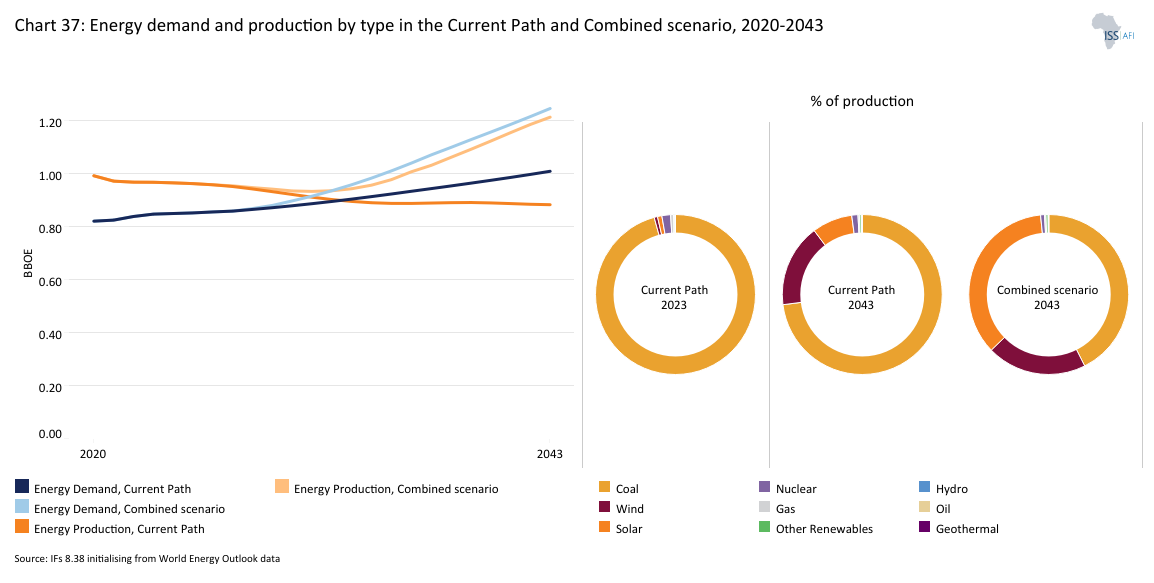
Chart 1 is a political map of South Africa.
Located at the southernmost tip of Africa, the Republic of South Africa is one of eight upper-middle-income countries (UMICs) on the continent. It is a member of the Southern African Customs Union (SACU) and the Southern African Development Community (SADC) and is situated in the subtropical zone of the southern hemisphere. Its vast coastline stretches from the tropical border of Mozambique in the warm Indian Ocean, around Africa’s most southern tip and to the border of Namibia’s cold Atlantic Ocean. The country’s geographical location and complex topography mean that South Africa is subject to a range of climatic conditions. Annual rainfall is highly variable, following a declining pattern from the wet and humid eastern coast to the arid western coast. South Africa shares borders with Namibia (which it previously administered), Botswana and Zimbabwe to the north, Mozambique and Eswatini to the east, and completely surrounds the independent Kingdom of Lesotho.
South Africa has nine provinces. The economic heartland, the province of Gauteng, comprises the commercial hub of Johannesburg and the administrative capital, Tshwane (formerly Pretoria). The legislature, comprising a National Assembly and a National Council of Provinces, is situated in Cape Town, in the Western Cape province. Although the smallest province geographically, Gauteng has the largest population, with more than 16 million people, followed by KwaZulu-Natal on the east coast, with almost 13 million inhabitants. The Western Cape, Eastern Cape and Limpopo have between 6 and 8 million people each. Mpumalanga province has 5.3 million people, North West province has 3.8 million. The Free State and Northern Cape provinces have the smallest populations at 3 and 1.3 million, respectively.
Formerly the Union of South Africa, the country became an independent republic in 1961 and was, from 1948 to 1990, ruled by the whites-only National Party, which pursued policies of racial subjugation and separation known as apartheid. As the apartheid crisis deepened, South Africa experienced negative per capita economic growth over the two decades from 1973 to 1993, to the extent that 1993 incomes were back to those in 1970. Capital investment decreased, and ever-larger portions of the national budget had to be allocated to fund recurring expenditures. Infrastructure decayed, and efficiencies declined.
Internal revolt against apartheid saw successive waves of unrest that, together with global pressure, led to the unbanning of several political parties, including the African National Congress (ANC), and the release of Nelson Mandela from prison in 1990. These events followed the collapse of the Soviet Union and several years of armed conflict in the neighbourhood, during which apartheid South Africa was increasingly isolated from the international community and under various types of sporting, arms and financial sanctions. When it assumed power in 1994, following several years of negotiation towards power-sharing, the ANC inherited a country with bare coffers but high expectations from its majority black support base, who believed that political change would rapidly redress the neglect they had suffered over generations.
The constitutional negotiations, known as the Convention for a Democratic South Africa or CODESA, resulted in a liberal constitution with a clear separation of powers and an entrenched bill of rights. The election of Nelson Mandela as president in 1994 set in motion a comprehensive, if inconclusive, process of social, economic and political re-engineering. Within the first three years, the democratic government introduced new labour legislation that modernised the South African labour market and protected worker rights. Democracy also meant the abolishment of the efforts to establish independent homelands for various black ethnic groups (the so-called Bantustans), although traditional chiefs were left in place. The fragmented, race-based education departments were merged into a non-racial education system, and separate administrations were brought together. The previous four provinces were divided into nine, each with local, provincial and national elected representatives. What had been a centralised, racially determined state with a limited franchise adopted a universal franchise and a semi-federal model, extending political, economic, and social rights to all citizens through a progressive Bill of Rights. South Africa today has a free media, an independent judiciary and an active civil society.
A wide-ranging process of land restitution followed in the wake of an inquiry into the excesses of apartheid (the Truth and Reconciliation Commission). Concerted efforts were also made to alleviate extreme poverty and advance the interests of the majority black population.
In the years following its transition to democracy, improved foreign perceptions of South Africa's attractiveness for doing business led to significant foreign financial inflows. Large segments of the South African economy were opened up to international competition, and labour productivity increased from 1995. For the next 15 years, until 2008, the country experienced growth and improved income levels, yet at a much slower pace than it could have, due to policies that prioritised addressing the socio-economic imbalance created by apartheid, but effectively constrained growth.
The opening up of the South African economy also coincided with the explosive, export-driven growth of China and other countries reaching African shores. Not accustomed to international competition and having decided to remove most of its previous tariffs and other protections, South Africa experienced deindustrialisation, such that, by 2024, the World Bank wrote about a 15-year loss of economic growth momentum and underperformance compared to other middle-income countries.
Despite its challenges, South Africa competes with Nigeria for the largest economy in Africa and has a relatively high average income per capita compared to most other countries in the region, although it is lower than that of Seychelles, Mauritius, Botswana, and Equatorial Guinea. The South African economy is also more globally interconnected than most other African countries, reflected in its status as Africa’s largest trading nation (by value).
However, colonialism, apartheid and ongoing poor governance and corruption have resulted in extreme levels of inequality, with high rates of poverty, unemployment, crime and violence, exacerbated by low productivity and a high-wage economy.
Unlike many other countries with similar challenges, South Africa has a relatively small informal economy (which contributes to its high unemployment and inequality rates), and an increasing portion of its population survives on social grants from the government. It has a thriving tourist industry, but declines in the contribution from the mining sector and competition from China have contributed to a steady decline in industrialisation. The country has a sophisticated private sector, highly developed financial markets, and substantial natural assets. However, savings rates as a percentage of GDP are low, approximately eight percentage points below the average for upper-middle-income countries (UMICs) globally. Its small commercial agricultural sector is efficient, and South Africa is one of a handful of food-secure African countries.
Among the labour-intensive sectors, mining was historically the most important (note that in our modelling, mining is part of the materials sector). In 1980, mining accounted for approximately 21% of the GDP. It peaked at providing 760 000 jobs a few years later, mainly on the back of South Africa’s enormous gold mining industry, which was its primary mining product. By 2023, that number had declined to 6.2% of GDP, and employment stood at 477 000 persons. Mining is particularly important in the poverty-stricken North West, Limpopo, Mpumalanga and the Northern Cape provinces, but has declined and has given rise to a large criminal and illegal artisanal sector, so-called zama zamas. The remaining mining sector is export-oriented, largely due to limited domestic demand for most commodities, and it still holds significant future potential. South Africa has, among other resources, the world's largest known reserves of platinum group metals (PGMs), chrome ore, and manganese ore, as well as the second-largest reserves of zirconium, vanadium, and titanium.
Mining is tightly woven into the fabric of South Africa’s history and provided the stepping stone for its industrial development. Still, it has deteriorated in recent years due to government inefficiencies that have hindered exploration, resulting in slow progress in rolling out a new mining cadastre, with the phased rollout beginning in the second half of 2025. As a result, there is no pipeline for new projects (although some progress has been made with the establishment of an exploration fund), and the sector is subject to numerous and expensive social responsibility obligations, as well as the effects of organised crime syndicates. It was therefore unsurprising that, in 2023, Canada’s Fraser Institute ranked South Africa near the bottom of its global mining survey, at 57 (out of 62 jurisdictions assessed).
Under the administration of former President Jacob Zuma, from May 2009 to early 2018, South Africa experienced steadily declining levels of investor confidence, state capture, and increased government inefficiencies, accompanied by a decline in average incomes. Zuma was succeeded by Cyril Ramaphosa, who then had to contend with the COVID-19 global pandemic, slower economic growth, and the divisions within the ruling ANC, which had become increasingly corrupt. Prospects are improving, however. Crippling electricity shortages began to ease in 2024, after more than a decade of hobbled growth, during which the government failed to respond to repeated warnings of imminent shortages. However, the shortages and subsequent high prices remained a constraint on economic growth as the country belatedly scrambled to add additional capacity to the grid. Hard work will be required to avoid a similar water-shortage situation, despite repeated warnings of an impending crisis over several years. The demand for water in both Gauteng and eThekwini has grown rapidly, primarily due to population growth and inadequate maintenance, resulting in significant non-revenue water losses.
The ANC, which has won every election since the country’s first democratic elections in 1994, saw its support plummet to 40% in May 2024 as evidence of corruption, inaction and poor policy that overwhelmed the country. Ironically, its decline was significantly aided by Jacob Zuma, whose new party, uMkonto we Sizwe (MK), drew significant support from the ANC. Previous elections have seen a steady decline in voter turnout, and politics is increasingly fragmented. In addition to the Western Cape, which has been governed by the Democratic Alliance since 2009, the ANC lost its majority in Gauteng, KwaZulu-Natal, and narrowly in the Northern Cape. The subsequent governing alliance (formally termed a Government of National Unity, although not all parties are members) has given hope that the country could unlock improved service delivery, reduce rampant corruption and reduce crime.
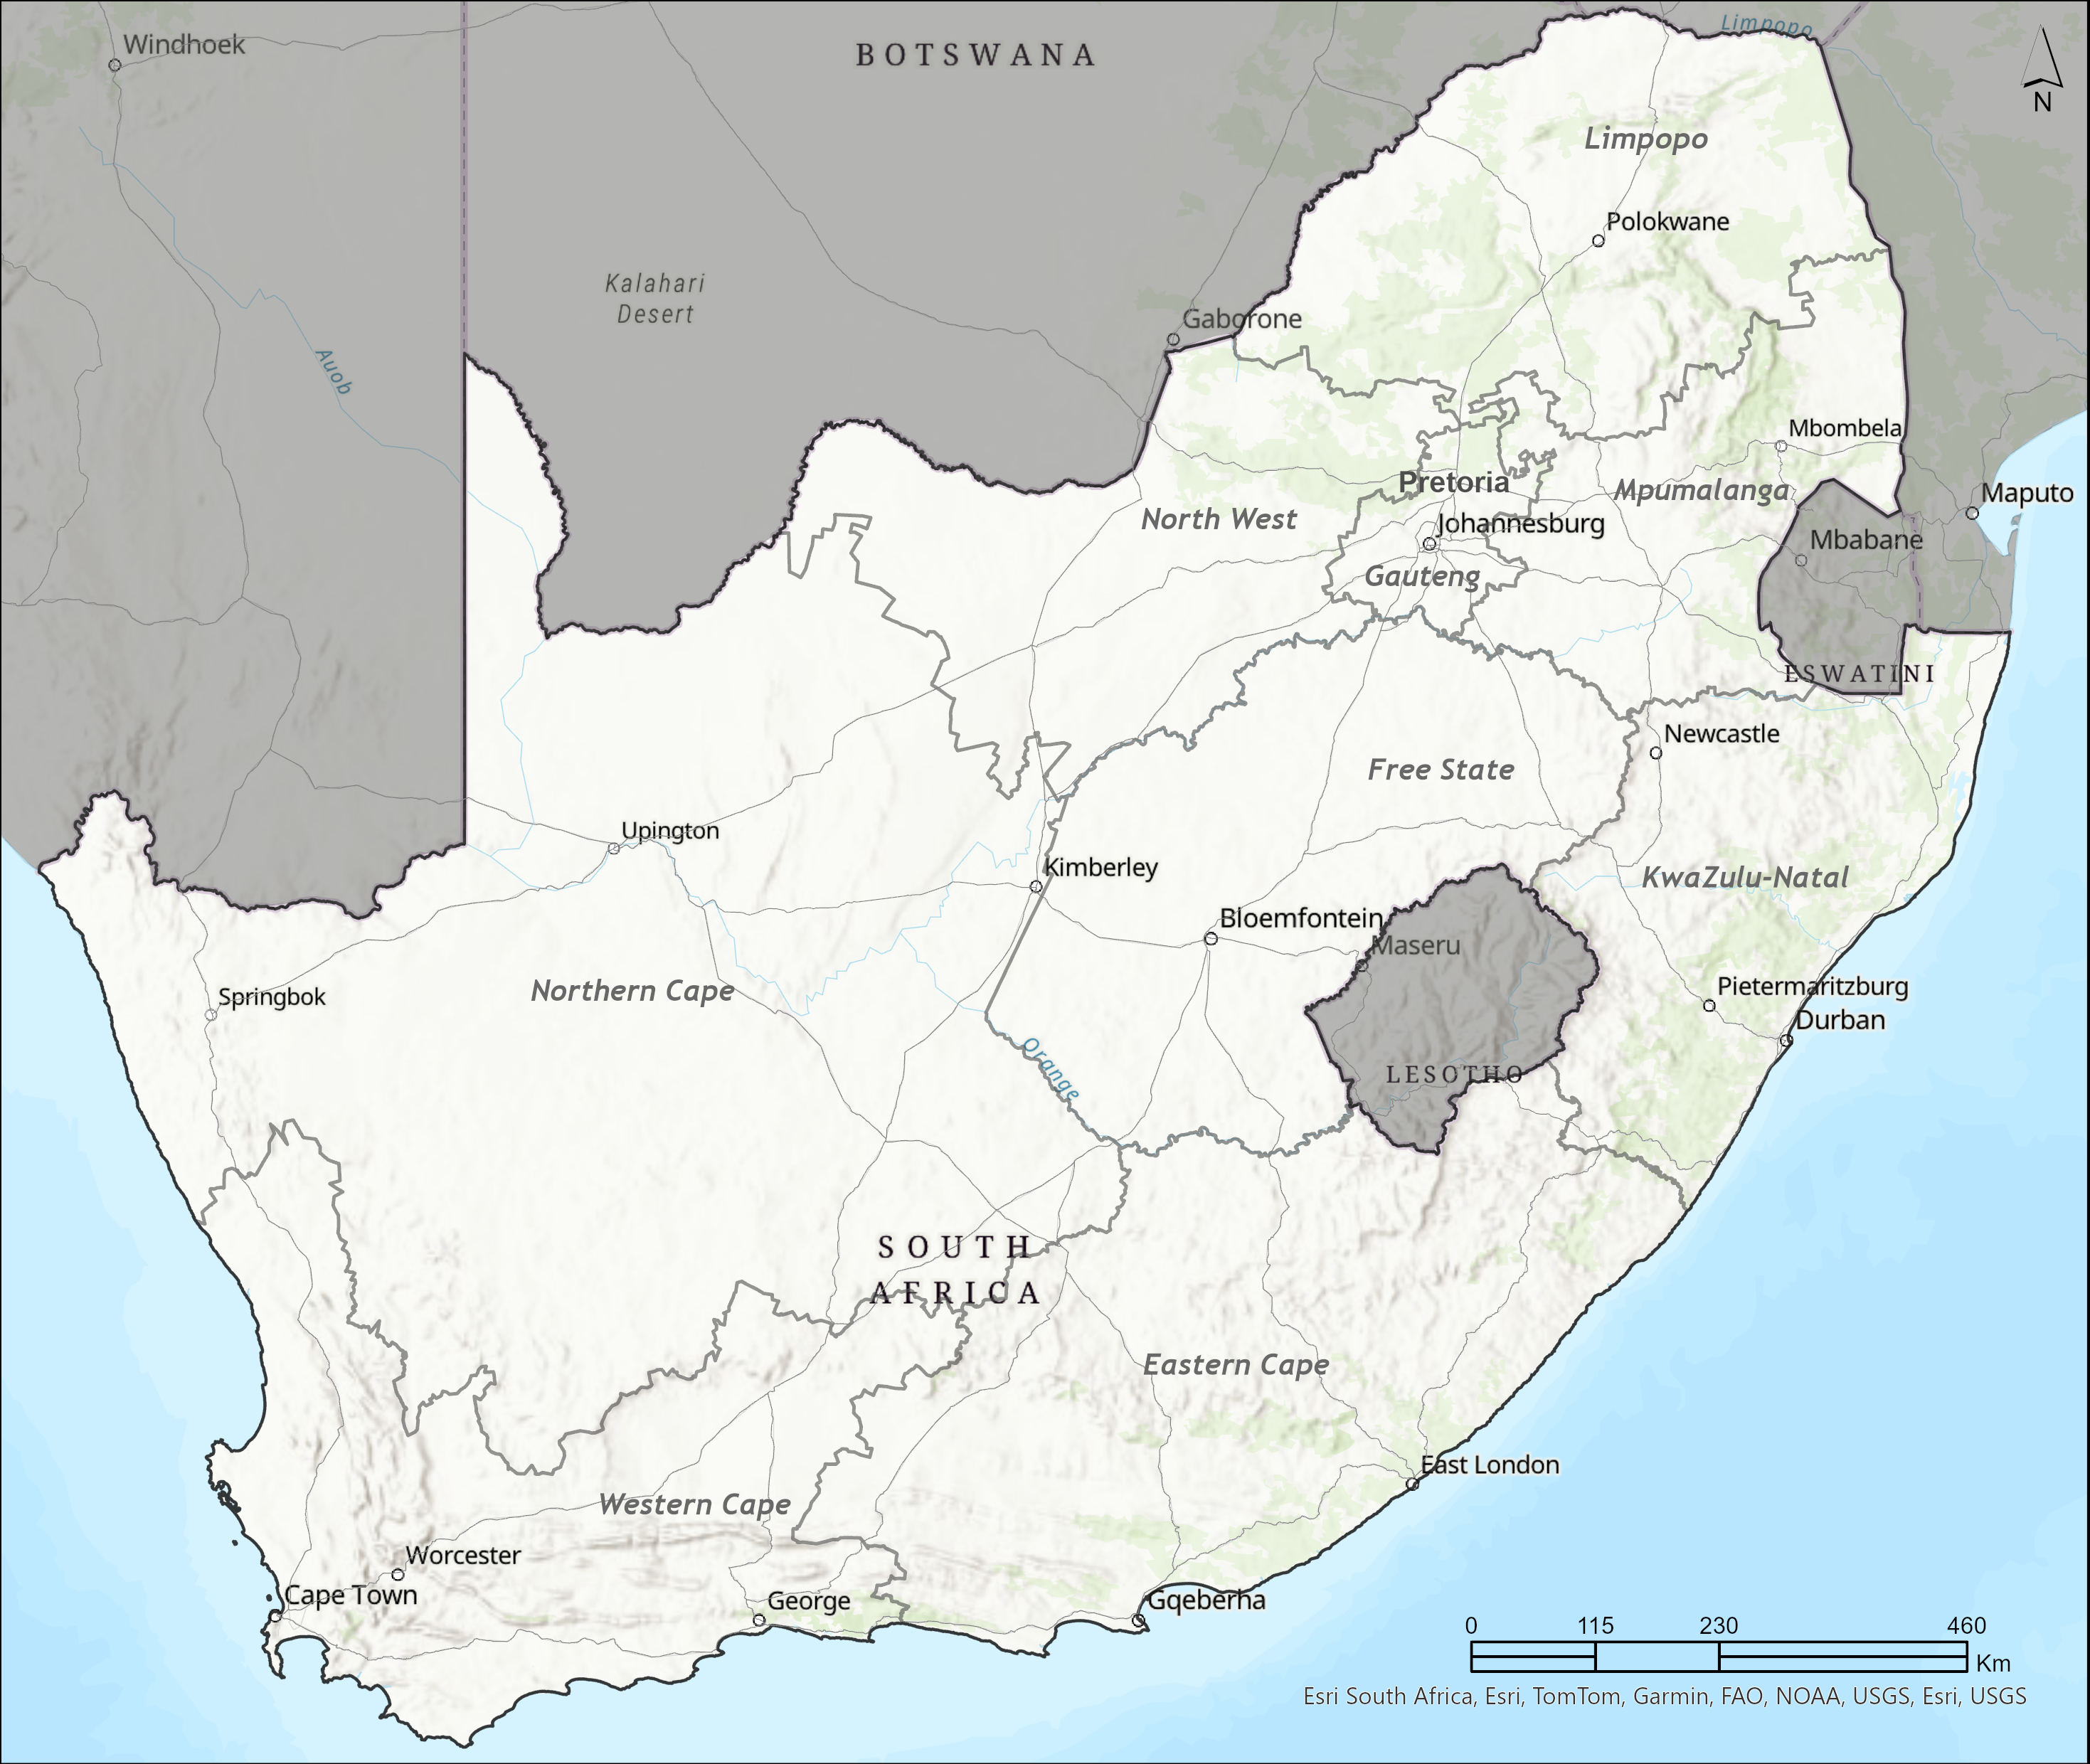
Chart 2 presents the Current Path of the population structure from 1990 to 2043.
Population dynamics play a crucial role in economic development, and South Africa has considerable potential, given its favourable ratio of working-age population to dependents, suggesting a demographic dividend. However, its population is in poor health, primarily due to the effects of HIV/AIDS and Tuberculosis (TB), which is closely linked with HIV/AIDS, compounded by various other factors examined below as part of the Demographics and Health scenario. Education quality is generally low (see the Education scenario below).
South Africa is one of the few countries in Africa that conducts a regular population census. However, the most recent Census 2022 was conducted digitally during the COVID-19 pandemic, and since the results differ from other projections, they require careful consideration. Therefore, this analysis does not fully incorporate the results.
Given its history, race remains a significant factor in South Africa. Black Africans make up the majority of the population at 81%, followed by the coloured population at 9%. Due to low fertility rates and significant emigration, the white population percentage declined to 8% in 2024, while that for Indians/Asians is at 2%.
The median age of 29 years in 2023 is the sixth-highest in Africa, behind Algeria, Morocco, Tunisia, the Seychelles, and Mauritius. By 2043, South Africa’s median age is expected to increase to 34 years.
The country’s population is expected to grow to approximately 69 million by 2030 and 77 million by 2043. Its average total fertility rate fell from 3.7 births per woman in 1990 to around 2.2 in 2023. South Africa is expected to reach a replacement level of 2.1 births by 2028. However, large inward migration flows from Southern Africa have introduced uncertainty into these forecasts. Our Current Path includes net inflows of two million migrants to South Africa from 2024 to 2043.
In addition, the population is slowly ageing. Whereas nearly 6.6% of South Africans were 65 years old and older in 2023, by 2043, that portion is expected to increase to 10.7%. While this is not a significant trend compared to many developed countries experiencing rapid ageing, it does indicate a gradual demographic shift that will increase healthcare costs, given the expenses associated with treating non-communicable diseases typical of older populations. At the same time, a smaller child population could offer a much-needed opportunity to improve educational quality.
Chart 3 presents a population distribution map for 2023.
The average population density in South Africa is two persons per square kilometre, roughly equivalent to the average for Africa. The density ranges from the dense metropolitan areas of Johannesburg to the sparsely populated plains of the Karoo in the Northern Cape. The coastal areas of KwaZulu-Natal and the Eastern Cape are more populated, while the Northern Cape, with its arid climate, has the lowest population density. There is considerable population movement between provinces. The Eastern Cape, Limpopo, and KwaZulu-Natal generally record the highest rates of outward migration, while Gauteng and the Western Cape experience the highest rates of inward migration, as people seek economic opportunities. This migration puts pressure on urban areas, increasing demand for housing, infrastructure and basic services.
Climate change also intensifies resource insecurities, contributing to intra- and inter-provincial migration. Factors such as drought in the Northern Cape province and soil erosion and degradation in the provinces of Limpopo and the Free State drive people, particularly those with low incomes, to migrate to urban areas in search of better opportunities.
Immigration trends from StatsSA reveal a steadily growing migrant population, dominated by young adults in the region, particularly from Zimbabwe and, to a lesser extent, Mozambique, Lesotho, and Malawi, who mostly gravitate towards the Gauteng province. Zimbabwe leads in sending students for higher education, while Ethiopia, the Democratic Republic of Congo (DR Congo) and Somalia are significant sources of refugees. Migration inflows have become an emotional issue in South African politics, with accusations that foreigners are involved in crime and taking jobs from South Africans.
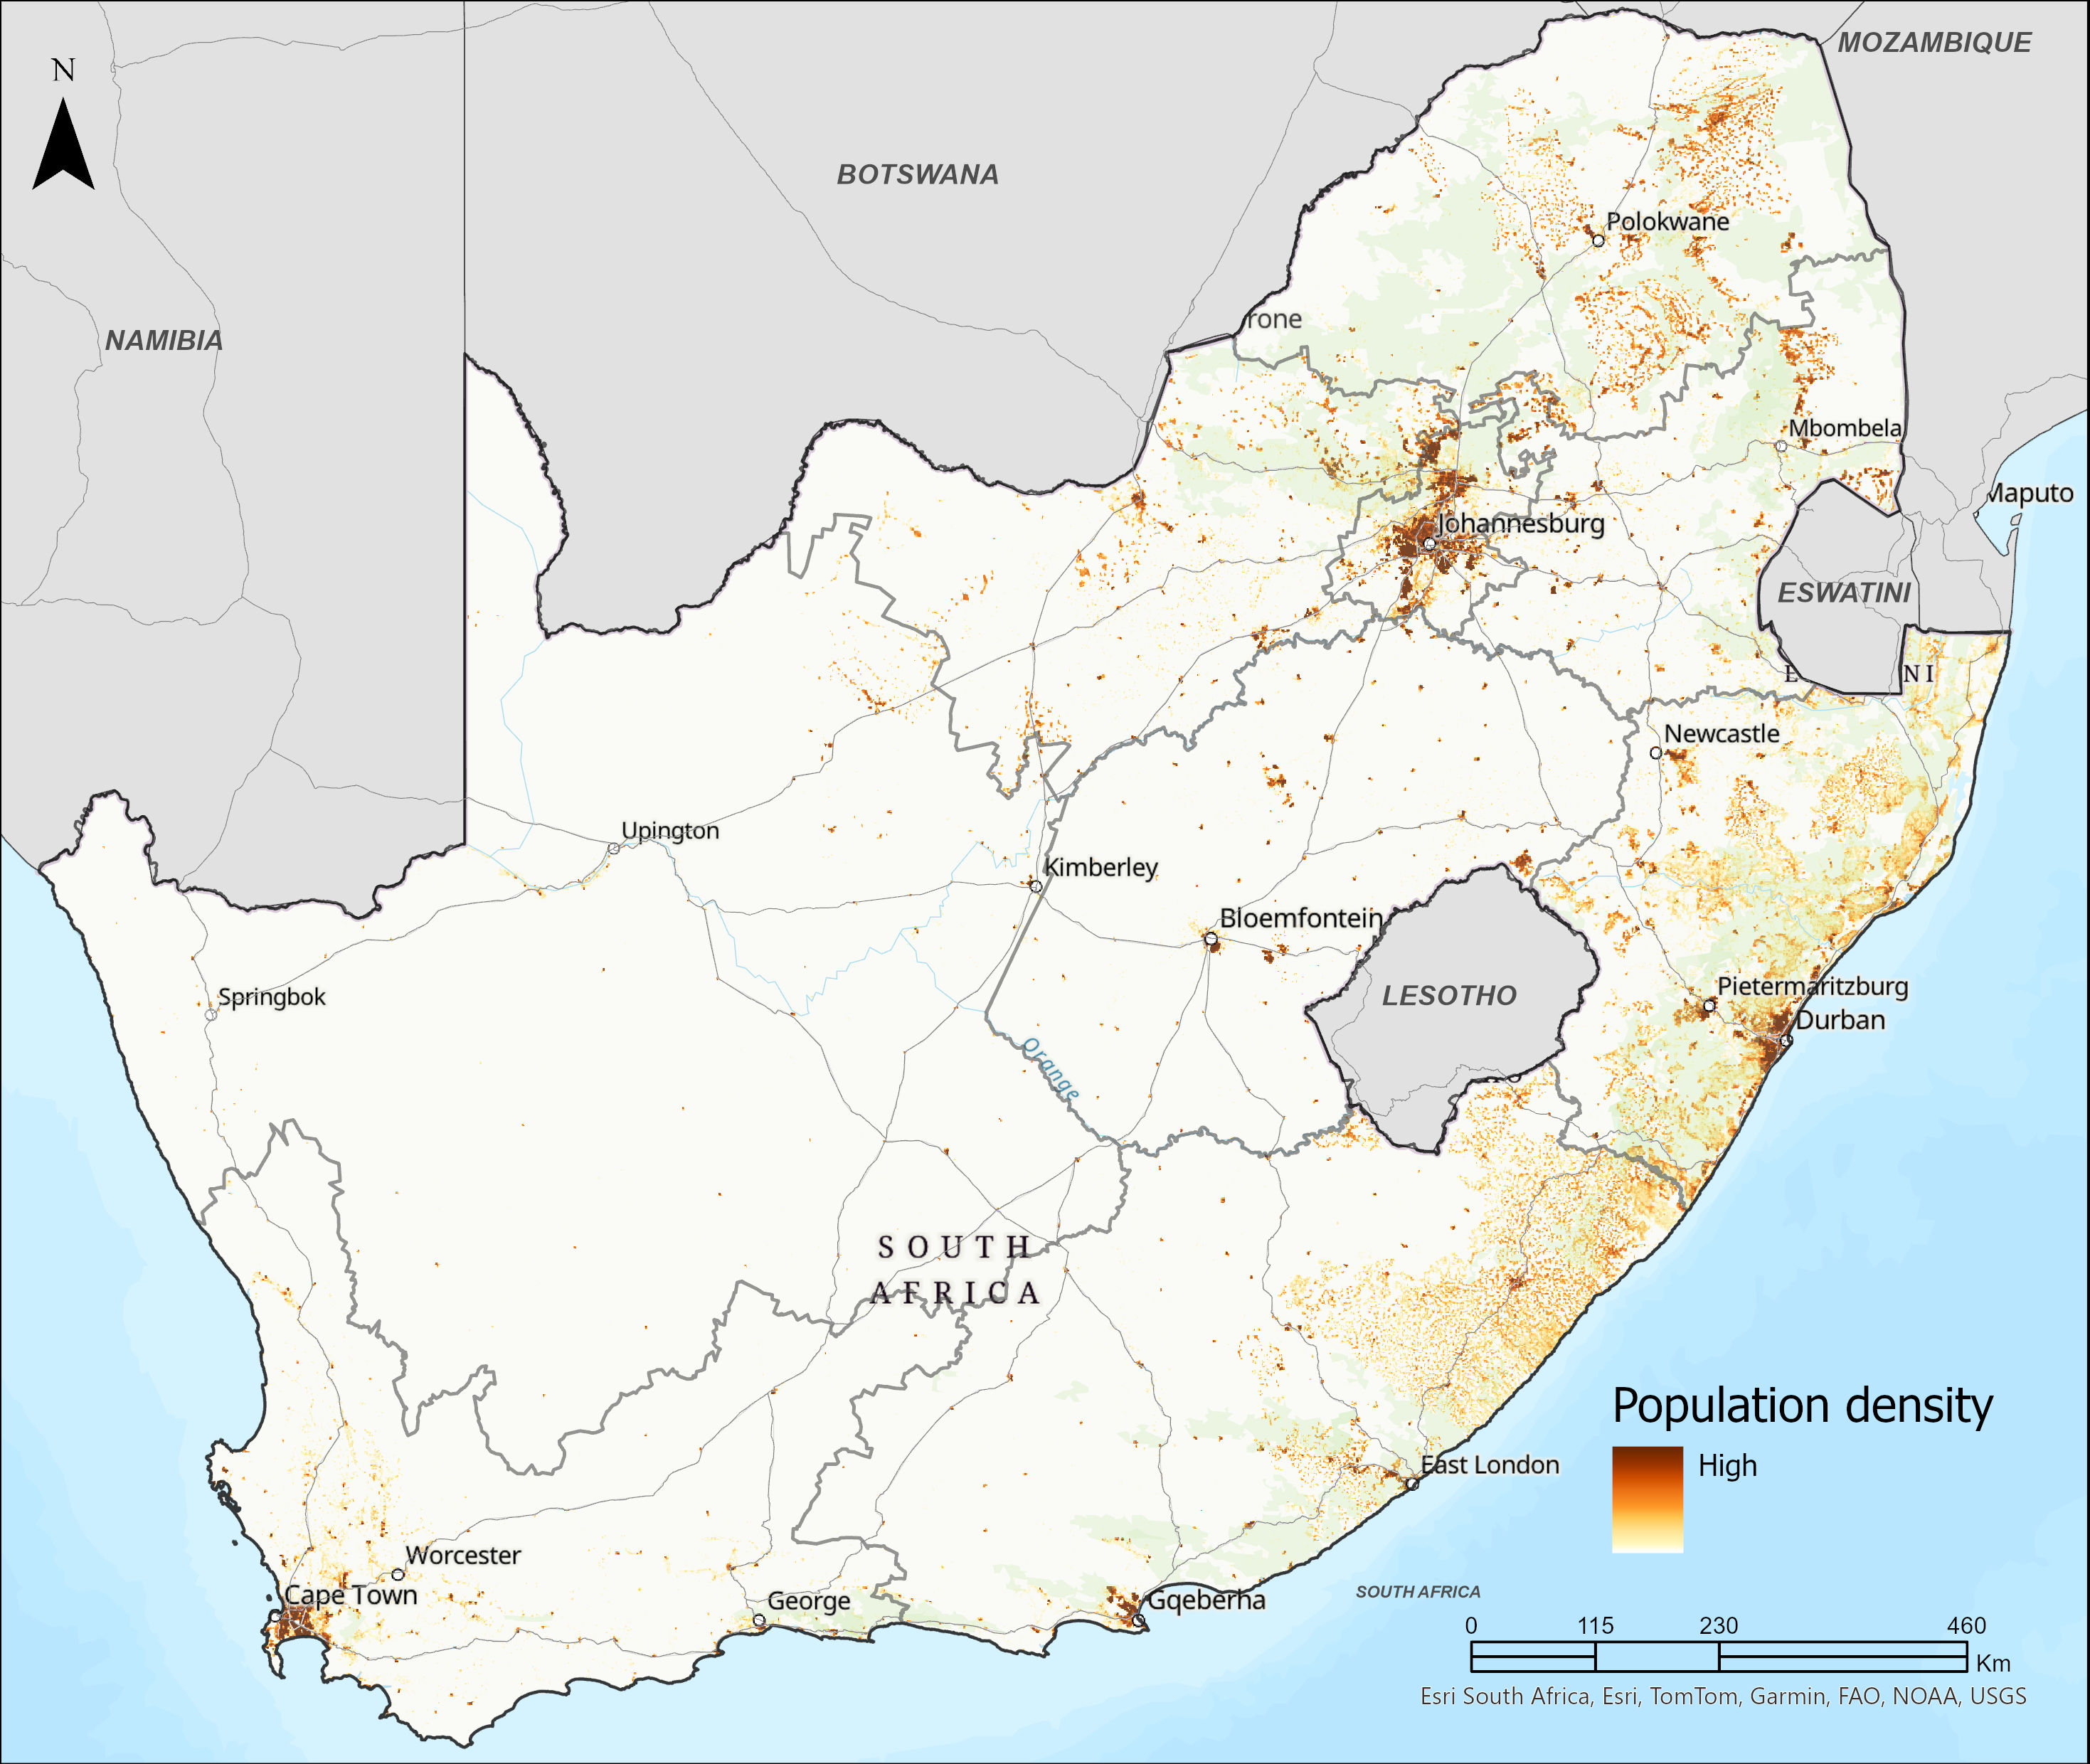
Chart 4 presents the urban and rural population from 1990 to 2043.
South Africa’s cities and urban areas have undergone significant transformation over the past century, driven initially by apartheid policies, industrialisation and economic opportunities. Steady migration from rural areas to cities and towns led to a sharp increase in urbanisation. At the start of the 20th century, only about 10% of the population lived in urban areas. By 1960, nearly 47% of the population resided in urban areas and by 1987, this figure had surpassed 50%, marking a significant shift towards urbanisation. By 2023, 66% of South Africa’s population lived in more than 1 200 cities and towns connected by a complex network of roads and highways. South Africa is the 3rd most urbanised country in SADC, after Botswana and Angola. By 2043, 72% of South Africans are expected to reside in urban areas.
Apartheid-era policies still have a bearing on today’s urban and rural spaces. The former Group Areas Act, which relegated black communities to peripheral townships, created a fragmented urban landscape characterised by long distances between former black, coloured and Indian residential areas and places of work, high transportation costs and inadequate infrastructure. Similarly, rural areas, including former homelands, were systematically marginalised, leaving a legacy of deep-seated economic and social challenges such as unemployment, inadequate infrastructure and high levels of poverty.
Several policies have been implemented over the past three decades to address these disparities with mixed results. The Reconstruction and Development Programme (RDP), launched in 1994, aimed to improve housing and infrastructure in disadvantaged areas. The Integrated Development Plans (IDPs), introduced in 2000, sought to promote coordinated and sustainable urban development, with some success. Strategic Development Plans (SDPs) and the National Spatial Development Framework (NSDF), introduced in 2018, guide urban growth, emphasising spatial justice, economic efficiency and environmental sustainability. In rural areas, the Comprehensive Rural Development Programme (CRDP), initiated in 2009, aims to improve living standards through infrastructure development, agricultural support, and sustainable livelihoods. Meanwhile, the Integrated Sustainable Rural Development Strategy (ISRDS), introduced in 2000, coordinates government efforts to enhance service delivery and infrastructure. The Spatial Planning and Land Use Management Act (SPLUMA), enacted in 2013, provides a uniform framework for spatial planning and land use management across the country.
Despite the numerous initiatives, significant challenges remain if the country is to achieve cohesive and inclusive development in both urban and rural areas.
Chart 5 presents GDP in market exchange rates (MER) and growth rate in the Current Path from 1990 to 2043.
South Africa is caught in a classic middle-income growth trap and, since 2007/8, has been growing more slowly than most upper-middle-income countries (UMICs) globally. The trap is the result of the skewed, two-legged structure of its economy, which features a small but skilled and highly productive private sector, a relatively small informal sector, and a large, poorly skilled and unproductive, economically inactive sector, with a substantial public sector situated somewhere between these extremes. South Africa’s challenges are rooted in apartheid but have been worsened by the global financial crisis of 2007/8, the impact of poor (and bad) governance, widespread corruption to the extent that it bordered on the capture of the state by criminal elements, lack of electricity availability and the impacts of the COVID-19 pandemic. The pandemic was followed by two years of modest growth, but lagged afterwards.
Addressing the nation on 21 April 2020, President Cyril Ramaphosa sought to turn the COVID-19 crisis into an opportunity, promising ‘not merely to return our economy to where it was before the coronavirus, but to forge a new economy in a new global reality.’ That, he argued, required a new social compact to accelerate the structural reforms needed to reduce the cost of doing business, promote localisation and industrialisation, overhaul state-owned enterprises and strengthen the informal sector. However, little has come of these promises, and the modest post-COVID recovery has not extended to the job market or the broader economy. The official unemployment rate increases yearly, and average incomes have not recovered to their pre-COVID-19 levels.
To understand why the country is growing so slowly and forecast how it will likely develop over the next 20 years, the subsequent analysis considers the standard sources of economic growth: the contributions of labour, capital, and multifactor productivity (known as MFP or technology). Labour productivity in South Africa has declined for several years and is below the average for other UMICs. Additionally, low capital per worker is a significant drag on economic growth. MFP is also lower than in comparable countries, and the drag that low human capital has on growth is discussed in the Demographics and Health section below.
In the Current Path, South Africa’s growth rate slowly improves to 2.8% per annum in 2043; however, the average rate from 2024 to 2043 is a modest 2.4%, which is comparable to the average for African UMICs but below the global average for UMICs, at 3.7%. Yet, even at this modest rate, the size of South Africa’s economy (at MER) will increase by 60% from US$392.1 billion in 2023 to US$628.3 billion in 2043.
Chart 6 presents the size of the informal economy as a percentage of GDP and percentage of total labour (non-agriculture), from 2020 to 2043.
Although data on South Africa’s informal sector differ between sources, it is apparent that the country has a small informal sector (at 13% of GDP) compared to Namibia (17%) and Botswana (19%), two upper-middle-income countries that share similarly high levels of inequality. The South African informal economy is also smaller as a percentage of GDP than the global average for UMIC countries.
Only around 18% of South Africa’s labour force was employed in the informal sector in 2023, around five percentage points below the average for UMICs in Africa and three percentage points below UMICs globally.
South Africa’s informal sector is expected to decline slightly to 12% of GDP in 2043, although its absolute size is projected to increase from US$49 billion to US$75 billion. The relatively small size of its informal economy and the limited number of informal workers contribute to inequality, extreme poverty, and high levels of unemployment, as work in the informal sector is included in the associated definition of employment as applied by the International Labour Organisation (ILO).
South Africa's rates of entrepreneurship and self-employment are alarmingly low. Many of the country’s working-age population are not economically active, highlighting the urgent need for more entrepreneurial opportunities and a shift in the labour market dynamics.
South Africa’s rigid labour market exacerbates its structural unemployment, in addition to measures such as constraints on skilled inward employment and an absence of large-scale programs that provide low-skilled entrepreneurs with business skills. Instead, the government has rolled out an extensive social grants program and sought to grow employment in the public sector. The extent of South Africa's unemployment challenge is alarming. In 2023, the ILO found that South Africa had the highest unemployment rate globally, after only Eswatini, in part reflecting the country's small informal sector. According to Statistics SA, in mid-2024, 12.4 million South Africans did not work, and the unemployment rate was 42.6%. Around 740 000 South Africans enter the labour market each year, and given slow growth and a capital-intensive economy, the number of unemployed people increases annually.
Chart 7 presents GDP per capita in the Current Path, from 1990 to 2043, compared with the average for the global upper-middle-income group.
South Africa’s GDP per capita peaked in 1981 and declined after that as apartheid and global isolation took their toll. The economy started to recover after the historic political transition in 1994, and from 1999 to 2008, the GDP per capita grew rapidly. Growth slowed after the 2007/8 global financial crisis and plateaued during the administration of Jacob Zuma from 2009 to early 2018. In 1990, with the end of apartheid, South Africa’s GDP per capita was US$4 138 above the average for upper-middle-income (UMICs) countries globally. By 2023, it was US$5 614 below. In the Current Path, it will further drop by 2043 to around US$13 480 below the UMIC average. In 2023, South Africa’s GDP per capita was US$12 580 and is expected to grow only modestly to US$14 750 by 2043. Compared to the average for UMICs, South Africa has been stagnating. Years of steady deindustrialisation, weak investment, a growing social-grant-dependent population and lack of adequate investment in critical areas such as education have undermined South Africa’s growth, particularly during the ruinous administration of President Zuma.
This starkly contrasts with countries like South Korea and Taiwan, which historically had lower GDP per capita figures than South Africa but have since surpassed the country’s per capita income.
South Africa’s historical inequalities, high unemployment rates and social disparities have been exacerbated by the country’s low savings rate since it limits the financial resilience of individuals and reduces the availability of domestic capital for investment. These factors contribute to sustained poverty, as economic opportunities are constrained, and social and economic mobility is limited.
Chart 8 presents the rate and number of poor people in the Current Path from 2020 to 2043.
In 2022, the World Bank updated its poverty lines to 2017 constant dollar values, now using US$2.15 per person for extreme poverty and US$6.85 as the poverty line for upper-middle-income countries (UMICs) such as South Africa.
Monetary poverty only tells part of the story, however. In addition, the global Multidimensional Poverty Index (MPI) measures each person’s overlapping deprivations across ten indicators in three equally weighted dimensions: health, education and standard of living. The MPI complements the international US$2.15 a day extreme poverty rate by identifying who is multidimensionally poor and also shows the composition of multidimensional poverty. The UNDP estimates MPI for South Africa at 6.3% in 2021, with an additional 12.2% classified as vulnerable to multidimensional poverty.
Using the extreme poverty line of US$2.15 per day, 21% or 13.3 million South Africans lived in extreme poverty in 2023, declining slightly to 18% or 13.6 million people in 2043. At the US$6.85 income level, the portion of people living in poverty in South Africa was 62% (equivalent to 39.6 million) in 2023. Although the rate will modestly decline to 58% in 2043, the number of poor people will increase to 44.4 million in 2043. These numbers are more than double the average for UMICs globally. Among the eight UMICs in Africa, only Namibia has higher rates of monetary poverty than South Africa.
On its current development trajectory, South Africa will struggle to reduce poverty because of its extraordinarily high levels of inequality and unemployment, its relatively modest economic growth forecasts and its relatively small informal sector. Since its first democratic elections in 1994, economic growth has consistently been too low to create jobs for the flood of annual new entrants to South Africa’s labour market and those previously unemployed. Thus, poverty in South Africa is widespread, and inequality is amongst the highest in the world. According to the Global Inequality Update 2024, published by the World Inequality Lab, the top 10% of South Africans capture more than 85% of the country's wealth. In contrast, the bottom 50% of the population has never captured more than 5% to 10% of South Africa's national income.
Social grants from the government already support around a third (28 million) of South Africans. They play an important role in constraining poverty and inequality growth.
Chart 9 depicts the National Development Plan of South Africa.
Ahead of South Africa's first democratic elections in 1994, the African National Congress (ANC) and its allies released the Reconstruction and Development Plan (RDP), followed shortly thereafter by the 1996 Growth, Employment, and Redistribution (GEAR) plan. In 2006, GEAR was replaced with the Accelerated and Shared Growth Initiative for South Africa (AsgiSA) to reduce poverty and unemployment more rapidly. GEAR and AsGISA departed markedly from the RDP, shifting government policies decidedly into a pro-market direction, and would provide fertile ground for an internal campaign within the ANC and its alliance partners that would lead to President Thabo Mbeki's resignation as president in 2008 and after a brief presidency by Kgalema Motlanthe, Jacob Zuma became president after the 2009 elections. Zuma resigned in February 2018, shortly after Cyril Ramaphosa was elected as president of the ANC.
Following the global financial crisis, the Zuma government formulated and released three successive economic strategies: the New Growth Path (NGP), the Department of Trade and Industry's Industrial Policy Action Plan, and, in 2012, the National Development Plan (NDP). President Zuma also announced a Nine-Point Plan at the 2015 State of the Nation speech.
Twenty-five part-time commissioners to the National Planning Commission worked on the NDP, and nominally it remains the official long-term development plan, although the ten-year review of the NDP, released in September 2023, found that its vision of a future South Africa has yet to materialise.
At the heart of our current developmental impasse has been a failure to keep the NDP in focus and at the centre of our developmental trajectory as a country. Instead of keeping the long-term plan in view and using it to inform planning and implementation across government, the NDP was paid little more than lip service, reinforcing incoherent planning and poor implementation.
In President Ramaphosa’s 2019 Budget Speech, he identified the pattern of operating in silos that has led to a lack of coherence in planning and implementation and made monitoring and oversight of the government’s program difficult. To respond to these challenges, he announced the District Development Model, consisting of a process by which joint and collaborative planning was to be undertaken at local, district and metropolitan levels to enable the three spheres of government to work together, with communities and stakeholders, to plan, budget and implement in unison.
Frustration about slow progress was also evident when the National Treasury released its 2019 paper, Economic Transformation, Inclusive Growth, and Competitiveness: Towards an Economic Strategy for South Africa, which identified six structural reform areas, the estimated impact of which would be to increase GDP by 2–3 percentage points over ten years. These include improving industrial and trade policy implementation, export competitiveness and ‘harnessing regional growth opportunities.’ The South Africa Economic Recovery and Reconstruction Plan (EERP), released in 2020, emphasised new investments, new industries and new tradable products as the country transitioned to low-carbon energy and includes ‘re-orienting trade policies and pursuing greater regional integration to boost exports, employment and innovation’ as one of its critical structural reforms. It was followed, in October 2020, with the announcement of Operation Vulindlela as a joint initiative with National Treasury, with its focus on energy, logistics, water and telecommunications, as well as reforms to the visa system.
During the national elections in May 2024, support for the ANC, which had governed South Africa since 1994 with an absolute majority, plummeted. In July 2024, it and several other parties agreed to form a coalition government (calling it a Government of National Unity (GNU)) to share power and achieve common goals. Announcing the agreement, President Ramaphosa resolved to ‘dedicate the next five years to actions that will advance three strategic priorities: Firstly, to drive inclusive growth and job creation. Secondly, to reduce poverty and tackle the high cost of living. Thirdly, to build a capable, ethical and developmental state.’
The Technical page explains the eight sectoral scenarios and their relationship to the Current Path and the Combined scenario. Chart 10 summarises the approach.
Chart 11 presents the mortality distribution in the Current Path for 2023 and 2043.
The Demographics and Health scenario for South Africa includes interventions to reduce the infection rate for HIV, reduce AIDS death rates as percentage of HIV infection rate, reduce the incidence of cardiovascular disease as well as for diarrhoea, diabetes, malignant neoplasm, respiratory infections, child mortality from infectious disease, maternal mortality rates, and increase the provision of improved sanitation and safe water. It also reduces malnutrition, obesity, smoking by men, the stunting rate for children under five and injuries from vehicle accidents.
The high levels of severe and acute malnutrition combined with high levels of inequality, poor health and a high disease burden constitute a long-term driver of low human productivity. As a result, South Africa’s poor human capital endowment is the most significant drag on multifactor productivity, followed by social capital. In summary, the drag that human capital has on productivity in South Africa reflects low levels of government efficiency since the country’s expenditure on health (8.3% of GDP) is above the average for upper-middle-income countries (UMICs) globally, including those in Africa. Its spending on education, also a large contributor to human capital, is at 6.6% of GDP and similarly above the global average for UMICs (4.7%) but below the average for Africa’s UMICs (5.3% of GDP, including South Africa).
Compared to non-African UMICs, Africa’s eight UMICs have much younger populations and some, including Namibia and Botswana, have been severely affected by HIV/AIDS. South Africa had a 2023 median age of 29.1 years compared to a global average for UMICs at 36.9 years, and has the largest HIV epidemic globally. Communicable diseases typically dominate in younger populations, and, as a result, South Africa (and other UMICs in Africa) underwent their epidemiological transition, when deaths from non-communicable diseases exceeded those from infectious diseases, shortly before 1990, much later compared to other countries at similar levels of development. The transition was reversed shortly after that as a result of HIV/AIDS and its significant spike in deaths from infectious diseases until 2019, when effective treatment saw AIDS deaths decline to the extent that the country again went through its epidemiological transition. This unique pattern is also visible in neighbouring Botswana and Namibia. Had it not been for that, South Africa’s mortality rates would have followed international trends, meaning deaths from non-communicable diseases would rapidly outpace those from infectious diseases as the population ages and the disease burden shifts.
The effect of HIV/AIDS in South Africa is still significant several years after the disease peaked. Average life expectancy, for example, at over 64 years in 1990, plummeted to 52 years by 2005, and by 2023, had only modestly recovered to 66 years, while the average life expectancy for UMICs globally has increased from 68.6 years to 77.1 years in that time. Resistance to the roll-out of antiretroviral treatment from President Thabo Mbeki during his presidency between 1999 and 2006 would delay the effective roll-out for several years. Eventually, during his second term, popular pressure would see antiretroviral therapy scale up, and its subsequent free rollout would cause substantial health improvement.
Discoveries of cheap, long-lasting drugs to avoid infection and the available treatments for prevention and treatment provide a positive future. The most exciting is a twice-yearly injection with a potentially affordable drug, lenacapavir, that fully protects against HIV infection. For that reason, the interventions on AIDS mortality in the Demographics and Health scenario leads to a decline to 78 000 deaths in 2043, compared to 109 000 in the Current Path. In 2023, 137 000 deaths were due to AIDS.
Still, similar to many other UMICs, South Africa faces a double burden of disease with a steady rise in more expensive non-communicable diseases such as cardiovascular disease and malignant neoplasm in the presence of significant, long-standing infectious disease prevalence.
For many years, the government has sought to address the many challenges that are faced in the health sector by, for example, committing to the Sustainable Development Goals (2015) and Universal Health Care (2019), setting three main objectives for the health system (and its reform process): (i) to ensure equity in access to health services irrespective of ability to pay; (ii) the quality of health services should be good enough to improve the health of those receiving services; and that (iii) the cost of using healthcare services should not put people at risk of financial harm. The momentum has, however, stalled in recent years with a singular focus on developing a single health system financing model, the National Health Insurance (NHI).
Because of poverty and other factors, many South Africans generally do not pursue a healthy lifestyle. Despite being a food-producing nation, a significant portion of South Africa’s population struggles with malnutrition in various forms, including undernutrition (resulting in stunting and wasting) and overnutrition (resulting in obesity). Males also smoke in larger portions than in other comparable countries. Sixty-eight per cent of women of reproductive age are overweight or obese, and 31% of men. The high prevalence of non-communicable diseases, such as diabetes mellitus, coronary heart disease and hypertension, is all linked to obesity, which is among the top 10 causes of death in South Africa. The problem is particularly severe among mothers and children. Thus, 21% of children under five are stunted.
Undernutrition increases the risk of infectious diseases. The 2018-2023 National Food and Nutrition Security Plan was developed to comprehensively respond to high malnutrition rates, but with disappointing results.
The Demographics and Health scenario models the impact of a comprehensive approach that emulates the impact of reforms that provide for competent management, administration and clinical oversight and governance; establishment of a national health information system; and steps to improve decision-making across the private and public sectors.
In 2023, infectious disease death rates per thousand people were 3.8, non-communicable death rates 4.3 and injuries 1.1. On the Current Path, the 2043 rates will be 2.5 from infectious disease deaths, six from non-communicable diseases and above 1.1 from injuries. In the Demographics and Health scenario, the rates will be lower by 17% and 8%, respectively. Deaths from injuries also decline, though modestly.
Chart 12 presents the infant mortality rate in the Current Path and the Demographics and Health scenario, from 2020 to 2043.
The infant mortality rate is the probability of a child born in a specific year dying before reaching the age of one. It measures the child-born survival rate and reflects the social, economic and environmental conditions in which children live, including their health care. It is calculated as the number of infant deaths per 1 000 live births and is an essential marker of the overall quality of the health system in a country.
In 2023, infant deaths per 1 000 live births in South Africa were nearly three times the average of UMICs globally (31.3 vs 10.6), primarily due to HIV infections and a high burden of influenza-associated mortality rates. Between 7 000 and 12 000 seasonal influenza-related deaths are estimated to occur annually in South Africa, of which half are in the elderly and about 30% in HIV-infected people. And, while the average for upper-middle-income countries (UMICs) globally can expect a near halving of infant mortality rates by 2043 (to 6.6), the Current Path for South Africa in 2043 is still extraordinarily high at 25.9 deaths per 1 000 live births. At that point, infant mortality rates in South Africa will even be above the rates for low- and lower-middle-income countries globally, mainly due to the lingering impact of HIV/AIDS.
In the Demographics and Health scenario, which includes aggressive interventions on reducing HIV/AIDS, South Africa’s rates of infant deaths per 1 000 live births will decline to 20.9 in 2043, a reduction of 19% compared to the Current Path.
South African expenditure on health has been constant at roughly 8% of GDP since 2012, slightly higher during the 2019-2020 COVID-19 pandemic. Compared with other UMICs, South Africa's expenditure on its health sector as a portion of government expenditure is high, but more is needed, given the burden of disease discussed previously. However, the country has a large and well-funded private healthcare system that serves around 27% of the population, paid through individual contributions to health insurance or medical insurance plans. The private healthcare system is sophisticated but characterised by over-servicing and inflated costs, while the public healthcare system, responsible for 71% of the population, has steadily deteriorated over time.
Evidence of the failures to address or strengthen stewardship, governance, leadership and management in the public sector is now overwhelming, with corruption and irregular expenditure endemic at all levels. According to senior medical experts writing in the South African Medical Journal in 2024, many parts of the public health system are now unable to deliver their assigned services, or an acceptable quality of care. As a result, the gap between the private and public healthcare systems is significant. For example, the amount spent on health care for each person with a medical aid scheme in South Africa is five times the amount spent on each person who relies entirely on public health facilities. The distribution of health professionals between the private and public sectors and urban and rural areas is also large.
In response, the government published a National Health Insurance (NHI) Green Paper, followed by NHI pilot projects in 2012. The NHI white paper in 2015 proposed the achievement of universal health coverage. The NHI is a centralised, national insurance fund from which the government will buy healthcare services from healthcare providers in both the public and private sectors. In May 2024, President Ramaphosa signed the NHI Bill, to be phased in by 2028. There is broad support for the plan, but concerns remain about various aspects, including the funding model, the extent of corruption and maladministration in the Department of Health and the implications for the private healthcare system.
In 2024, shortly after the elections that saw the formation of a Government of National Unity, a seven-member multidisciplinary panel of experts appointed by the Academy of Science of South Africa published its report that reflected on the widespread problems in the country’s public healthcare system, including a large number of managers in acting positions, frequent changes in senior leadership, worse health outcomes than similarly resourced countries, and overall deterioration of morale and trust. The panel recommended eight steps to address key governance issues:
- Define and communicate a clear public value mission and mandate for each level of the health service and each governance actor.
- Update legislation and governance structures to insulate them from vested interests and give them executive rather than merely advisory functions.
- Delegate authority appropriately to each level and within levels of the health system.
- Get the right people – ethical people with the appropriate competencies – into leadership and management positions within the health system.
- Surround managers and leaders with functional, fit-for-purpose systems so that they can do their work.
- Support managers at every level with the resources, understanding and ability to build teams and attend to the relationships that make complex systems work.
- Harness the authentic potential of community participation to ensure appropriate, respectful and responsive health services and monitor health service outcomes and processes.
- Act on dereliction of duty and acts of corruption and protect whistle-blowers.
The extent to which South Africa can feed, educate and create employment opportunities for its large working-age population is determined by its ability to improve its health.
Chart 13 presents the demographic dividend in the Current Path and the Demographics and Health scenario from 2020 to 2043.
The demographic dividend is the window of economic growth opportunity when the ratio of working-age persons to dependants increases from 1.7 to 1 and above.
South Africa entered a potential demographic window of opportunity around 2003 when the ratio of working-age persons (15 to 64 years of age) to dependants exceeded the ratio of 1.7. Still, the country has been unable to translate that dividend into more rapid economic growth and higher incomes. Only six other African countries are in this potentially fortunate position: the island states of Mauritius, Seychelles and Cape Verde, and three countries in North Africa (Morocco, Tunisia and Libya).
By 2023, the ratio had improved to 2:1. Still, the country had experienced a steady decline in GDP per capita for several years, given the impact of COVID-19, state capture, poor governance, poor health and an underperforming education system. Labour productivity in South Africa has been on a slow decline for over a decade. Still, there are prospects for improvements with the end of the COVID-19 crisis and expectations of improved government effectiveness and economic growth following the establishment of the Government of National Unity in 2024. South Africa’s working-age population ratio will peak at 2.2:1 in 2043, before declining. As health and education indices improve, they will reduce the considerable drag that poor human capital exerts on economic growth.
While labour's contribution to growth improves due to a healthier population, this also results in a larger elderly population (life expectancy in 2043 will be 73.7 years in the Demographics and Health scenario, instead of 70.4 in the Current Path, with female life expectancy 6.1 years above that of men).
In the Demographics and Health scenario, South Africa’s 2043 population will number 76.8 million people, around 164 000 fewer than in the 2043 Current Path. The scenario positively influences the working-age population by increasing this cohort to 69.2% compared to the Current Path’s 68.4% in 2043. A larger working-age population means South Africa’s GDP will be US$18.2 billion larger in 2043 than in the Current Path. GDP per capita will be US$310 higher.
Outside Africa, most upper-middle-income countries (UMICs) have passed their peak dividend and are already experiencing a declining ratio of working-age persons to dependants. With sufficient capital and technology, the larger pool of workers relative to dependants in Africa could accelerate rates of economic expansion.
Chart 14 shows crop production and demand in the Current Path from 1990 to 2043.
South Africa is among the few African countries achieving food security at the national level and is a net exporter of agricultural goods. Its varied climate supports one of the most diverse agrarian sectors globally, producing crops such as maize, citrus fruits, wine grapes, sugarcane, apples and pears. It also boasts a vibrant poultry and livestock industry.
The agricultural production and demand data in our analysis are initialised from data provided on food balances by the Food and Agriculture Organisation (FAO), which contains data on numerous agricultural types. However, in the model, the forecast is disaggregated into crops, meat and fish, presented in million metric tons.
The sector has been steadily increasing production over the past six decades, and export growth to other BRICS countries (Brazil, Russia, India and China) have been particularly impressive. However, 2023 proved difficult due to continued load-shedding (electricity outages), animal disease outbreaks and port congestion. Despite these setbacks, the industry demonstrates significant resilience compared to other economic sectors. These challenges include the disruptions caused by the COVID-19 pandemic and its associated lockdown regulations, the July 2021 unrest that severely impacted the food supply chain, and Russia's invasion of Ukraine, which led to increased costs of critical agricultural inputs and disrupted international trade flows of essential commodities such as fertiliser, wheat, sunflower and rice.
Agriculture in South Africa is a vital sector that plays a crucial role in the economy, food production, employment and poverty alleviation. It is the backbone of rural development, providing livelihoods for a significant portion of the population. During the budget vote in parliament in July 2024, the newly appointed agricultural minister noted that the sector contributes an average of 2.8% to the national economy (measured in GDP) and roughly 6% to total employment. Together with food production and processing, agriculture contributes up to 7% to GDP, driven primarily by citrus and maize exports. The country's status as the second-largest global exporter of citrus remains a critical factor in the agro-processing sector’s contribution to GDP. According to the BFAP 2024 baseline report, maize and soybean yields have also multiplied.
The success of South Africa’s agricultural sector is a result of an innovative private sector, which responds to local and international market demands. The industry includes large-scale commercial farms and agribusinesses utilising modern farming techniques and technologies to boost productivity. The backbone of the commercial sector consists of approximately 107 000 commercial farmers, although only a small percentage (some 6.5%) produce the bulk of agricultural output. Early in 2025, the Bureau for Food and Agricultural Policy (BFAP) released a comprehensive report on agriculture in South Africa for the period 1994 to 2024 that included the following summary of the sector:
… livestock production, traditionally the largest subsector in our semi-arid country, has shifted from extensive (beef and mutton/lamb on rangeland) to intensive (poultry, dairy, pigs) commodities as shifts in consumer preferences were followed by farmers. This has been enabled by the successes in the field crop subsector. Maize yields have been on their way to quadrupling since the early 1990s, and the country has become self-sufficient in soybeans to the benefit of intensive livestock production, while improvements in white maize production, the country’s staple crop, have benefited lower-income consumers. Finally, the horticulture subsector has shown the importance of access to irrigation water and infrastructure to output, but also to the stabilisation of output. South African producers of fresh produce benefit from our zero-tariff access to the UK and EU markets, from our counter-seasonal access to markets due to the fact that we are largely in the same time zones as our traditional markets. It is fair to say that fruit growers across the entire spectrum of fruit represent the most successful subsector in South African agriculture. This achievement has been supported by a rapidly growing tree nut sector, as well as a range of speciality berry crops.
In contrast, subsistence and smallholder farms—mainly located in areas under traditional authority—face challenges such as smaller plot sizes, inadequate infrastructure and poor access to critical inputs. Many farms acquired through the government’s land reform program are underperforming, with more than 50% of agricultural land classified as low to medium potential. Targeted support and infrastructure development are necessary to make these lands more productive.
The 2003 Comprehensive Agricultural Support Programme (CASP) intends to assist emerging farmers by providing resources and infrastructure to improve productivity.
South Africa's agricultural sector also suffers from rainfall variability, including droughts, severe flooding and water scarcity. The 2015/16 El Niño event, which caused the worst drought since 1904, significantly impacted maize and wheat production. Water scarcity, worsened by inadequate irrigation infrastructure and competing demands from different sectors, limits crop production, especially in regions with limited, reliable water sources. Soil degradation, driven by erosion, nutrient depletion and poor land management practices, contributes significantly to declining productivity. Moreover, insufficient investments in sustainable farming techniques and soil conservation efforts leave the sector ill-equipped to counter these challenges, leading to yield stagnation in the Current Path.
Despite production keeping pace with demand in past decades, South Africa risks becoming a net food importer in the coming years without further investments in infrastructure and agricultural yields. On the Current Path, crop demand will outstrip production beyond 2031, leading to a deterioration in food security. By 2043, South Africa will face a 15.7 million metric ton shortfall in its crop production compared to demand.
To counter these challenges, the Agriculture and Agro-Processing Master Plan (AAMP), adopted in 2022, seeks to enhance productivity, inclusivity and sustainability. By focusing on increasing yields, expanding production, improving infrastructure, and adopting sustainable practices, the plan aims to drive long-term growth and resilience in the agricultural and agro-processing industries. The Agricultural Policy Action Plan (APAP) complements these by focusing on value-chain development and smallholder support. The Comprehensive Agricultural Support Programme (CASP), initiated in 2003, also provides resources to help emerging farmers involved in land reform.
According to the Bureau for Food and Agriculture Policy (BFAP), irrigated maize yields in certain provinces, such as the Eastern Cape (dominated by large portions of land under communal tender), could reach up to 12.5 metric tons per hectare, a significant increase from current levels of 5.07 metric tons per hectare in commercial farming and 2.36 metric tons in subsistence farming. Other vital crops, such as wheat, soybeans and citrus, can increase production if infrastructure constraints, such as road access, reliable electricity and efficient irrigation systems, are addressed.
BFAP is optimistic in its medium-term outlook, noting that investments in improved irrigation systems, water management and new technologies can enable South Africa to maintain its net exporter status. In particular, the expansion of irrigated agriculture and the use of climate-resilient crops are essential for addressing the challenges posed by climate variability.
The subsequent Agriculture scenario mirrors these policies through ambitious yet feasible increases in yields per hectare, additional groundwater withdrawal, an aggressive rollout of irrigation systems, efforts to reduce food loss and waste, and the expansion of rural access roads. South Africa could significantly boost its agricultural productivity by investing in these areas. The country can also increase land under cultivation by using available state-owned land and conducting tenure reform in the former homeland areas.
By addressing these challenges and investing in critical areas such as irrigation and soil management, South Africa’s agricultural sector could increase average yields to 7.2 metric tons per hectare by 2043 (compared to 5.5 on the Current Path), enabling total crop production to rise in the scenario to 92.2 million metric tons instead of 70.2. The increase would secure South Africa’s food supply and allow for increased export earnings, reinforcing the country's role as a critical player in the SADC region’s food security.
Chart 15 presents the import dependence in the Current Path and the Agriculture scenario, from 2020 to 2043.
South Africa remains one of the few food-secure African countries, contributing significantly to the region's food supply. However, future projections are less optimistic. The Current Path is that South Africa’s reliance on agricultural imports (crop, meat and fish) will grow to 17% of its domestic demand by 2043, indicating increased vulnerability to global market fluctuations.
The Agriculture scenario presents a much more hopeful trajectory with South Africa producing a surplus equivalent to 3.4% of its demand by 2043. It illustrates that South Africa could maintain its status as a net exporter with targeted interventions. In the scenario, total agricultural exports will increase to 22 million metric tons, equivalent to US$5.2 billion, compared to the 8.1 million metric tons (valued at US$2.4 billion) in the Current Path for 2043. Additionally, imports will decrease to US$5.2 billion, compared to US$6.4 billion in the Current Path.
The proposed interventions would also roughly maintain the agricultural sector’s value-added contribution to GDP, which is 2.3% in 2023, in contrast to the reduction to 1.7% by 2043 on the Current Path. The scenario illustrates the benefits that flow from strategic investments in agriculture to safeguard food security, bolster economic growth and reinforce South Africa's role as a critical food supplier in the region.
Chart 16 depicts the progress through the educational system for primary gross enrolment, primary completion, lower-secondary gross enrolment, lower-secondary completion, upper-secondary enrolment, upper-secondary completion, tertiary enrolment, and tertiary completion in the Current Path (for 2023 and 2043). The numbers reflect the percentage of of-age children that attend.
With the advent of democracy, South Africa's education system undertook the enormous task of redressing the legacy of apartheid, particularly the chronic underfunding of black learners. While post-apartheid South Africa has made notable strides in access to education, with gross enrolment rates in primary and secondary levels exceeding 100%, the quality and completion rates remain concerning, particularly at the upper-secondary and tertiary levels. Policy incoherence, poor management and corruption, aggressive teacher unionisation, an insufficient focus on technical and vocational education at secondary and tertiary levels, and neglect of early childhood development, all stymied progress. These matters are now attracting more government attention.
A 2016 comprehensive report from the University of Stellenbosch found that around 60% of South African children could not read for meaning by the end of Grade 3, and identified four binding constraints to improving educational outcomes, particularly for learners from low-income backgrounds:
- Weak Institutional Functionality - most pronounced at the provincial level, where ineffective governance and administration impede the implementation of national policies.
- Undue Union Influence - contributed to resistance against performance evaluations and accountability measures for teachers.
- Inadequate Teacher Knowledge and Skills, with many teachers lacking the required content knowledge and pedagogical skills to deliver quality literacy and numeracy education.
- Wasted Learning Time: Inefficient use of school hours and limited learning opportunities.
The COVID-19 pandemic compounded these issues, with school closures and rotational timetables exacerbating educational inequalities, particularly in poorer communities. A subsequent 2021 study painted a bleak picture, finding that 81% of Grade 4 learners in South Africa could not read for meaning in any language and suggested that learning losses due to the pandemic set reading outcomes back a decade.
South Africa’s education budget does not appear to be insufficient. In 2023, South Africa's government allocated 6.6% of its GDP to education, almost two percentage points higher than the average for upper-middle-income countries (UMICs) globally and higher than the average for UMICs in Africa. With a spending commitment equivalent to some high-performing Scandinavian countries, South Africa does worse than Kenya or Tanzania, which have GDP per capita of less than one-fifth of South Africa’s. Instead, poor management, corruption and lack of prioritisation are endemic. While throughput along the education funnel is high, the problems are overwhelmingly related to poor quality.
In recent years, there has been some progress towards addressing these challenges. The South African education system is gradually shifting towards greater coherence, with an increased focus on technical and vocational training to prepare students for the demands of the Fourth Industrial Revolution. The 2013 White Paper for Post-School Education and Training and the subsequent National Plan for Post-School Education and Training 2021-2030 envisioned a significant increase in enrolment at Technical and Vocational Education and Training (TVET) and Community Education and Training colleges. The goal is for these institutions to enrol over two-thirds of all post-school education students, thus expanding opportunities for practical, skills-based learning. Yet, in mid-2024, 16 648 out of the 22 511 public schools had no libraries, 18 551 had no laboratories, and 14 839 had no computer centres, according to a report by the Department of Basic Education titled: Education Facility Management System.
Despite its substantial budgetary allocation, the South African education system grapples with significant challenges rooted in its historical context and current systemic inefficiencies. South Africa is the most critical learning underperformer relative to GDP per capita among low- and middle-income countries.
In addition to practical matters relating to overcrowding, lack of basic facilities and teacher shortages, recommendations relating to improved education include the need for policy coherence across the various departments and levels of government (the most significant problems appear to lie at the provincial level), better management and aggressive efforts to eliminate corruption in the education sector, create a culture reflecting lifelong learning for teachers, as well as find a balance between teacher unionisation, parent involvement and government line responsibility.
The Education scenario addresses some of these shortcomings through ambitious yet attainable improvements in the South African education system, including higher intake, transition and graduation rates from primary to tertiary levels. It also emphasises gender parity, additional vocational training at the secondary level, and an increase in the share of science and engineering graduates. Perhaps most importantly, the scenario includes interventions to improve the quality of primary and secondary education.
Between 2023 and 2043, primary and lower-secondary completion rates will improve significantly. Whereas, the Current Path is that 68% of of-age children will finish upper-secondary education in 2043, the number improves to 83% in the Education scenario. Instead of 17.2% of the of-age group graduating at tertiary level, the rate will be 23.3% in 2043.
Chart 16 highlights a positive trajectory in improving throughput. However, improvements in teaching quality, learning resources and institutional management remain elusive, as do the broader objectives of equity and economic competitiveness.
If successfully implemented, this scenario could significantly boost net enrolment rates for secondary and tertiary education, improve primary and secondary test scores, and improve quality, leading to better educational outcomes.
Chart 17 presents the mean years of education in the Current Path and the Education scenario for the 15- to 24-year-old age group from 2020 to 2043.
The average years of education among the adult population aged 15 to 24 years is a useful indicator of how the stock of knowledge in society is evolving. In South Africa, this cohort's mean years of education reached 10.3 in 2023, improving to 10.7 years in the Education scenario in 2043, compared to 10.4 years in the Current Path. These numbers are significantly higher than the 7.3-year average for Africa in 2023. The scenario includes an ambitious intervention to close the gender gap (females do better than males). In 2023, the gap was almost 1.2 years.
The establishment of the Government of National Unity (GNU) in July 2024 included new leadership in the Department of Basic Education and the promise of reform. The government's priorities now include creating safer and better schools, addressing critical issues such as infrastructure and educational quality, and making foundational changes that could influence long-term educational outcomes. These reforms are essential, as educational outcomes evolve slowly, requiring consistent investment and policy innovation.
In the Education scenario, education expenditures will account for 4.6% of GDP in 2043, compared to 4.3% on the Current Path. In this context, the increase in mean years of education reflects the impact of the government's renewed focus on educational reform, placing South Africa slightly above the average for its income peers.
Chart 18 presents the value-add by sector, for 2023 and 2043, in the Current Path compared to the Manufacturing scenario.
South Africa is often considered Africa’s most industrialised country, but Nigeria and Egypt both have larger manufacturing sectors. As a contribution to GDP, South Africa only ranks 25th in Africa, having steadily deindustrialised since the 1980s.
The foundation of South Africa’s industrial base followed the discovery of diamonds (1867) and gold (1886). The country’s growing mining sector needed tools, machinery, chemicals and food, sparking the growth of supporting industries, including steel, railways, energy and transport. After the First and Second World Wars, the country promoted import substitution. It established various state-owned enterprises that flourished behind protective tariffs and through subsidies, as the economic isolation due to apartheid led to a focus on self-sufficiency. On the back of mining and vehicles, the contribution of South Africa’s manufacturing sector to GDP peaked at almost 25% in 1981, having steadily increased since independence in 1961. During this period, South Africa was under ever-more punitive international sanctions and, amongst others, developed a sophisticated domestic arms industry, developed a large oil-from-coal sector and pursued various import replacement policies. Import replacement has its limits, however, and isolated from the global financial market and the positive effects of technological transfers, the country was, by the 1980s, essentially bankrupt.
With the transition from apartheid in the 1990s, many changes occurred, including rapidly opening up South Africa’s economy and adversely affecting its hitherto protected industries. Subsequently, the country experienced significant deindustrialisation as the government removed the protection of the manufacturing sector. In addition to a more open economy and international competition, the flood of Chinese manufacturing goods into Africa undercut South African manufacturing exports in its natural hinterland. Various domestic policy measures intended to correct domestic economic imbalances, particularly stringent measures to effect black economic empowerment and associated requirements on ownership and shareholding, effectively discouraged foreign investment.
Several documents currently frame South Africa’s industrial policies, including the National Industrial Policy Framework (NIPF) and Industrial Policy Action Plan (IPAP). The country has a history of using industrial policy to deploy trade instruments, incentives, tools and regulations, but to limited effect. In recent years, the Department of Trade, Industry, and Competition has embarked on partnerships, developing a master plan for each of eight sectors, covering automotive, clothing, steel, and poultry, to support localisation, increased investment, exports, and job retention. For example, the first Motor Industry Development Plan, launched in 1995, seeks to transform the vehicle manufacturing industry from a domestic producer to an export-oriented manufacturing powerhouse. South Africa's automotive industry plays an important role in its economy, accounting for nearly 19% of its manufacturing output. The South African Automotive Masterplan (SAAM) sets an ambitious target of producing 1.4 million vehicles annually by 2035, aiming for 1% of global production. However, instead of improving South Africa's competitiveness, during its first term the Ramaphosa government adopted a protectionist approach with preferential procurement arrangements and tariffs/duties on imports. Writing for Daily Maverick in January 2025, Ray Mahlaka summarises the challenge:
Manufacturing in South Africa requires a new approach to policymaking. Good industrial policy is needed, which will involve incentives from the government for research, design and innovation, lowering energy and transport costs, creating pathways for investing in education and job training for a 21st-century economy, promoting access to cheaper capital for manufacturers to scale up, and helping manufacturers to sell their goods to other countries.’
The Manufacturing scenario emulates reasonable but ambitious growth in the sector through increased investment as part of a coherent and unified national framework for reindustrialisation and more expenditure on research and development (R&D). The scenario also includes an increase in female and male labour participation rates, reflecting growth in employment as part of a deliberate strategy to grow light manufacturing, and efforts to crowd in larger portions of the informal sector into the formal sector.
In the Manufacturing scenario, the sector's contribution to GDP increases from 11.6% in 2023 (US$46 billion) to 18.8%, equivalent to US$129.1 billion in 2043, compared to 13% (US$81.7 billion) in the Current Path. The country intends to leverage its export footprint through the African Continental Free Trade Area (AfCFTA), with the BRICS+ block and through the SADC Economic Partnership Agreement (EPA) with the EU, to support new energy vehicle production and green industrialisation.
Chart 19 presents the contribution of the manufacturing sector to GDP in the Current Path and in the Manufacturing scenario, from 2020 to 2043. The data is in US$ and % of GDP.
With the exhaustion of its gold mining industry, which peaked in 1970, most attention has shifted to vehicle manufacturing, which benefits from a mix of strategic government policies, incentives, infrastructure investment and public-private partnerships aimed at boosting local production, exports and employment. The South African Automotive Industry Masterplan (SAAM35), tabled in 2018, provides a roadmap to 2035 for the industry and focuses on building African markets as well as diversifying into electric vehicles. The plan has ambitious targets, including growing the industry by 60%, increasing local content and significantly increasing employment. In line with global shifts towards sustainable transportation, South Africa is now allocating funds to support the local production of new energy vehicles (the Electric Vehicles White Paper of 2023) and related manufacturing projects to position the country as a competitive player in the evolving automotive industry.
South Africa has also established Special Economic Zones (SEZs) like the Coega SEZ in the Eastern Cape. These zones offer tailored infrastructure and incentives for various industries, including manufacturing, providing a conducive environment for business growth and employment creation. Trade and investment partnerships such as with the European Union, are also important.
In addition to a revitalised mining sector and ongoing support to its vehicle manufacturing sector, repairing and rebuilding South Africa’s existing water, electricity and sewerage infrastructure provides large opportunities for investment in intermediate industrialisation. For example, the ESKOM Transition Development Plan 2022-2031 indicates that the total capital expenditure for transmission amounts to approximately R188 billion, of which R144 billion is for capacity expansion and R34 billion is for capital expenditure. With the demand for repairing and expanding other parts of basic infrastructure, electricity transmission offers a massive opportunity for industrialisation. Concurrent with investments in manufacturing, the country would need to reduce the carbon intensity of its products lest it fall victim to the EU’s Carbon Border Adjustment Mechanism (CBAM) that will impose tariffs on imports based on their carbon content.
The Manufacturing scenario increases the size of the country's economy by 9.3% in 2043 (to US$687 billion, instead of US$628 billion in the Current Path).
Chart 20 depicts exports and imports as a percentage of GDP from 2000 to 2043 in the Current Path and the AfCFTA scenario.
South Africa is a founding member of the African Continental Free Trade Area (AfCFTA), established in 2018 and came into legal force the following year, although it has only been operational since April 2024. Under the agreement, AfCFTA members are committed to eliminating tariffs on most goods and services over a period of 5, 10 or 13 years, depending on the country's level of development or the nature of the products. Its long-term objectives include creating a single, liberalised market, reducing barriers to capital and labour to facilitate investment, developing regional infrastructure, and establishing a continental customs union. The establishment of the Pan-African Payment and Settlement System (PAPSS) in 2022 allows payments among companies operating in Africa to be done in any local currency.
The AfCFTA scenario emulates the full implementation of the African Continental Free Trade Agreement by 2034, as regards tariff reductions per sector. Because the IFs forecasting model applies a pooled approach to trade, we use various proxies to then estimate increases in exports in manufacturing, agriculture, services, ICT and materials[2]. We use a multiplier on multifactor productivity growth to make up for the difference in benchmarking the results to the findings by the World Bank, which indicates that the full implementation of the AfCFTA could increase South Africa’s income by 3.8% relative to the Current Path by 2035.
Please visit the theme on AfCFTA for further conceptualisation and details on the scenario structure and interventions.
Since 1962, when the UN General Assembly took a first (non-binding) resolution condemning South Africa’s apartheid policies, calling for economic and other sanctions, the country was subject to various trade, arms, sports and financial sanctions, eventually placing significant pressure on the South African economy. Internal pressure mounted, culminating in a limited and eventually a national state of emergency in 1985. In 1977, the voluntary UN arms embargo became mandatory, and a voluntary international oil embargo followed in 1987. Meanwhile, the US and, eventually, the International Monetary Fund (IMF) were prohibited from providing loans to the country. By 1989, bipartisan support in the US favoured economic sanctions, and considerable momentum had built up in favour of disinvestment from South Africa. Large capital flight from the country contributed significantly to the unravelling of apartheid.
After the unbanning of Nelson Mandela and the ANC in 1990, the country had the option of increased participation in regional and global value chains to facilitate access to intermediate goods, attract foreign direct investment (FDI) given substantial international goodwill, and build the capabilities of local suppliers and, hence, promoted industrialisation and productivity growth. However, the absence of supportive conditions for competitiveness improvements meant that poor trade integration, rapid liberalisation and intense competition from China led to deindustrialisation and steadily locked South Africa into low-value production and exports. Compared to other upper-middle-income (UMIC) countries globally, South Africa is significantly more dependent on income from primary exports at around 10.6% of GDP.
South Africa’s post-apartheid trade and industrial policy has been cautious regarding trade agreements. Instead of an export orientation, recent years have seen an increased focus on localisation, thus increasing the incentive to produce for the protected domestic market over exploring new export opportunities. These policies have raised barriers for new entrants and lowered competition for incumbent firms, translating into reduced efficiencies in South Africa’s manufacturing sector and eventually reducing the country's ability to compete internationally. As a result, South Africa’s exports constitute only 29% of GDP in 2023, compared to 54% for Thailand, 63% for Malaysia, and 87% for Vietnam, and modestly above the average for Africa. Among Africa’s eight UMICs, only Algeria has a lower rate of exports as per cent of GDP.
South Africa’s declining trade competitiveness contrasts sharply with its value-added trading potential. The South African Reserve Bank highlights various reasons for the country’s disappointing trade performance, including ‘the structure of the country’s export basket (which remains dominated by commodity products), its dependence on a limited number of large but mature export markets, and the high cost and deteriorating competitiveness of the general business environment.’
The EU is South Africa’s largest trading partner, accounting for around 22% of total trade in 2021. Between 1 000 and 2 000 EU companies are active in South Africa, collectively holding almost half of the total foreign direct investment (FDI) into the country and supporting more than 500 000 jobs. The EU-South Africa strategic partnership has been in place since 2007, and the country is the only strategic partner in Africa with bilateral summit-level meetings held since 2008.
Broken down by individual countries, China, the United States, Germany, Japan and the United Kingdom were South Africa's top export destinations. China also leads as the largest source of imports, followed by Germany, the United States, India and Saudi Arabia.
Still, in its Atlas of Economic Complexity, the Growth Lab ranks South Africa as the 68th most complex and diversified export basket out of 133 studied. The South African economy is considered "modestly complex" by international standards and ranked one position below Egypt, the most complex in Africa. An increase in the complexity ranking reflects positively on national productivity and economic sophistication. The associated analysis by the Growth Lab does, however, indicate a decline in complexity compared to a decade prior, although South Africa is still slightly above expectations given its income levels. The analysis by the Growth Lab confirms the steady deindustrialisation that occurred since manufacturing value-add peaked at 25% of GDP in 1981.
South Africa’s top exports in 2022 were gold (US$22.7 bn), platinum (US$19.1 bn), coal briquettes (US$12.7 bn), cars (US$6.89 bn) and diamonds (US$6.22 bn), mainly exporting to China (US$23.4 bn), United States (US$10.9 bn), Germany (US$9.96 bn), India (US$9.14 bn) and Japan (US$8.85 bn). In 2022, South Africa was the world's biggest exporter of platinum (US$19.1 bn), manganese ore (US$2.96 bn), chromium ore (US$2.51 bn), precious metal ore (US$1.97 bn) and titanium ore (US$656 million). That year, top imports of South Africa were refined petroleum (US$17.1 bn), cars (US$4.62 bn), crude oil (US$4.34 bn), motor vehicles, parts and accessories (US$3.76 bn) and broadcasting equipment (US$3.12 bn), mainly importing from China (US$23.5 bn), Germany (US$9.67 bn), India (US$8.32 bn), United States (US$6.11 bn) and Saudi Arabia (US$4.5 bn).
South Africa has a natural advantage in trade with the region due to its comparably advanced infrastructure. The full implementation of the AfCFTA has the potential to boost its manufacturing trade with the region, such as in vehicles, and its role as a logistics and services hub in Southern Africa, increasingly recognised and pursued by the Department of Trade, Industry and Competition.
South Africa is already a member of the Southern African Customs Union (with Botswana, Lesotho and Eswatini) and the 16-member Southern African Development Community (SADC). SADC absorbs 87% of South Africa’s exports to Africa, much of which (around 64%) is manufactured goods. However, South Africa’s services exports have stagnated since 2005 and have declined in recent years, contrary to the global trend in most other middle-income countries.
SACU is the world’s oldest customs union, formerly established in 1910, and its members maintain a standard external tariff, share customs revenues, and coordinate policies and decision-making on a range of trade issues. SACU has various trade agreements with the United Kingdom, the European Union, the European Free Trade Association (EFTA), MERCOSUR, the United States and other countries. For its part, SADC is in the process of establishing a Free Trade Area. COMESA, EAC and SADC have also established a Tripartite Free Trade Area (TFTA) effective in July 2024, fully liberalising tariff lines and eliminating non-tariff barriers. It is currently coordinated on a rotational basis among the three RECs. However, progress with trade integration in SACU, SADC and the TFTA has been below expectations.
In 2016, South Africa joined the Economic Partnership Agreement (EPA) between the EU and the SADC EPA group (Botswana, Lesotho, Namibia, Mozambique and Eswatini), which expanded market access, especially in agriculture. South Africa also benefits from the African Growth and Opportunity Act (AGOA), a unilateral preferential agreement with the US that is to lapse in September 2025, and its future is uncertain given deteriorating relations between the two countries with the second presidency of Donald Trump in 2025.
The AfCFTA scenario increases total trade (imports plus exports) as a percentage of GDP from 57% in 2023 to 72% in 2043. On the Current Path, it would be 62%. The difference is equivalent to US$106.2 billion.
Implementing the Agreement will be particularly beneficial to South Africa, given its relatively high level of development and more substantial manufacturing sector compared to its regional peers. Even modest improvements in leveraging trade to drive growth would profoundly impact the South African economy. The AfCFTA should form part of a broader developmental program aimed at incentivising industrialisation and investment. Beyond addressing network inefficiencies, the government would also need to introduce targeted incentives to reduce South Africa’s high export concentration, which is currently dominated by a limited number of large firms. Policies should aim to promote small and medium-sized exporting enterprises, unlocking new opportunities for diversification and growth.
A recent paper by the South African Reserve Bank argues that the country ‘urgently needs to address the high costs of investment and trading across borders; review the impact of existing industrial, localisation and sector-specific policies on export behaviour; implement a comprehensive and well-targeted export promotion and export finance framework; and update its trade policy approach to negotiations across the continent and internationally.’
Chart 21 presents the trade balance in the Current Path and in the AfCFTA scenario, from 2020 to 2043 as a percentage of GDP.
South Africa is Africa’s largest trading nation by value when considering exports plus imports, estimated at US$223 billion in 2023 and equivalent to 57% of GDP. Nigeria and Egypt have the second- and third-highest trade by value in Africa, followed by Morocco and Algeria.
Higher exports associated with greater global and regional integration could bring substantial additional gains for South Africa, boosting growth and employment, particularly if accompanied by export diversification in both products and markets. It could also support the adoption of productivity-enhancing technology through imported intermediate goods, which have not yet widely penetrated South African markets. This could also enable increased scale economies and specialisation, leading to job creation, inclusive growth and poverty reduction. In the view of the World Bank, an outward orientation could help increase competition in South Africa’s domestic markets and it argues that international trade has contributed significantly to prosperity in many developing countries by supporting the development of new, higher-paying jobs and increasing the efficiency of firms, as well as by providing consumers with cheaper and better products.
The Bank further argues that traditional drivers of growth— household and government consumption—have been hampered by a depressed labour market and tighter fiscal policy, constraining the South African government's ability to boost aggregate domestic demand. The result is that the country has underperformed in terms of exports relative to its peers over the past two decades, including when compared to Brazil, Russia, India, China, Turkey, Thailand and Malaysia. Thus:
Total merchandise exports have stagnated in the years preceding the [COVID-19] pandemic with all major product groups except food products declining during the decade from 2010 to 2019. They have also continued to be dominated by minerals and agricultural products, while manufactured exports have become increasingly concentrated in resource-based products, with the exception of the automotive sector. Overall, after the 1990s, the growth of manufacturing exports has been insufficient to enable a manufacturing export-led growth path. The economic contraction during the global financial crisis, followed by a tepid economic growth, which coincided with the continuous decline in electricity supply, growing governance and policy uncertainties, and continued fierce import competition during the remainder of the decade and a half, contributed to the exit of firms and the hollowing-out of the productive base in manufacturing, including that of exporters
Chart 21 clearly illustrates how South Africa stands to benefit significantly from the implementation of the AfCFTA, particularly in terms of its trade balance. While both the AfCFTA and Current Path scenarios show a decline in trade balance in the early years, the AfCFTA scenario demonstrates a strong and sustained recovery from around 2032.
Under the AfCFTA scenario, South Africa’s trade balance not only returns to positive territory earlier but continues to improve steadily, reaching a projected surplus of over US$17 billion by 2043. In contrast, the Current Path reflects a much slower recovery, with the trade balance only modestly positive by 2043 at around US$1.3 billion. The divergence highlights the potential of the AfCFTA to support trade-led growth, reduce trade deficits and enhance South Africa’s integration into regional and eventually global value chains.
Chart 22 presents the Current Path of access to electricity for urban, rural and total population from 2000 to 2043.
The Large Infrastructure and Leapfrogging scenario simulates the impact of improvements in infrastructure investment, policy reforms and institutional capacity to overcome the bottlenecks in energy, water, transport and municipal services, thereby driving sustainable economic growth and development. The scenario includes improved rural and urban electricity access and accelerated fixed and mobile broadband connectivity. It incorporates general investments in significant infrastructure projects (“other infrastructure”) like rail, ports and airports. It reduces electricity transmission and distribution loss and lowers the cost of adding ICT connections. The scenario models a very rapid uptake and deployment of renewable energy in the form of wind and solar to compensate for the decommissioning of coal-fired electricity generation plants in line with South Africa’s commitment to the Paris goals.
Visit the themes on Large Infrastructure and Leapfrogging for a conceptualisation and the details on the scenario structure and interventions.
In July 2024, during the presentation of the 2024/5 departmental budget policy speech, the newly appointed Minister of Public Works and Infrastructure vowed to ‘unleash a wave of infrastructure investment … to turn the country into a construction site’ with the ambitious goal of increasing the ratio of gross fixed capital formation from 14% to 30% of GDP. The need is underscored by a report from S&P Global Market Intelligence, which called on the government to prioritise South Africa’s infrastructure bottlenecks in energy, ports, rail and water. The associated inefficiencies have led to significant delays and increased costs, particularly hampering smaller firms' ability to export. South Africa's geographic distance from significant trading markets has been further exacerbated by the inefficiencies of its ports, deteriorating rail infrastructure, and high road freight and pipeline transport costs.
In response to these challenges, the government, in collaboration with businesses and unions, formed the National Logistics Crisis Committee (NLCC) to improve the operational performance of industry supply chains, including freight rail and ports; implement reforms to modernise the freight transport system for efficiency and competitiveness; and enact necessary regulatory changes or exemptions to enable efficient procurement and adequate funding for network maintenance. The NLCC oversees the implementation of the Freight Logistics Roadmap, which includes a framework for private sector participation, a Freight Road to Rail Migration Plan and a Transnet Recovery Plan. Additionally, in 2023, the Cabinet approved a Rail Policy to guide the future of freight rail and urban commuter rail.
South Africa previously made significant progress in expanding electricity access, outpacing most other African nations except for those in North Africa. In 2023, 88% of South Africans had access to electricity, a rate that is projected to reach 92% in the Current Path in 2043. By contrast, Africa's average electricity access rate in 2023 was 58%, increasing to 75% by 2043. Notably, Chart 22 highlights the significant urban-rural electricity access gap. However, by 2043, this gap is projected to shrink to less than two percentage points, compared to the 41-percentage-point difference in Africa in 2023 which declines to 34 percentage points in 2043. The Large Infrastructure and Leapfrogging scenario envisions South Africa achieving 100% electricity access by 2043, compared to 92% on the Current Path, with remarkably rapid improvements in rural areas by deploying mini-grids and renewable energy solutions.
South Africa has a large energy sector compared to other countries at similar levels of development, pointing to energy inefficiencies. For example, in 2023, South Africa’s energy sector represented 8.6% of GDP, compared to a global average for upper-middle-income countries (UMICs) of 5.6%. As a result, South Africa has suffered from chronic electricity shortages (load-shedding) since 2007, caused by poor planning, corruption, and underinvestment in construction and maintenance leading to rampant illegal connections. The shortages eventually started to ease in 2024.
In January 2024, the Minister of Mineral Resources and Energy released a draft Integrated Resource Plan (IRP 2023) for public comment that updated the previous 2019 IRP. IRP 2023, as it was known, outlined a phased approach to nuclear energy, included exploiting local recoverable shale and inland and coastal gas reserves (based on recent discoveries) and importing gas from Mozambique and Namibia. It placed emphasis on the development and extention of the transmission grid, which is currently constrained in parts of the Eastern, Northern and Western Cape.
Subsequent work done by Standard Bank and Cresto Group that was published in October 2024, indicated that the projected energy production increases would only meet the 2024 demand requirement in 2040. Following these and other comments, in 15 October 2025, Cabinet approved a major update to the IRP 2023, now known as IRP 2025 promising a permanent end to loadshedding. IRP 2025 provides for a major investment (ZAR2.23 trillion) that would reduce coal's generation share from around 58% to approximately 27%, increase the envisioned contribution of gas and nuclear from 3% to16% by 2040, included a strong push on renewables (solar, wind) and emphasised the importance of storage technologies. Amongst others South Africa intends to revive its modular nuclear reactor programme and aims to reduce the price of electricity which have increased by 937% since 2007 compared to inflation which had increased by 155%.
In the meanwhile, in August 2024, President Ramaphosa signed the Electricity Regulation Amendment Act into law, enacting far-reaching reforms in the country’s electricity sector. The Act aims to boost investment in new generation capacity to secure energy supply, establish an independent transmission system company within five years to oversee the national grid and impose severe penalties for infrastructure damage and sabotage. To this end, a separate National Transmission Company of South Africa (NTCSA) is being established and the government recently published regulations for the procurement of independent transmission projects as the first step in a massive expansion of the grid, particularly in the Northern Cape.
With electricity outages now under control, South Africa’s next major challenge is water. As a water-scarce country, South Africa has faced crises like Cape Town’s "Day Zero" between 2015 and 2018, when the city came close to running out of water. Although the crisis was averted, the country continues to struggle with national water shortages due to delays in crucial infrastructure projects. For instance, the nine-year delay in starting the Second Phase of the Lesotho Highlands Water Project, which is vital for supplying more water to the Vaal River for Gauteng, means the demand-supply situation will remain tight until 2028. Similarly, the uMkhomazi Water Project for eThekwini and surrounding municipalities has faced significant delays.
Looking ahead, the National Water Resource Infrastructure Agency Bill, once enacted, will facilitate substantially more investment in national water resource infrastructure. However, the performance of municipal water and sanitation services has sharply declined in recent years, mainly due to poor leadership at the municipal level. According to the Department of Water and Sanitation (DWS), 73% of the country’s 144 Water Services Authorities (WSAs) scored as critical or poor according to the 2023 Blue, Green, and No-drop assessment reports, increasing the risk of waterborne diseases, including cholera. Additionally, the national average for municipal non-revenue water, water “lost” before reaching customers, increased from 37% in 2014 to 47% in 2023. Municipalities with high levels of non-revenue water cannot pay water boards for treated water. They cannot afford to properly maintain and operate their water distribution infrastructure, often diverting funds intended for water services to other purposes.
To address the poor management and maintenance of water infrastructure, the Water Services Amendment Bill will provide the 134 municipalities that serve as water services authorities with additional powers. The Department of Water Affairs and Sanitation also intends to launch a large-scale water awareness campaign.
Many of South Africa’s infrastructure problems stem from the collapse of municipal management. In response, Phase 2 of Operation Vulindlela, a turnaround program managed by the Presidency, will prioritise fixing local government (along with spatial inequality and digital transformation) with assistance from the Development Bank of Southern Africa (DBSA), a significant lender to local governments.
South Africa has the largest network of paved roads in Africa, with high road density. However, a lack of maintenance in recent years has led to significant deterioration, particularly in the Free State province. Encouragingly, since 2024, national infrastructure investment programs — including renewed road repair initiatives — have begun to reverse this trend, supported by Operation Vulindlela Phase 2 and expanded SANRAL and local government cooperation.
Other elements of the transport sector, such as rail and ports, have also deteriorated, particularly during the COVID-19 pandemic. The decline in rail services has also resulted in a substantial shift of commuter and freight transport to roads, contributing to over 10 000 fatal crashes annually—an issue that the Road Traffic Management Corporation (RTMC) estimates costs almost 3% of the country’s GDP. Following the decline in public transport, particularly rail, the 2020 National Household Travel Survey found that taxis carry 83% of public transport users, which is associated with more significant wear and tear to roads and more traffic accidents. Efforts to reduce road deaths are guided by the National Road Safety Strategy (NRSS) 2016 -2030. The rail freight system has been plagued by long delays in moving critical bulk minerals, containers and vehicles, while port terminals and strategic border crossings suffer from congestion. South Africa’s ports, operated by state-owned Transnet, have been among the world’s worst-performing and least competitive. In 2023, Cape Town and Ngqura (in the Eastern Cape) ranked 405th and 404th globally, respectively. In mid-2024, an internal report revealed that coal shipments had plunged to a three-decade low due to inefficiencies at Transnet, which cited a lack of locomotives and spare parts, along with infrastructure faults and signalling system issues.
In addition to the parameters on electricity, energy and roads, the Large Infrastructure and Leapfrogging scenario also emulates the impact of a stream of infrastructure projects coming on line at municipal and state-owned enterprises such as Eskom, Transnet and the Airports Company South Africa, in line with the commitment from government to invest in infrastructure as optimism about the domestic economy gains momentum. Already, in 2024, investment in infrastructure increased including road repair, roll-out of internet, building of bridges, expansion of high-voltage power lines in the Western, Eastern and Northern Cape, amongst others. These improvements have far-reaching implications, extending beyond the energy sector. Enhanced infrastructure would also bolster other sectors, such as increased trade under the AfCFTA scenario and improvements in agricultural productivity. The systemic benefits of these infrastructure investments are further amplified in the Combined scenario, which captures the synergistic effects across multiple sectors.
The advancements that follow the implemention of the Large Infrastructure and Leapfrogging scenario translate into tangible economic benefits: South Africa’s GDP per capita in 2043 would be US$321 (or 2%) higher than the Current Path, and an additional 480 000 people would be lifted above the poverty line of US$6.85 per day. The scenario projects the South African economy to grow to US$649 billion by 2043, which is US$20 billion more than the Current Path. Strategic investment in energy production and related infrastructure will ensure long-term energy security, closing the demand-supply gap that would otherwise stifle economic growth.
The elements that constitute the Large Infrastructure and Leapfrogging scenario are discussed in the text that accompanies Chart 22. Under the Integrated Resource Plan (IRP), South Africa had scheduled the retirement of 11.3 GW of coal power capacity at seven plants by 2030. However, the country's ongoing energy crisis, characterised by frequent power outages, led to a decision to delay the decommissioning of several plants beyond their original retirement dates (Camden, Grootvlei, Hendrina, Arnot and Kriel power stations). In March 2025, the government also granted limited exemptions to several other coal-fired power plants, allowing them to operate under relaxed environmental standards until 2030 (Lethabo, Kendal, Tutuka, Majuba, Matimba and Medupi power stations). Additionally, Duvha and Matla power stations received exemptions valid until their planned decommissioning in 2034. As a result, South Africa will likely miss its binding 2030 carbon emissions targets under the Paris Agreement.
Chart 23 illustrates South Africa’s worsening energy security situation under its Current Path, showing that without intervention, energy demand will eventually exceed production, potentially leading to a return to power shortages, load shedding, and economic inefficiencies. Since South Africa exports large amounts of coal (which is included in the energy production depicted in Chart 23), the actual situation regarding the country’s energy insecurity is significantly worse. Accordingly, the Large Infrastructure and Leapfrogging scenario emulates the impact of various measures to close this gap, significantly increasing renewable energy production while also diversifying into gas and other renewable energy production. The result is a significant improvement in the country’s energy security, sufficient to accommodate more rapid economic growth.
Instead of 73% of energy production coming from coal in 2043, as projected in the Current Path, the scenario reduces this share to less than 42% and declining rapidly thereafter.
A major pillar of this transition is a large-scale expansion of solar and wind power. A Green Cape report published in April 2025 forecasts that 6 GW of new private solar PV and 3.5 GW of new private wind capacity will be installed by 2030. Investment in grid infrastructure is critical if this scenario is to be achieved, particularly in the Eastern, Northern and Western Cape, where transmission constraints otherwise would hinder deployment. The decentralisation of power generation through distributed solar PV installations and battery storage solutions will accelerate energy access, particularly in rural areas. To this end, the Cabinet approved the South African Renewable Energy Master Plan (SAREM) in March 2025 as a blueprint for green industrialisation and a pathway to a more sustainable and equitable future.
One of the most significant shifts in South Africa’s energy landscape is the increasing role of private-sector and residential solar PV installations. Johannesburg, Cape Town and Durban have introduced net-metering incentives, allowing households and businesses to sell excess solar power back to the grid, further accelerating adoption. The 2022 removal of the 100 MW generation capacity limit allowed businesses to develop large solar farms without requiring a license from the National Energy Regulator of South Africa (NERSA), which proved particularly impactful in unlocking solar energy growth. After the lifting of the generation capacity, the private sector has invested billions of rands in private solar farms. Mining companies such as Anglo American, Gold Fields and Sibanye-Stillwater have announced or commissioned large-scale on-site renewable energy projects to power their operations. Companies in the manufacturing sector, retail and commercial property developers, including shopping malls, have expanded their solar PV capacity, hedging against rising energy costs and price volatility. Municipal-level initiatives, such as the City of Cape Town’s 2023 initiative to buy excess solar power from private producers, are setting a precedent for decentralised energy generation and municipal energy security.
The regulatory shift demonstrates the investment potential of appropriate policies that enable industries and households to scale up renewable energy generation independently, while also reducing pressure on Eskom’s ageing coal fleet.
The scenario does not include additional nuclear energy as our modelling indicates that an aggressive roll-out of renewables could plug South Africa’s energy production gap, but our analysis did not explore the country’s baseload needs, which may force the government to pursue additional nuclear energy. The Large Infrastructure and Leapfrogging scenario, therefore, presents only one of many possible scenarios for transforming South Africa’s energy sector and ensuring sustainable economic growth and long-term prosperity.
South Africa has been considering additional nuclear energy capacity since 2006, with construction initially slated to commence in 2010, but after numerous false starts, in 2017 the Western Cape high court set the various agreements that had been signed with Russia, USA and South Korea aside on procedural grounds, forcing the government to start is processes afresh.
The IRP 2019 included a provision for 2 500 MW of new nuclear capacity to be added post-2030. This plan was reaffirmed in the draft IRP 2023, which maintains the 2 500 MW target, positioning nuclear power as a complementary source to renewables for ensuring grid stability and reliable electricity supply. A new IRP 2025 is currently nearing completion. In the meantime, in August 2024, the Ministerial Determination for the procurement was withdrawn to allow for further public consultation after legal challenges to the procedure.
Eventually, the emergence of Small Modular Nuclear Reactors (SMRs) presents a potential, flexible, scalable and cost-effective solution. South Africa was once a pioneer in SMR technology, having developed its own Pebble Bed Modular Reactor (PBMR). However, due to financial constraints, international pressure, technical hurdles and policy shifts, the PBMR project was halted in 2010 before reaching commercialisation. Today, there is renewed interest globally in SMRs. In the United States, advanced SMR designs by companies such as TerraPower, X-energy and Nuscale Power have achieved significant technical milestones, advancing through licensing and initial deployment phases. Although some projects have faced cost challenges, these developments demonstrate the technological maturity and potential of SMRs to deliver clean, reliable energy at scale.
South Africa’s government is now exploring options to revive aspects of the PBMR program as part of its long-term energy strategy. However, SMR technology still faces several challenges, including regulatory hurdles, political scepticism and high initial costs. Should these barriers be overcome, SMRs could revolutionise South Africa’s energy landscape, contributing meaningfully to long-term energy security and economic sustainability.
In anticipation of the IRP 2025, the Minister of Electricity appointed a panel of independent international experts to advise on the procurement of additional nuclear generation capacity at an affordable scale and pace. Two potential sites for the construction of new nuclear plants — Thyspunt near Jeffrey’s Bay and Duynefontein adjacent to Koeberg — have already been identified and pre-licensed.
In parallel, the government has approved the life extension of the Safari-1 research reactor at Pelindaba, which has been in operation since 1965, and initiated the development of a new multi-purpose reactor on the same site. This facility is intended to replace Safari-1 in supporting nuclear research, medical isotope production and industrial applications.
Chart 24 presents the percentage of the population and number of people with access to mobile and fixed broadband in the Current Path and in the Large Infrastructure and Leapfrogging scenario, from 2020 to 2043.
Over the past decade, South Africa's online presence has expanded significantly. In 2023, 66% of the population had access to the internet, a significant increase from the 10% recorded in 2009, although still short of the National Development Plan (NDP) pathway, which envisions a fully connected society by 2030. According to the Digital Quality of Life Index (DQL) 2023 (an index that ranks countries according to internet affordability, quality, e-infratructure, e-security and e-governance), South Africa ranked 1st out of 25 African countries surveyed and overall 72nd out of 121 countries globally.
With four fixed broadband subscribers per 100 people in 2023, South Africa slightly surpassed the African average of 3.3. The Current Path is for 25 subscriptions per 100 people in 2043, still above the average of 23 for Africa. In the Large Infrastructure and Leapfrogging scenario, fixed broadband subscriptions will increase to 29 per 100 in 2043. This increase, over the Current Path, will boost high-speed, reliable internet access across the nation and is particularly important for business and government. This expansion will assist in bridging the digital divide towards equitable access for all communities.
In parallel, mobile broadband has shown remarkable penetration, with subscriptions already high at 131 per 100 people in 2023. This figure will reach saturation rates of 164 subscriptions per 100 people by as early as 2029. Mobile broadband remains a pivotal element of South Africa’s connectivity strategy, providing essential links for many in remote areas and promoting widespread internet usage throughout the country.
Chart 25 presents the trends in FDI, aid, and remittances as a percentage of GDP in the Current Path from 1990 to 2043.
South Africa has historically been a significant source of outward remittances within the Southern Africa Development Community (SADC) region, especially during the 1970s and 1980s, when its mining sector heavily relied on migrant labour from neighbouring countries. This reliance drove high remittance outflows as workers returned money to their home countries. However, starting in the 1990s and continuing into the early 2000s, these outflows declined due to the downturn in the mining sector, broader economic challenges, a reduction in the demand for foreign labour and high remittance costs (making it expensive for migrant workers to transfer money home). This decline in remittances reached its lowest point between 2015 and 2019. South Africa has recently also received some inward remittances (although dwarfed by outflows) as skilled outward emigration grew.
Remittance outflows from South Africa have slightly increased again following the initial decline during the COVID-19 pandemic. This resurgence is partly due to the recovery in employment and economic activity, along with improvements in policies and financial mechanisms that have made sending money across borders more accessible and cost-effective. Additionally, renewed economic ties and continued migration are expected to drive further increases in remittance outflows in the coming decades. The Current Path suggests that with ongoing policy enhancements and technological advancements in the remittance sector, South Africa’s role as a key source of remittances within the region will continue to grow, providing critical financial support to neighbouring countries.
South Africa received little development aid owing to its status as an upper-middle-income economy, and it is unlikely that this trend will change. In 2023, the country received aid equivalent to 0.2% of GDP. In the Current Path, assistance to South Africa declines. While aid remains important for a number of health programs (such as for HIV/AIDS), it does not play a significant role in South Africa.
Traditionally, European countries such as the United Kingdom, Netherlands, Belgium, Germany, Luxembourg as well as the United States, Japan, China and Australia have been the largest foreign investors in South Africa. Most of their investments are in the financial, mining, manufacturing, transportation and retail sectors. In recent years, FDI flows from China have surpassed those of the United Kingdom, which historically held a dominant position as a significant investor in South Africa due to its strong historical ties. Investment from China is mainly in mining and infrastructure.
Declining investor confidence has dramatically impacted the South African economy, where actual gross fixed capital formation by the private sector is significantly below that of peer countries. Although it attracted more FDI after transitioning to democracy in 1994, inflows slowed after 2000 as evidence of poor management and corruption started to affect foreign interest..
The Ramaphosa government has been actively pursuing domestic and international investment as part of its broader economic recovery plan to stimulate economic growth. It hosted investment summits in 2018, 2019 and 2022 — against a target to raise US$100 billion in new investment over five years. These targets have fallen foul of COVID-19 and ongoing challenges in infrastructure, poor investment climate and instability, with large riots in KwaZulu-Natal and Gauteng in July 2021 that accompanied the brief incarceration of former president Jacob Zuma. Other policies include the Critical Infrastructure Program (CIP), an incentive scheme to bolster infrastructure investment, and the establishment of five Industrial Development Zones (IDZs) and six special economic zones (SEZs). The latter focuses on industrial development, and the IDZs offer duty-free import of production-related material and various other incentives.
Currently, South Africa attracts limited FDI, although more than 180 Fortune Global 500 companies are present in South Africa, and the country is globally more connected to the international financial system than any other African country. Accessing capital at a reasonable cost is indispensable for South Africa, a country with a low national savings rate. In 2023, South Africa received FDI inflows of roughly 1.8% of GDP, below the average for Africa’s eight UMICs. The average for UMICs globally in 2023 was 3.1%. Without unlocking sustained high levels of domestic and foreign investment, South Africa will not escape its recent history of a slow economic growth trajectory.
The Financial Flows scenario reduces outward financial flows to emulate a reduction in illicit financial outflows. It includes an aggressive intervention on increased inward flow of investment stocks and portfolio investment. The South African scenario does not include interventions on additional aid (owing to its income status) or changes to remittances.
Visit the theme on Financial Flows for our conceptualisation and details on the scenario structure and interventions.
In the Financial Flows scenario, FDI inflows to South Africa increase significantly to 4.7% of GDP in 2043 compared to 2.2% of GDP in 2043 on the Current Path. The impact of the Financial Flows scenario is to increase South Africa’s stock of FDI in 2043 to US$357 billion (53% of GDP) compared to the Current Path of US$203 billion (32% of GDP). The stock of FDI in South Africa was US$118 billion in 2023 (30% of GDP).
These elevated levels of FDI will require policy certainty, regulatory oversight, an improvement in South Africa’s credit rating, removal of its “grey listing” by the Financial Action Task Force related to money laundering and terrorist financing and a reduction in the regulatory burden and cost of doing business.
South Africa can expect substantial economic benefits if these levels of FDI can be achieved, including accelerated economic growth that could also lead to higher living standards. The impact of the Financial Flows scenario is an economy that is US$39 billion larger in 2043 and a positive increase in per capita income of US$610 in 2043 compared to the Current Path. Extreme poverty (using US$2.15) decreases marginally (by 120 000 persons) in 2043. While the direct poverty reduction impact is limited, the broader benefits of increased FDI include higher productivity and industrial expansion, strengthened local business supply chains and enhanced trade integration with global markets.
Chart 26 presents government revenue in the Current Path and the Financial Flows scenario, from 2020 to 2043. The data is in US$ and % of GDP.
Wagner's law, or the law of increasing state activity, is the observation that public expenditure increases as national income rises. It is reasonable to expect that government revenues will increase as a per cent of GDP in the Financial Flows scenario compared to the Current Path.
Measured as a percentage of GDP, government revenue in South Africa stood at 25.1% (equivalent to US$98.3 billion) in 2023. In the Current Path, government revenue will reach 29.4% (equivalent to US$184 billion) of GDP in 2043. In the Financial Flows scenario, however, government revenues will increase by 0.11 percentage points of GDP to US$196 billion (equivalent to 29.5% of GDP) in 2043, slightly below the average for upper-middle-income countries in Africa or UMICs globally. Increasing revenues will add additional capacity to the government. Much of the increase (US$12 billion) is due to the effect of more inward investment on growth.
By addressing policy barriers, strengthening governance and improving financial stability, South Africa can realise the full potential of foreign investment and accelerate economic growth. In doing so, the country secures its position as Africa’s leading financial hub, ensuring a more prosperous and globally competitive economy.
Chart 27 presents the Current Path of government effectiveness for South Africa from 2002 to 2043.
The Government Effectiveness Index, undertaken and published by the World Bank, represents the quality of public services, policy implementation, regulatory independence and credibility of government commitments.
South Africa’s governance challenges are well documented. Issues such as state capture, corruption, weak institutional capacity and regulatory inefficiencies have constrained economic growth, hindered public service delivery and eroded public trust. Governance effectiveness has steadily declined (see Chart 27) since the World Bank started to collate and release its index for the country in 1996, with the consequences reflected in rising fiscal pressures, high crime rates, infrastructure decline and sluggish investment growth.
The line graph shows the extent to which South Africa’s governance effectiveness declined, particularly during the presidency of Jacob Zuma. Under President Cyril Ramaphosa, efforts to improve government effectiveness gained some traction, but progress has been hampered by internal ANC political battles, COVID-19 disruptions and weak accountability mechanisms. Post-2021, political infighting, particularly at regional and metropolitan levels, has led to governance instability and inadequate oversight that has eroded public confidence in government.
Despite these challenges, South Africa remains one of the strongest governance effectiveness performers in Africa, also ranking above the average for upper-middle-income countries (UMICs) globally. However, it lags behind African peers such as Mauritius, Seychelles, Botswana and Rwanda on governance effectiveness, economic freedom and public sector efficiency. Mauritius consistently maintains the highest governance effectiveness scores, and projects continue to improve through 2043. Botswana, Namibia and South Africa share similar historical governance trends, but South Africa doing the worst amongst the three.
A 2023 Statistics South Africa report found that public trust in government was low, with the highest satisfaction rates among those utilising higher education services (90%), while the lowest satisfaction levels were reported in public housing services (61%).
Various other indices provide additional context to South Africa’s low and declining score on government effectiveness. For example, South Africa’s competitiveness stood at 61st spot (out of 64 countries surveyed) on the International Institute for Management Development (IMD) World Competitiveness Ranking. The country does poorly on matters relating to government adaptability, the lack of business dynamism and its rigid labour market, and suffers from onerous administrative burdens.
Recognising the governance crisis, the South African government has introduced several reform initiatives such as:
- Professionalisation of the public service as guided by the National Framework Towards the Professionalisation of the Public Sector, approved by Cabinet in 2022. The efforts at merit-based recruitment, reduced political interference and inefficiencies in government departments are, however, constrained by ANC policies on cadre deployment and racial quotas (discussed elsewhere), although, from 2023 onward, the government began enforcing mandatory minimum qualifications and competency assessments for senior management positions.
- Operation Vulindlela - a flagship initiative between the National Treasury and the Presidency that accelerates structural reforms to streamline business regulations, improve state-owned enterprise performance, reform local government, and accelerate public land release in electricity, water, transport, digital communications and visa and immigration systems.
- Public Procurement Act (2024): Signed into law but awaiting proclamation for implementation by the President. The legislation will standardise procurement processes, combat tender corruption, and increase transparency in government contracts.
- A May 2025 promise to review the 1998 White Paper on Local Government Local Government to address the manifold issues facing muncipalities including limited funding, lack of skills and transparency. A final draft is to be submitted to Cabinet in March 2026.
While these efforts signal a commitment to improving governance effectiveness, the lack of consequence management remains a major obstacle, as does the widespread practice of cadre deployment according to which officials at local, provincial and national level are appointed based on their political support of the ANC and not on merit.
Cadre deployment is, however, only one element in a determined effort to redress past inequities, most prominently under the rubric of Black Economic Empowerment (BEE), subsequently termed Broad-Based Black Economic Empowerment (B-BBEE). There is wide agreement in South Africa on the need for such efforts, but in time the B-BBEE requirements on ownership, management control, skills development, enterprise and supplier development and socio-economic development have become more intrusive to the extent that they serve as an effective deterrent on government effectiveness and foreign investment, the latter because it applies to any company operating in South Africa, including those with foreign ownership or control. The Employment Equity Amendment Act, signed into law in April 2023, comes on the back of previous legislation and aims to accelerate transformation in the workplace. The Act empowers the Minister of Employment and Labour to set sector-specific numerical targets for designated employers with more than 50 employees. In 2025, the Department published 18 sectoral targets including for agriculture, mining, manufacturing and finance, based on national and provincial demographics.
Without stronger accountability measures and enforcement, governance effectiveness is unlikely to recover to its 1996 levels. reforms—such as public sector professionalisation, economic liberalisation, anti-corruption measures and merit-based employment—can improve South Africa’s governance effectiveness, foster economic growth and rebuild public trust in institutions.
Chart 28 presents the composite governance index for the Current Path versus the Governance scenario, for 2023 and 2043.
The forecasting model includes a conceptualisation of governance as consisting of three dimensions: security, capacity and inclusion. Each dimension is represented by an index (0 to 1), where higher scores indicate stronger governance outcomes. The composite governance index averages these three indices to assess overall governance performance. In addition, the Governance scenario also includes an aggressive increase in welfare transfers to unskilled workers to reduce inequality and poverty. Visit the theme on Governance for a full conceptualisation and details on the composition of the scenario.
South Africa already has a progressive tax regime and has one of the largest social welfare transfers, including social grants and related support programs among emerging economies given its extraordinarly high rates of inequality and unemployment. The additional transfers to unskilled workers in the Governance scenario increases to US$12.55 billion by 2043. The transfers are funded by increases in household taxes on skilled labour.
Security remains one of South Africa’s most pressing governance challenges, largely due to high violent crime rates, a dysfunctional criminal justice system and weak law enforcement institutions. According to data from the Global Burden of Disease, South Africa consistently ranks among the ten countries internationally with the highest homicide death rates among adult men and women. Homicides serve as a useful proxy for broader violence patterns in a society and negatively impact social capital and translate into a drag on growth. In the 2023 Global Peace Index (a composite index drawing on a variety of measures), South Africa ranked 156 out of 163 countries.
The persistent lack of security acts as a major deterrent to investment in South Africa. In its 2023 report, Safety First: The Economic Cost of Crime in South Africa, the World Bank estimated that crime costs the economy at least 10% of GDP annually, in terms of stolen property, protection costs (encompassing security and insurance), and missed economic opportunities. High crime rates damage the economy, contribute to the misallocation and inefficient use of resources and undermine progress towards the country's development objectives. Numerous studies have been done which indicate that well-designed and implemented policies that target priority crimes, murder in particular, can yield positive results in the medium term, but little progress is being made. Improvements are possible within the current budget allocations to the criminal justice system, given appropriate leadership and prioritisation.
The Governance scenario improves South Africa’s score on the security index by 14% in 2043. Instead of performing the worst amongst Africa’s UMICs, South Africa will do better than neighbouring Namibia. It reflects the impact of determined governance action, such as enhanced law enforcement capacity, data-driven policing, targeted crime reduction strategies and tackling organised crime, which has thrived on the declining capacity of the policy and justice institutions.
Better governance capacity follows from improvements in government regulatory quality, reduced corruption, increased economic freedom and higher government effectiveness.
For example, the 2023 edition of the Transparency International Corruption Perception Index ranks South Africa 12th least corrupt in Africa, and 72nd out of 180 globally. This is following five years of decline, placing it now comparable to Benin, Bulgaria, Ghana and Senegal, and significantly below neighbouring Botswana and Namibia.
South Africa does relatively well when compared to other countries in terms of economic freedom. Its score is similar to that of neighbouring Namibia and Botswana, which is high compared to most African countries and above most comparable UMICs globally. The Fraser Institute Index of Economic Freedom ranks South Africa at 94th globally, doing poorly on the size of its government and freedom to trade internationally but well on its legal system and protection of property rights. According to the Institute, economic freedom exists when property is acquired by individuals without force, fraud or theft and is protected from physical invasions by others. In this framing, individuals are free to use, exchange or give their property as long as their actions do not violate the identical rights of others.
The government revenue-to-GDP ratio is a good indicator of government capacity. At 25% in 2023, South Africa’s ratio was comparable to the average of upper-middle-income countries (UMICs) globally, but public service delivery is constrained by policy inconsistencies, inefficiencies in state-owned enterprises (SOEs) and endemic corruption.
The country has an advanced and formalised revenue collection system, meaning that South Africa’s tax-to-GDP is amongst the highest in Africa but service delivery has deteriorated, particularly in energy supply (Eskom), water management and local governance. As a result, South Africa’s government capacity is below that of Namibia, Botswana, Algeria, Libya and Mauritius, though it outperforms Gabon and Equatorial Guinea. The State Capture Commission (Zondo Commission) which concluded in 2022, extensively documented the extent of state capture under former President Jacob Zuma and revealed the extent of governance decay, yet prosecution of implicated individuals has been slow, reinforcing public perceptions of weak accountability mechanisms.
Under the Current Path, capacity is projected to increase modestly to 2043, reflecting gradual institutional strengthening but continued governance inefficiencies. Under the Governance scenario, where regulatory reforms, anti-corruption measures and public sector professionalisation are implemented, the capacity index rises by 10% in 2043, indicating significant improvement. The current administration’s push for public sector professionalisation is a step in the right direction, but political instability and factional battles within the ANC remain a challenge.
South Africa consistently performs relatively well on inclusion, owing to its liberal constitution, independent judiciary, strong civil liberties, press freedom, regular free and fair elections and democratic institutions. Its score on the inclusion index is consistently among the highest in Africa and ranks as the second highest amongst UMIC’s globally. The intervention in this dimension is therefore a modest 1% improvement by 2043, reflecting continued improvements in gender empowerment, political participation and representation. South Africa already outperforms its regional peers, including Botswana, Namibia and Mauritius.
South Africa’s Government of National Unity (GNU), formed after the highly contested 2024 elections, is a testament to the country’s democratic resilience in spite of its manifold challenges. However, political fragmentation is deepening, with coalition governments becoming more common in metropoles and municipalities, often leading to governance instability and pointing to the need for reform. Voter registration, a key indicator of support for democracy, has, for example, declined from 80% in 2014 to 70% in 2024, while voter turnout has fallen to 58.6% in the latest elections, reflecting a growing trust deficit in political institutions.
Eventually, South Africa’s relatively high ranking on inclusion is insufficient to offset weaknesses in security and capacity:
- Without accountability mechanisms and effective enforcement, governance effectiveness will struggle to reverse its ongoing decline.
- The slow pace of anti-corruption efforts and ongoing political instability within the GNU pose risks to long-term governance improvements.
- Failure to address security concerns deters foreign and domestic investment, exacerbating economic stagnation.
The Governance scenario reflects the effect of targeted institutional reforms that improve South Africa’s score on the composite governance index by 8% by 2043 compared to the Current Path, overtaking Namibia and bringing it closer to Botswana’s governance standards and halving the gap with Mauritius—one of Africa’s strongest governance performers.
The Governance scenario increases the size of South Africa’s economy by almost 9% (equivalent to US$54.3 billion) in 2043 when compared to the Current Path. GDP per capita will be US$840 larger, and 2 million fewer South Africans will be considered extremely poor in 2043.
There is much that South Africa can do to improve governance, such as:
- Strengthening governance capacity through professionalisation of the civil service, improving SOE management and reducing regulatory inefficiencies.
- Tackling organised crime and corruption through judicial independence, intelligence-led policing and effective prosecution.
- Enhancing service delivery to restore public confidence in government institutions.
- Fostering economic growth by creating an enabling business environment, reducing bureaucratic bottlenecks and investing in infrastructure.
Chart 29 presents GDP per capita in the Current Path and Combined scenario plus the synergistic effect in the eight sectoral scenarios. The purchasing power parity data is from 2020 to 2043.
The Combined scenario combines all eight sectoral scenarios: Governance, Demographics and Health, Education, Large Infrastructure and Leapfrogging, Agriculture, Manufacturing and Leapfrogging, AfCFTA, and Financial Flows. The integrated nature of the forecasting model means that these sectoral scenarios produce a synergistic or additional effect that further improves outcomes.
In the Combined scenario, GDP per capita would be 33% above the Current Path in 2043, equivalent to an additional US$4 900 per person and the country is significantly more energy secure.
Among the eight sectoral scenarios, the Manufacturing scenario has the largest impact on GDP per capita (an increase of 6.3% or US$930 per person), followed by the full implementation of the AfCFTA, better Governance and inward Financial Flows (foreign direct investment, in particular). Better health outcomes and education are slower to manifest but their impact on improved contributions to human capital is long-lasting.
After an initial period of euphoria following the historic transition from apartheid in the 1990s, South Africa has been buffeted by numerous exogenous and self-inflicted shocks that have reduced growth to the extent that GDP per capita has stagnated or steadily declined since 2013, with a brief recovery in 2018. On the Current Path, South Africa will recover to its 2013 level in 2039, implying 26 lost years. Following the May 2024 national elections and the establishment of a Government of National Unity (GNU), hope exists for positive change. In the Combined scenario, South Africa will recover to its 2013 GDP per capita level in 2032, seven years earlier than on the Current Path, with strong and positive growth thereafter.
In his inauguration address following the establishment of the GNU, President Cyril Ramaphosa described it as the beginning of a new era. The GNU comprises 10 political parties, seven of which hold cabinet positions in a national administration previously dominated by the ANC. The challenge is translating the associated changes into inclusive economic growth and the political acumen to have this balancing act together.
Change to South Africa’s mediocre Current Path prospects will inevitably require deliberate choices, determined implementation, leadership and some pain, but the impact of the combined efforts on incomes, extreme poverty and growth can be transformative.
The two scenarios with the most impact, Manufacturing and the full implementation of the AfCFTA, are mutually supportive. The latter would boost South Africa’s manufacturing trade with the region and its role as a logistics and services hub. Previously, the ANC government adopted a cautious approach to trade agreements. Instead of upstream support to enable manufacturing, the focus was on localisation to produce for the protected domestic market. South Africa has not incentivised companies to expand globally or to explore new export opportunities. The effect was to raise barriers for new entrants and to lower competition for incumbent firms.
To address its previous bias against growing its manufacuring sector through exports, the Departments of Trade, Industry and Competition (DTIC) and International Relations and Co-operation (DIRCO) announced, in November 2024, that they intend to review and strengthen South Africa’s trade relations with its larger traiding partners to unlock more rapid export growth - but the efforts have subsequently tripped up with the United States, South Africa’s second-largest trade partner, becoming adversarial.
South Africa urgently needs to address the high costs of investment and trading across borders; review the impact of existing industrial, localisation and sector-specific policies on export behaviour; implement a comprehensive and well-targeted export promotion and export finance framework; and update its trade policy approach to reverse ongoing deindustrialisation.
In its 2023 Budget review, National Treasury estimated that about 35% of the growth slowdown from 2007 to 2021 can be attributed to the underperformance of network industries such as electricity and rail, with their productivity shocks having significantly impacted the rest of the economy. The government, therefore, has decided to prioritise network industries as part of Operation Vulindlela, a joint initiative between the Presidency and National Treasury to accelerate the implementation of structural and economic reforms to drive growth and job creation.
By the close of 2024, Operation Vulindlela had achieved particular success in the energy sector (through the National Energy Crisis Committee or NECOM) and logistics (through the National Logistics Crisis Committee or NLCC). The result is an end to load-shedding and near energy security whilst freight volumes, port operations, border post-processing times and improvements in operations of the passenger rail system gain momentum. There is much more scope to have South Africa’s most significant ports — ranked among the world’s worst performers — run privately and to move more goods by rail rather than trucks. There is now a concerted effort to prioritise investment in infrastructure to grow regional and international trade.
The second phase of Operation Vulindlela will focus on private sector growth, which requires business confidence to facilitate an investment climate. Improvements in transport infrastructure and the emphasis on facilitating an investment and business climate will lay the foundations for a more significant impact of free trade on economic growth.
Our analysis confirms the potential that a focus on manufacturing and the AfCFTA could have on South Africa’s economic development in expanding into the region due to its proximity and rapid population growth. The improvement of port and transport infrastructure, removal of tariffs imposed on South African exports into the rest of Africa, and improved trade facilitation present South Africa with growth opportunities in manufacturing, agriculture and services.
Chart 30 presents poverty in the Current Path and in each scenario, from 2020 to 2043. The data is for the number of people and as a percentage of the population.
Because South Africa has extraordinarily high levels of inequality, a relatively small informal sector and large numbers of people who are not economically active, only the Governance scenario has a significant impact on poverty because it includes additional large welfare transfers.
Using the World Bank upper-middle-income monetary poverty line (US$6.85 per person), 12.8 million people (or 20.4% of the population) lived in poverty in 2023. The Current Path would see that number slightly decrease to 12.3 million people, representing 16.8% of the population in 2043. In the Combined scenario, the number of poor people will decline to 8.1 million people or 11.2% of the population. In fact, in two scenarios, Financial Flows and Demographics and Health, poverty in 2043 is marginally higher than on the Current Path, since South Africa’s high level of inequality weakens the elasticity of poverty to economic growth. An initial unequal distribution of physical, human and financial resources makes it much more difficult for the poor to participate in and gain from economic growth. FDI inflows in the Financial Flows scenario benefit higher-skilled and better-educated persons and, although it accelerates growth, does not reduce poverty.
Because of the inclusion of additional social transfers in the Governance scenario, it has the largest impact on poverty reduction amongst the eight sectoral scenario (2 million people in 2043, using US$2.15), followed by the Manufacturing scenario (780 000 people in 2043).
Social grants from the government already support around a third of South Africans (19 million people plus 8-9 million people who received the COVID-19 Social Relief Grant in 2022/3). Grants play an important role in alleviating extreme poverty and also have a positive impact on reducing inequality. They serve as a crucial lifeline for many South Africans, providing financial support to vulnerable groups such as the elderly, children and people with disabilities and are administered by the South African Social Security Agency (SASSA), consisting of:
- Older Person's Grant (old age pension): for individuals aged 60 and above (around 3.9 million).
- Child Support Grant: for children whose primary caregivers are unable to provide for them (around 13 million children).
- Care Dependency Grant: for people of any age who require full-time care due to a disability or illness.
- Disability Grant: for individuals with a severe and permanent disability (around 1 million).
- Foster Child Grant: for caregivers looking after children who cannot be cared for by their parents.
- Grant-in-Aid: for people living on a social grant who require additional support (over 300 000).
- War Veteran's Grant: for veterans who served in the South African Defence Force and various liberation armies (few remaining recipients).
- Social Relief of Distress Grant: a temporary provision for individuals in dire need who are unable to meet their or their family’s most basic needs (around 8.1 million).
Various lobby groups have pushed for the introduction of a universal basic income (UBI) grant that would provide each citizen with a monthly cash payment, possibly by making the SRD grant permanent (and/or increasing its value).
Chart 31 presents GDP in the Current Path and the Combined scenario, from 2020 to 2043. The data is in US$ 2017 and at market exchange rates.
After more than a decade of slow and sometimes negative growth, South Africa’s GDP stood at US$392.1 billion in 2023. On the Current Path, it will increase to US$628.3 in 2043. In the Combined scenario, it would get to US$961 billion, 53% above the Current Path for 2043.
Instead of growing at 2.4% from 2024 to 2043, economic growth would come to almost double that in the Combined scenario, at 4.6%. These rates are a far cry from the 5.4% growth target to 2030 that was set out in the 2012 National Development Plan, but would transform South Africa - although not resolve its massive poverty, inequality or unemployment, all of which are generational challenges.
Classic growth theory posits that economic growth comes from the contributions of labour, capital and technology/multifactor productivity, with labour contributing least and that of technology steadily increasing in importance over time. In our modelling, the contribution of multifactor productivity consists of four components, knowledge, physical, social and human capital. Among these components, poor human capital stands out as South Africa’s greatest challenge to sustained, rapid growth, followed by social capital - the latter largely a function of its high crime and intentional injury rates. The country has a small comparative advantage in both knowledge capital, which is a net contributor to growth, and its physical capital. The positive contribution from knowledge capital is underpinned by South Africa’s relatively high levels of integration into the global economy compared to most other African economies, and the positive impact of knowledge diffusion through the larger number of trade and multinational corporations active in the country compared to other African countries. The positive impact of physical capital flows from South Africa’s relatively high levels of infrastructure and basic service provision, such as water and sanitation.
The Combined scenario has a large positive impact on the contribution from social capital to the extent that it contributes positively to growth as from 2032, but does not fully eliminate the drag from poor human capital which is a generational challenge.
Chart 32 presents the value added by sector in the Current Path and in the Combined scenario, for 2023 and 2043. The data is in billion US$ as well as a percentage of GDP.
Our modelling provides forecasts in six sectors: agriculture, energy, materials (including mining), manufacturing, services and ICTech. In 2023, the services sector contributed 65% to GDP, followed by manufacturing at 12%, energy at 8.6%, materials (including mining) at 8.5%, ICTech at 4.2% and agriculture at 2.3%. The Combined scenario will result in an economy that is significantly larger in 2043 (see Chart 31), mostly due to the growth in the contribution of services and manufacturing above the Current Path. In absolute terms, all sectors are larger in the Combined scenario compared to the Current Path in 2043.
Chart 33 presents the size of the informal sector as per cent of the total economy in the Current Path and in the Combined scenario, from 2020 to 2043.
South Africa has a relatively small informal sector compared to other countries at similar levels of development. In 2023, the informal sector contributed 13% to GDP (US$50 billion), some three percentage points below the average for upper-middle-income countries (UMICs) in Africa and comparable to Malaysia, Serbia, Brazil and Costa Rica, all of whom have higher GDP per capita than South Africa and lower levels of inequality. In the Current Path, the informal sector will decline to 12% (US$75.5 billion) by 2043.
Because of the effect of interventions on government effectiveness, reduced corruption and better regulations, the Governance scenario reduces the informal sector most rapidly amongst the eight sectoral scenarios. In the Combined scenario, the informal sector will constitute 6.7% of GDP, equivalent to US$64.2 billion.
Given its extreme levels of inequality and unemployment, South Africa needs to grow its informal sector even as it pursues employment in the formal economy. Growth in the informal sector requires the easing and simplification of regulations and permits to allow informal businesses to operate legally, improved access to finance such as microfinance and credit facilities, infrastructure development to provide electricity, water and transportation in areas with large informal sector activity, and the provision of vocational and entrepreneurial skills to empower persons active in the sector.
In addition, efforts must be made to foster market integration by promoting linkages with formal enterprises, providing market information and supporting networking opportunities. Enhanced business support services tailored to the informal sector are also required, such as business incubators and the provision of digital tools and technologies to improve efficiencies and productivity. Because of its spatial inequality, the focus would probably have to be in townships and rural areas, whilst at the same time launching efforts to improve living conditions and infrastructure in informal settlements to create a conducive business opportunity.
Chart 34 compares life expectancy in the Current Path with the Combined scenario for 2023 and 2043.
Life expectancy at birth is one of the best aggregate measures of health and well-being, and a powerful tool in helping to explain the huge drag that poor human capital in South Africa has on economic growth.
At the height of the HIV/AIDS scourge in 2005, life expectancy in South Africa was a mere 52 years, compared to an average of 73 years for UMICs globally. South Africa’s life expectancy has subsequently not fully recovered to its previous trajectory, but in 2023 it was still 11 years below that of UMICs globally (66 years vs 77 years) in large part due to an unusually high burden of communicable diseases, in particular HIV/AIDS and tuberculosis. South Africa’s life expectancy was also 1.3 years lower than the average for Africa. The Current Path is that the gap between South Africa and the average for UMICs globally will marginally close. In the Combined scenario, life expectancy in South Africa improves significantly (to 74.1 years) by 2043 but will still be 5.8 years below the average for UMICs.
Female life expectancy in South Africa was 6.6 years above that of males in 2023 and increases to 7.5 years by 2043 in both the Current Path and in the Combined scenario.
Signing the Presidential Health Compact in July 2019, President Ramaphosa publicly acknowledged the crisis in South Africa’s health system. The biggest obstacles to achieving improved health outcomes are a poorly functioning public healthcare system, over-servicing and inflated costs in the private healthcare system, and public debt. Better management and more competition are vital, but given poor efficiencies and high debt levels, South Africa will struggle to implement universal health coverage as envisioned in its 2017 White Paper.
Chart 35 compares the Gini coefficient in the Current Path with the Combined scenario, from 2020 to 2043.
South Africa’s status as one of the most unequal countries in the world is well known. On the Current Path, only the Central African Republic, a war-torn, low-income country with significantly lower development indicators, will relegate South Africa to second spot in 2043. In the Combined scenario, South Africa’s Gini coefficient will be almost 6% lower in 2043 than in the Current Path - in spite of the provision of additional social welfare transfers contained in the Governance scenario.
The most effective counter to South Africa’s extraordinarily high levels of inequality is undoubtedly formal-sector employment. Even being active in the informal sector would be better than being unemployed and not economically active.
Compared to the Current Path, the Combined scenario would see the largest employment growth in the manufacturing sector by 2043, followed by services, materials, and agriculture. Employment in the energy sector, which is increasingly renewables-based, declines marginally. Whereas, in 2023, 20.3 million South Africans were employed in the six sectors modelled, that number would increase to 33 million in the Combined scenario by 2043, 4.5 million above the Current Path. Labour force participation rates therefore improve to 64.4% in the Combined scenario compared to 56.5% in the Current Path. Here, it is important to note that much of the associated increase stems from the modelling approach applied in the Manufacturing scenario, where we increased labour participation rates for men and women, reflecting policies that advance low-end manufacturing.
The size of South Africa’s labour force, persons who are either employed or actively seeking employment, increases significantly in the Combined scenario. In 2023, it was 26.4 million people out of a total population of 63.8 million. In the Current Path, the labour force in 2043 will be 34.4 million. In the Combined scenario, it will be 40 million while South Africa’s total population will have increased to 77 million.
Important as these improvements in the Combined scenario are, they are insufficient for a country with South Africa’s high levels of unemployment, poverty and inequality. Government, the private sector and civil society would clearly have to come together around a range of employment schemes to maintain stability sufficient to allow for growth to resolve the unemployment and inequality challenge in the long term.
Chart 36 compares carbon emissions in the Current Path with the Combined scenario from 2020 to 2043.
South Africa is the world’s 15th-biggest producer of greenhouse gases. It produced 1.3% of global emissions from fossil fuel use in 2023 and released 121 million tons of carbon (or 444 million tons of CO2 equivalent) from fossil fuels. On the Current Path, emissions will decline to below 2023 levels to 112 million tons in 2043 (411 million tons of CO2 equivalent) as reliance on coal for electricity steadily declines, driven by reductions in coal exports and increased energy production from wind and solar.
Coal will inevitably remain the dominant source of energy production in South Africa and is also essential from an employment perspective, given the country’s extraordinarily high unemployment rates. In 2024, coal directly employed between 75 000 and 100 000 workers, constituting about 0.5% of total employment and nearly 20% of mining employment. As a result, various studies are underway towards more efficient and cleaner coal technologies, including a Carbon Capture Utilisation and Storage (CCUS) pilot study.
Given its outsized contribution to global carbon emissions relative to its economy, South Africa committed to an ambitious reduction in carbon emissions, captured in its 2019 National Climate Change Adaptation Strategy (NCCAS) that serves as an overarching legislative framework for adapting to and mitigating the effects of climate change. It is supported by the implementation of the lower missions' development and growth strategy. South Africa has already imposed a carbon tax on emissions that gradually becomes more punitive.
South Africa's 2025 updated Nationally Determined Contribution (NDC) commits to significantly reducing greenhouse gas emissions to 320 to 380 MtCO2e (million tons of CO2 equivalent) by 2035. Total greenhouse gas emissions were approximately 480 MtCO2e in 2023. South Africa’s commitment aligns with the Paris Agreement's targets to maintain global temperature increases well below two degrees Celsius, with aspirations to limit warming to 1.5 degrees Celsius. The country has also set itself the aspiration to reach net zero emissions by 2050 in its Low-Emission Development Strategy, much of which results from an increase in carbon sinks through afforestation, reforestation, reversing land degradation and grassland management.
Since the previous NDC in 2021, which set lower targets, SA has passed the Climate Change Act, giving statutory force to emission-reduction and adaptation plans; it has begun the second phase of the Carbon Tax Act (2019) with higher rates; and it has updated the Integrated Resource Plan (IRP 2025) to include 44GW of new renewable capacity by 2035.. However, it has also decided to extend the life of a number of coal-fired power stations, which have raised concerns about the credibility and feasibility of these targets
The NDC envisioned a strategic transformation in energy production, as already delineated in the 2019 Integrated Resource Plan (IRP). This plan advocates for a diversified energy mix, expanding gas and nuclear power capabilities and significantly increasing renewable energy sources. The 2023 draft update to the IRP extends these initiatives, focusing on reducing its reliance on coal and bolstering investments in cleaner, sustainable energy options. The 2025 IRP retained the ambition for 2 500 MW of additional nuclear, but additional nuclear is not required in our Combined scenario.
The first Adaptation Communication outlines strategies across essential sectors to effectively manage and mitigate climate impacts. In his State of the Nation Address in February 2024, President Ramaphosa announced the establishment of the Climate Change Response Fund (CCRF) to bring together all spheres of government and the private sector and leverage collaborative efforts to build resilience and respond to climate change. The subsequent Climate Change Act, proclaimed by the President in March 2025, mandates the development of mechanisms to support and finance climate change responses for a transition to a low-carbon economy and society.
This transition is part of a broader Just Energy Transition (JET), designed to meet South Africa’s stringent climate goals while promoting economic and social sustainability. Emphasising a mix of various energy production types is vital for maintaining energy security alongside environmental sustainability. However, achieving the NDC's ambitious targets will require a greater commitment to renewable energy, alongside enhanced international support and technological innovation.
By March 2025, the Just Energy Transition had pledged US$12.8 billion to the JET along with contributions from Spain, Switzerland and Canada, a figure that would have been significantly higher had the US not withdrawn. The 2025 NDC estimates that South Africa needs to spend about 4.5% of GDP each year to finance its transition to a low-carbon, climate-resilient economy.
The just-energy conversion is proving difficult, however. A first effort, funded by the World Bank at US$497 million, to convert the 1 000MW Komati coal-fired power station in the Mpumalanga province into a renewable energy generation site powered by 150MW of solar, 70MW of wind, and 150MW of battery storage did not inspire confidence. Poor planning meant the plant increased unemployment and poverty, creating widespread resentment in the surrounding area and politically complicating subsequent efforts to transition away from coal.
It was no surprise that the inaugural ‘South African State of Climate Action Report’ publication in June 2024 found that South Africa’s commitments to tackling climate change and facilitating a just transition are hindered by incoherent policies, weak governance structures, and inconsistent government and other stakeholders' actions. The report was published at a time when Eskom, South Africa’s state-owned energy utility, had been permitted to delay the decommissioning of a number of its coal-fired power stations as it struggled to meet demand. In March 2025, the Minister of Forest, Fisheries and Environment also granted a limited exemption from minimum emissions standards prescribed in air quality regulations to eight ESKOM coal-fired power plants.
The 2024 Climate Change Act sets out a national climate change response, including mitigation and adaptation actions. The Act enables alignment of policies to ensure South Africa’s transition to a low-carbon and climate-resilient economy by setting sectoral carbon reduction targets, guiding industries and large emitters towards net zero, and aligning the timing with the carbon tax and carbon trading regimes. All industries that emit greenhouse gases, including coal mining, must submit annual progress reports to the Minister of Forestry, Fisheries and the Environment. The Act makes it an offence if a business fails to submit a mitigation plan and criminalises the failure to provide the minister with information or to comply with emission reduction measures. It also established the Presidential Climate Commission as a statutory body. It gave powers and responsibilities to all layers of government to manage emissions targets on a sectoral and sub-sectoral basis and set up an adaptation resilience fund, whilst requiring the state to undertake adaptation financing and resilience.
South Africa’s carbon emissions in the various sectoral scenarios will be offset by the steady replacement of coal by gas, solar, wind and other renewables (reflected in the Large Infrastructure and Leapfrogging scenario), which reduces carbon emissions such that South Africa will release 27% less emissions from the use of fossil fuels in 2043 in the high-growth Combined scenario than on the Current Path, even though the economy will be 53% larger.
The remarkable impact of more renewables and gas means that South Africa will be the third-largest emitter of carbon in Africa (down from its current first position), having been overtaken by Nigeria and Egypt. In 2043, South Africa will be the 23rd-largest carbon emitter globally. It is currently at number 15.
In the Combined scenario, South Africa will still produce 43% of its energy from coal following an aggressively ramping up of wind and solar, such that the contributions from the latter two would constitute 20% and 38% of energy production.
Chart 37 compares energy demand and production in the Current Path with the Combined scenario from 2020 to 2043. The energy production forecast is part of the Large Infrastructure and Leapfrogging scenario (and included in the Combined scenario).
Energy production in our modelling is categorised into 9 types: oil, gas, coal, hydro, nuclear, solar, wind, geothermal, and other renewables. The data for coal includes open-cycle gas turbines and pumped storage produced by Eskom as well as coal exports. The data is converted into billion or million barrels of oil equivalent (BBOE or MBOE) to allow for comparisons between different energy sources. South Africa has the only functioning commercial nuclear energy production plant in Africa (at Koeberg in the Western Cape), and apartheid South Africa developed a sophisticated oil from coal industry whilst still under sanctions, today hosted by a private company, Sasol.
On the Current Path, the value of South Africa’s energy imports (oil and gas) exceeds exports (mostly coal) by value as from 2032, meaning that the country is becoming increasingly energy insecure, and the gap is set to increase over time. South Africa has traditionally exported about a quarter of its total coal production (with the value anything between US$14 and US$7 bn, depending on the international coal price). Already, South Africa’s 2023 energy imports (mostly refined petroleum) amounted to US$7.5 billion, set to increase to US$12.8 billion on the Current Path by 2043. Ongoing reliance on coal electricity generation and exports runs counter to South Africa's commitments in terms of global carbon reductions under the Paris Agreement. The heavy reliance on coal for domestic energy production also makes South Africa vulnerable to efforts by others, such as the European Union's Carbon Border Adjustment Mechanism (CBAM), that will tax goods entering the EU that use fossil fuels, potentially competing with its more expensive but less carbon-intensive domestic production.
Poor planning and implementation inertia have led to ongoing electricity shortages in South Africa that have persisted for more than a decade, before easing in 2024. In recent years, the government has started publishing and regularly updating an Integrated Resource Plan (IRP) to ensure the security of the electricity supply and balance supply with demand whilst considering environmental and cost factors. Coming from very high levels of carbon emissions (due to its reliance on coal for most of its electricity generation), means that South Africa has significant potential to reduce emissions as it envisions large changes to its energy mix, but it also has to increase energy production to account for the increase in energy demand.
In 2023, coal contributed 96% of South Africa’s energy production (including exports), followed by 2% from nuclear and 0.9% from solar and even less from wind and gas. As a result of its heavy reliance on coal, South Africa is the largest emitter of carbon in Africa and the 15th largest globally (see Chart 36). After several years of delays and various efforts to start a large nuclear build, the country eventually embarked on building the Medupi and Kusile coal-fired power stations - both of which proved to have serious design flaws, large cost overruns and came into operation several years later than originally planned. The government has had to balance the ongoing electricity shortages (and the associated need to keep more coal-fired power stations in service) with its commitments to reduce carbon emissions as set out in its updated Nationally Determined Contribution (NDC) discussed earlier. To that end, it also returned several mothballed coal-fired stations to service and delayed the closure of others.
Gas is important to South Africa, particularly as Sasol, which imports natural gas from its declining Pande and Temane fields in Mozambique, will stop supplying local companies with gas starting in June 2026 as reserves deplete. South Africa has auctioned exploration blocks for shale gas, with a focus on the Orange Basin and the Karoo region, but legal challenges and environmental concerns have constrained exploration, such as halting Shell’s exploration for gas in 2024. Later that year, Shell announced that it would shift its attention to the lucrative Orange River basin on the west coast while it, Total and others were exiting the gas discoveries off the South coast of Mossel Bay that had yielded two major discoveries, Brulpadda and Luiperd, citing the absence of a viable domestic gas market as the main obstacle.
In the Combined scenario, South Africa’s energy demand in 2043 is 47% above its 2023 level for an economy that is 145% larger than in 2023.
From an energy perspective, South Africa needs to implement the bold targets and interventions included in the South African Renewable Energy Master Plan (SAREM), including: increasing the pace of rolling out renewable energy projects that underpin the development of domestic manufacturing capabilities and localising the manufacturing of key components such as solar panels, inverters, wind turbine towers, cables and batteries. Part of this is the establishment of industrial hubs and Special Economic Zones that focus on renewable energy manufacturing and services, along with significant demand- and supply-side support, targeting high levels of local content for key inputs and increasing domestic manufacturing capacity. South Africa needs to ensure that the shift to renewable energy is inclusive, skills-intensive, and aligned with climate commitments, contributing to reduced greenhouse gas emissions while positioning the country as a competitive destination for clean energy and green industry investment.
Contrary to the Current Path that would see South Africa rapidly becoming more energy insecure, energy production keeps pace with demand in the Combined scenario.
Chart 38 summarises the policy recommendations for South Africa.
South Africa is awash with plans and strategies - but does not prioritise expertise and best practices, nor does it implement and enforce the mounds of compacts, agreements and statements of intent. South Africa needs to prioritise, sequence and remove the binding constraints on growth.
The responsibility for improvements lies, in the first instance, at the door of the country’s political leadership, which fails to prioritise competence over politics and patronage in the selection of leadership in government and in parastatals. Thus, when the Johannesburg Centre for Development and Enterprise (CDE) published a series of reports in 2024 that reflected national priorities for growth, it began by calling for the reorganisation of the Presidency and the Cabinet.
Instead of a commitment to growth and the (re)distribution of its fruits in a manner that would reduce inequality and grow opportunities for those who had suffered and been marginalised under apartheid, since the administration of Thabo Mbeki, the government has adopted a shotgun approach. Everything is a priority, whilst simultaneously adopting policies that benefit a small group of empowered individuals, often at the expense of the majority. The result is a compliance state that suffocates growth by seeking to bend the market towards equity as a precondition for investment and growth, rather than pursuing growth that would enable redistribution. Although there have been some improvements in delivery and focus with the establishment of a Government of National Unity (GNU), much more needs to be done. Operation Vulindlela goes some way towards prioritisation and sequencing, but it remains an add-on rather than addressing government inefficiencies.
It is only possible to reduce unemployment and inequality with an economy that grows rapidly and inclusively. Progress requires a laser-like focus on the binding constraints, such as electricity and logistics. Even in the Combined scenario, unemployment and inequality are likely to remain hallmarks of the country for the next generation, despite the 16% improvement in employment and a 4% reduction in inequality compared to the Current Path for 2043. More jobs require improvements in employment intensity, implying a more flexible labour market, actively working towards a more significant and dynamic informal sector, a partnership with the private sector to facilitate opportunities, such as growth in low-end manufacturing, and for South Africans to do everything possible to unlock domestic and foreign investment. It also implies dealing with the problem of excessive market power - the concentration of ownership and control, inadequate restraints on anti-competitive trade policies, and restrictions on full and free participation by informal traders and small businesses in the economy.
Efforts to improve employment will succeed only if South Africa provides a clear and stable macroeconomic framework, including keeping inflation low while ensuring sustainable public finances. Given the government's high debt burden, private sector investment in infrastructure is particularly important if South Africa is to turn the associated challenges around. It can be done in various ways, such as by offering incentives and launching a credit guarantee vehicle, backed by the World Bank, to de-risk projects. The result will be increased business confidence, better productivity and higher levels of foreign direct investment (FDI). Progress is being made, particularly in respect of alleviating the port and rail constraints with private sector investment in priority rail and post corridors proceeding apace, as well as with grid infrastructure following the release of the Transmission Development Plan, amongst others
In addition to physical infrastructure such as the electricity grid, ports, railways and roads, South Africa must prioritise the rapid expansion of broadband and digital access. Affordable, reliable internet access is no longer a luxury but a prerequisite for economic competitiveness, innovation and the participation of small and medium enterprises in local, regional and global markets. Investment in fibre networks, mobile broadband, satellite coverage and digital skills development must be integrated into broader infrastructure strategies to ensure that South Africa can fully benefit from opportunities presented by the Fourth Industrial Revolution, regional trade (such as AfCFTA e-commerce protocols) and digital entrepreneurship.
Because South Africa pursues a developmental economic model, the state's effectiveness is critical for the country's well-being. Most state institutions suffer from a massive deficit of competency, skills and ethics, pointing to the need for a hard-nosed approach to the hundreds of state-owned enterprises, many of which could be closed or privatised. The balance sheet of state companies must be stabilised if the country is to achieve sustainable public finances.
South Africa must actively pursue an export-led growth path, focusing on expanding its manufacturing and services sectors through improved competitiveness. It should exploit the African market by leveraging the benefits of the SADC free trade agreement, implementing the AfCFTA, and actively pursuing its integration into regional and global value chains. Already, the Economic Partnership Agreement (EPA) between the European Union and SADC has seen EU imports from South Africa grow by 65% between 2016 and 2023, and EU exports to South Africa grow by 26%. An export-oriented approach requires an open trade policy rather than protection of the country's small internal market, which forces consumers to pay a premium to compensate for the local producer's lack of competitiveness.
Rhetorically, the government appears to be aware of the regional market potential. Speaking at the opening of Parliament on 18 July after the 2024 elections that resulted in establishing the GNU, President Ramaphosa noted: ‘We see great potential for growth beyond our borders. As we strengthen economic diplomacy with our largest and potential trading partners, we will prioritise the implementation of the African Continental Free Trade Area to increase our exports to the rest of the continent.’
The AfCFTA should form part of a broader developmental program aimed at incentivising industrialisation and investment.
Beyond addressing network inefficiencies, the government needs to introduce targeted incentives to reduce South Africa’s high export concentration, which is currently dominated by a limited number of large firms. Policies should aim to promote small and medium-sized exporting enterprises, unlocking new opportunities for diversification and growth. The country needs to shift from protectionism to competitiveness and from sectoral master plans to recognising the importance of value chains, as recently argued by the CDE.
In addition to active support to reduce input costs, a manufacturing export-led growth path includes reducing the high costs of investment and trading across regional borders; reviewing the impact of existing industrial, localisation and sector-specific policies on export behaviour; implementing a comprehensive and well-targeted export promotion and export finance framework; and updating its trade policy approach to this effect. Because it already has a sophisticated national payment system which handles domestic clearing and settlement efficiently, South Africa has not yet joined the Pan-African Payment and Settlement System (PAPSS), which enables companies to transact in any African currency without using a third-party currency such as the US dollar. This matter is now under consideration, but it is complicated as it would require integrating PAPSS with South Africa's national payment system. The second step must be to fix the connecting infrastructure and remove non-tariff barriers, which is the focus of the National Logistics Crisis Committee. Finally, the work of the Department of Trade, Industry and Competition (DTIC) should prioritise improvement in the ease of doing business in South Africa.
Amongst our eight sectoral scenarios, the growth of the manufacturing sector promises the most employment creation. Low employment levels are South Africa's key challenge, as they drive extreme inequality, poverty, and disempowerment. In the words of Professor Anthony Black, a leading proponent of labour-intensive light manufacturing, South Africa has the ingredients: a large pool of unskilled and semi-skilled labour, an advanced financial system, highly developed infrastructure and capable domestic firms that could attract large-scale domestic and foreign investment. Black lists three critical actions:
- Switch incentives to support employment, both directly and indirectly, such as by favouring training over capital investment and energy.
- Review the regulations (including labour regulations) that hinder small manufacturing firms, particularly the extension of National Bargaining Council determinations to non-parties.
- Experiment using one or more special economic zones as light manufacturing zones.
Given the need to expand the electricity grid with 14 500 km of new lines and enhanced transformer capacity over the next decade, the South African Renewable Energy Masterplan (SAREM) can play an important role in localising manufacturing and enhancing skills.
South Africa should explore global market value chains to create opportunities for growth and competitiveness. For example, South Africa spends a significant amount on subsidising its important automotive program (estimated at ZAR35 billion annually) and, when it was last reviewed in 2008, was considered to be a net drain on the country. No subsequent review has been undertaken, while the global automotive sector has undergone significant changes, including the introduction of electric vehicles.
Poor human capital (primarily due to the lingering effects of HIV/AIDS, but also reflecting poor education returns and a weak healthcare sector) is the most significant structural constraint on South Africa’s long-term growth. Fixing South Africa’s poor contribution to growth through investment in human capital is a long-term undertaking, with appropriate education making the greatest contribution. South Africa’s Human Resource Development Council has regularly revised and released a Human Resource Development Strategy (HDRS-SA). The most recent version was published in 2022 with a vision for 2030. The Master Skills Plan is then used by different sectors, industries, employers and Sector Education and Training Authorities (SETAs), serving as the implementation plan of the reconceptualised HRDS-SA.
During 2022 and 2023, CDE conducted a comprehensive analysis of the challenges and reforms required in education. The key recommendations in its reports focus on five areas for action to improve South Africa’s education outcomes:
- Tackling corruption and state capture in education by prohibiting cadre deployment and introducing measures that remove the South African Democratic Teachers Union’s (SADTU) stranglehold on education departments.
- Raising accountability levels by bringing back the Annual National Assessment (ANA) tests for grades 1-9, reinvigorating an independent National Education Evaluation and Development Unit (NEEDU), and giving principals more power over the appointment and management of teachers in their schools.
- Improve teacher performance by introducing higher teacher training standards, providing more effective support for existing teachers, and urgently recruiting skilled foreign teachers in areas of shortage.
- Installing fresh leadership in the public education system. Some progress was made in this regard with the appointment of a Democratic Alliance member as Minister of Basic Education.
- Setting realistic national and provincial performance goals.
Looking to 2043, South Africa must also aspire to much better health outcomes if it is to change its current mediocre long-term growth forecast. Much work has been done to explore universal health coverage (UHC) in South Africa, though in recent years the focus has shifted to financing reform at the expense of other issues. South Africa must pay attention to all six of the World Health Organisation’s (WHO) ‘building blocks’ of the health system (financing, leadership/governance, service delivery, health workforce, health information systems, medical products and technology). Instead, the singular focus on National Health Insurance has stalled efforts to implement the other reforms required to build and strengthen the health system and has contributed to the neglect and deterioration of state hospitals and other components of the care system. The necessary reforms include the need to review and equitably spread public resources across provinces, districts and levels of care, end corruption and irregular spending in the public sector, establish and roll out a national health information system and implement the recommendations in the private health care system, as reflected in the 2019 Health Market Inquiry report.
Mining is particularly important in the poverty-stricken North West, Limpopo, Mpumalanga and the Northern Cape provinces, but has declined and has given rise to a large criminal and illegal artisanal sector, so-called zama zamas. What remains of the mining sector is export-oriented due to low domestic demand for most commodities, yet it has significant future potential. South Africa has, amongst others, the world's largest known reserves of platinum group metals (PGMs), chrome ore, and manganese ore, and the second-largest reserves of zirconium, vanadium, and titanium.
South Africa needs a coherent, efficient, and stable regulatory environment for its mining sector that encourages exploration investment through transparent, expedited processes. This would lead to the construction of new mines and the expansion of existing operations to extend their lifespans and create sustainable jobs. Some legislative progress is currently mooted in this regard.
South Africa urgently needs a determined effort to grow the agricultural sector, which our analysis indicates has significant potential. Growth in the agricultural sector is often more labour-intensive than in other sectors, though much of that labour is in agro-processing. Climate change will steadily impact the Western Cape, currently the province with the most significant agricultural sector, in terms of sales of goods and services, salaries and wages, and employment. The Eastern Cape province has the greatest potential for large productivity increases through a transition away from subsistence agriculture and by fixing degraded rural economic infrastructure, such as roads and storage facilities, whilst the limited irrigation infrastructure is dilapidated. Some policies that could improve yields include creating a consolidated fund to crowd in resources from various government initiatives, private-sector capital, and donor partners to finance rural infrastructure and strengthen climate-smart agricultural practices.
Sustained change in agricultural yields will only come once South Africa grasps the nettle and moves towards individual title-holding, stepping away from the former homelands' legacy of communal land ownership. Since most land here is registered in the state's name (or in the Ingonyama trust in the case of KwaZulu-Natal), which then holds it in trust on behalf of the people who use and occupy it, reform is possible, though politically fraught. Meanwhile, South Africa needs deliberate government support and leveraging of the private sector, including the determined implementation of the Agricultural and Agro-Processing Master Plan (AAMP) adopted by the Department of Agriculture, Land Reform and Rural Development (DALRRD) in 2022.
Another sector with significant economic and employment potential is tourism. South Africa is already an international tourist destination, and in 2023 the sector contributed 8.2% to GDP, more than mining, transport and construction. It employed 1.46 million people based on 8.5 million international tourist arrivals and 38 million domestic trips that year. Annual growth is robust, and with its natural beauty and vast open spaces, South Africa has much to offer and is now working to make visa access easier, improve safety for tourists, and invest in welcoming foreigners to the country. The 2024 GNU has now set a target to reach 15 million arrivals by 2030. Like other sectors, the Tourism Sector has many plans and strategies, including a Tourism Sector Masterplan and a National Tourism Sector Strategy, for 2016-2026.
Eventually, rapid growth, low-end manufacturing, and growth in tourism, mining, and agriculture will require additional measures to absorb unemployment, particularly by expanding the informal sector. In addition to public education, three critical actions are to:
- Amend municipal by-laws to allow expansion of informal activities and employment.
- Improve market access for informal enterprises.
- Prioritise regulatory reform to address regulatory barriers and exclusion for the informal economy.
South Africa needs to speed up the transition of its energy sector from coal to renewables. Solar, wind, biomass, other renewables, and geothermal must eventually become the core of the country’s energy strategy, utilising modern technology such as intelligent energy management whilst investing in energy storage. Still, given the current dependence on coal, it is set to remain an essential part of South Africa’s energy mix. The country already introduced a carbon tax in 2019. Still, more is required to create an environment that supports rapid decarbonisation and provides clear incentives for green investments, including subsidising green technologies and penalising carbon-intensive practices. The imperatives are particularly evident when considering the potential impact of the EU’s Carbon Border Adjustment Mechanism (CBAM). Projections released in 2024 indicate that tariffs on steel and iron exports could rise by 20%, and those on chemicals such as ammonia could reach 225%. Our analysis also indicates that the demand gap left by aggressive reductions in coal generation means the country needs gas, which emits less carbon than coal or oil, but is not ideal. To that end, the country should join the Global Methane Pledge, under which more than 100 countries have promised to reduce their methane emissions by 30% by 2030, as well as the Extractive Industries Transparency Initiative, which promotes open and accountable management of oil, gas, and minerals.
South Africa will not attract investment and confidence if it does not work much harder to ensure the rule of law and public safety. Politically, the need to improve state security planning and coordination has been most prominently identified by the November 2021 Report of the Expert Panel into the July 2021 Civil Unrest, which included a host of recommendations. Police reform, too, has been the subject of several commissions of enquiry. Recommendations include the need for location- and context-specific, violence-reduction strategies, a focus on intelligence-led investigations, the need to decentralise the large, top-heavy police service and to outsource or fix key functions such as forensics. The key impediment to the rule of law, however, is not technical but political. It derives from the extent to which the state has been criminalised (reflected in the findings of the Commission of Inquiry into State Capture, popularly known as the Zondo Commission). The June 2025 announcement by President Ramaphosa to work towards judicial independence is very important. More is required, particularly to provide the National Prosecuting Authority with the independence and resources to pursue criminals without fear or favour. Key appointments in the criminal justice cluster (and in the civil service and SOEs generally) need to be removed from potential political influence.
Finally, given its divisive history of oppression and exploitation, the lack of national coherence on national values and norms is a huge problem in South Africa, reflected in its ongoing racially determined politics and extreme levels of inequality. The country needs a government committed to an inclusive multi-racial vision and a forward-looking leadership ethos - a shift to a class-based rather than a race-based analysis that champions the cause of all poor and unemployed people (the vast majority of whom are black) and the advancement of investment and entrepreneurship while maintaining a focus on interventions that assist the previously disadvantaged groupings.
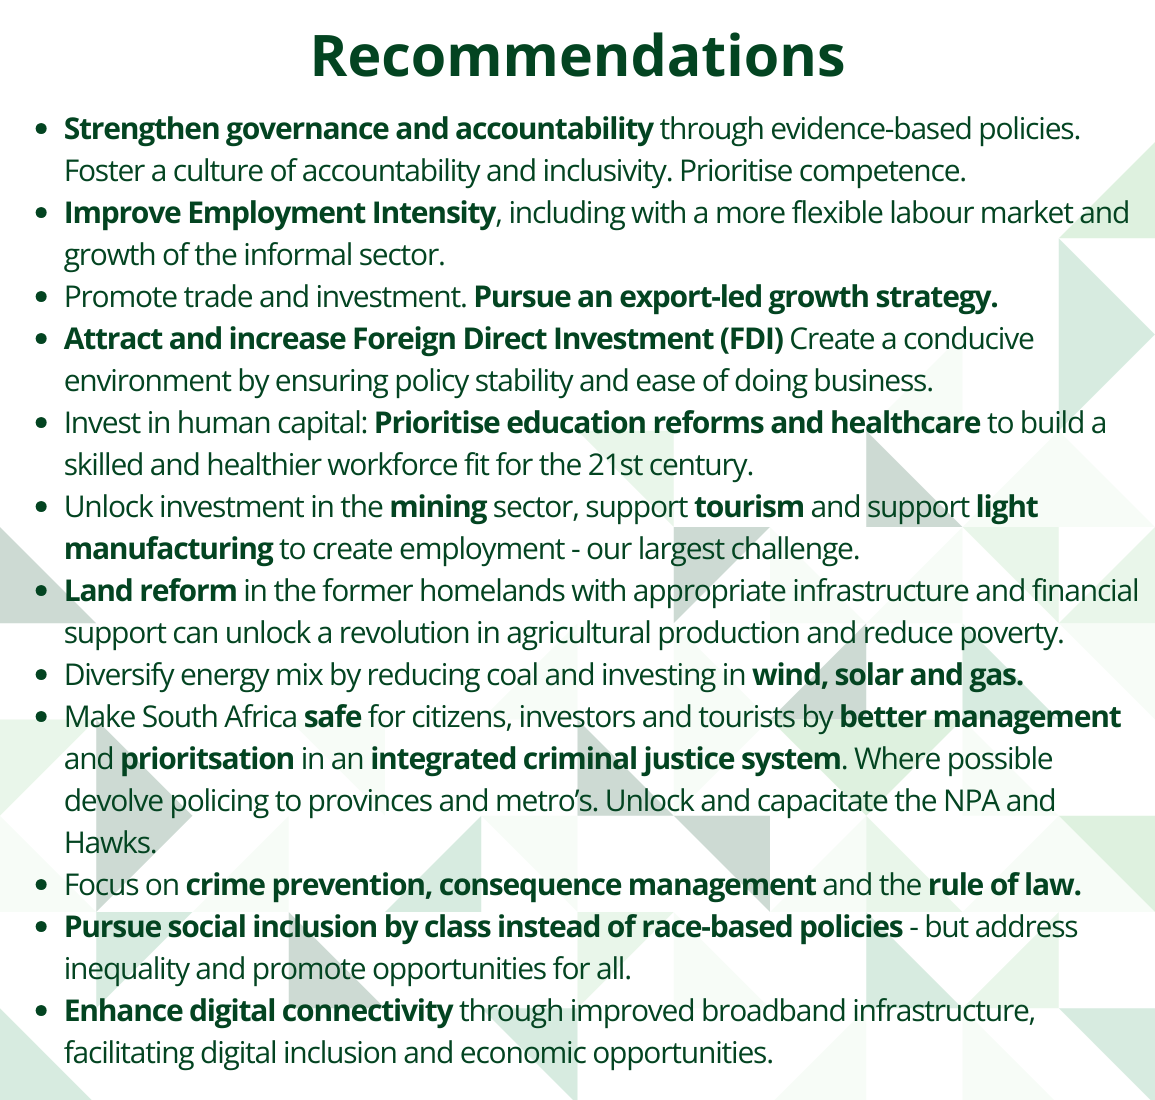
Page information
Contact at AFI team is Jakkie Cilliers and Alize le Roux
This entry was last updated on 15 March 2026 using IFs v8.38.
Donors and sponsors


Reuse our work
- All visualizations, data, and text produced by African Futures are completely open access under the Creative Commons BY license. You have the permission to use, distribute, and reproduce these in any medium, provided the source and authors are credited.
- The data produced by third parties and made available by African Futures is subject to the license terms from the original third-party authors. We will always indicate the original source of the data in our documentation, so you should always check the license of any such third-party data before use and redistribution.
- All of our charts can be embedded in any site.
Cite this research
Jakkie Cilliers and Alize le Roux (2026) South Africa. Published online at futures.issafrica.org. Retrieved from https://futures.issafrica.org/geographic/countries/south-africa/ [Online Resource] Updated 15 March 2026.