 Ethiopia
Feedback welcome
Our aim is to use the best data to inform our analysis. See our Technical page for information on the IFs forecasting platform. We appreciate your help and references for improvements via our feedback form.
This page explores Ethiopia's current and projected future development, examining various sectoral scenarios and their potential impacts on the country's growth. It explores eight individual sectoral scenarios that include education, governance, health and demographic, trade and infrastructure-related outcomes, and combines the impact of these eight scenarios for Ethiopia up to 2043 - the end of the third ten-year implementation plan for the African Union Agenda 2063. The analysis offers insights into policy actions that could enhance Ethiopia's developmental trajectory.
For more information about the International Futures modelling platform we use to develop the various scenarios, please see About this Site.
Summary
We begin this page with an introductory assessment of the country’s context by looking at current population distribution, social structure, climate and topography.
- Ethiopia is Africa’s oldest independent country, located in the Horn of Africa region. It was colonised by Italy from 1936 to 1941. It is landlocked and the second-largest country (after Nigeria) in terms of population size, with a population of 128.7 million, with a median age of about 19 years and a fertility rate of around 4 births per woman in 2023. It has a highly diverse population distribution influenced by factors such as geography, ethnicity and socio-economic conditions. The country is home to 94 cities and over 80 ethnic groups, each maintaining its distinct customs and traditions. Nearly 80% of its population lives in rural areas, where the traditional lifestyle dominates, characterised by limited access to healthcare, education and strong dependence on subsistence farming.
- For the past two decades, Ethiopia has experienced one of the highest economic growth rates in Africa and continues to grow fast. In 2023, Ethiopia's GDP grew 7.2%, surpassing Africa’s average of 5%. Despite this sustained growth, Ethiopia remains one of the poorest countries in the world, with a GDP per capita of US$2 381 (at PPP) in 2022. According to the World Bank income classification, Ethiopia is a low-income country. The country faces major macroeconomic obstacles, including an overvalued currency, growing import bills and depleted foreign exchange reserves. The inflation rate has been high, rising to more than 30% in 2023.
The next section compares progress on the Current Path with eight sectoral scenarios . These are Demographics and Health; Agriculture; Education; Manufacturing; the African Continental Free Trade Area (AfCFTA); Large Infrastructure and Leapfrogging; Financial Flows; and Governance. Each scenario is benchmarked to present an ambitious but reasonable aspiration in that sector.
- The implementation of the Demographics and Health scenario will accelerate the demographic transition in Ethiopia. In the scenario, the ratio of the working-age population to dependants will be at 1.7:1 by 2041 at which point the country will enter a potential demographic window of opportunity, provided other supporting conditions are in place. On the Current Path, this minimum ratio will only be achieved in 2043.
- In the Agriculture scenario, crop production will increase by 38.5% compared with the Current Path in 2043. This will create a surplus of 8.6% of total demand in 2043 compared to a deficit (import dependency) of 22.8% in the Current Path in the same year.
- The implementation of the Education scenario would improve the mean years of education for adults aged 15 to 24 in the country to 8.7 years by 2043 compared with 7.9 years in the Current Path.
- Manufacturing forms only a small part of the economy. The implementation of the Manufacturing scenario will increase the share of the manufacturing sector as a percentage of GDP to 20% by 2043 relative to 18.2% in Current Path in the same year.
- Ethiopia's trade pattern resembles that of many other African nations, characterised by dependence on a limited range of key commodity exports while importing higher-value manufactured goods. Consequently, the country’s trade balance is structurally in deficit— a trend which is likely to persist until 2042. On the Current Path, the trade balance will likely be a surplus equivalent to 0.1% of GDP by 2043. In the AfCFTA scenario, Ethiopia will record a trade surplus equivalent to one percent of GDP by 2043.
- Despite its significant hydropower potential, Ethiopia ranked 32nd out of 48 sub-Saharan African countries for electricity access deficit in 2023. Limited electricity access, especially in rural areas of Ethiopia, forces most households to rely on inefficient energy sources for cooking. Approximately 85% of the population depends on traditional biomass, such as fuelwood and animal dung. In the Large Infrastructure and Leapfrogging scenario, the percentage of households that use traditional cookstoves will be 31.8%, while the share of households using modern cookstoves will be 67.3% by 2043, compared to the Current Path of 53.1% in the same year.
- Despite the effects of recent global crises on foreign aid, Ethiopia remains heavily reliant on external assistance to finance essential services such as education and healthcare. In the Financial Flows scenario, government revenue increases to reach 17.1% of GDP by 2043. This will be 0.2 percentage points of GDP above the Current Path in 2043.
- Ethiopia's development has been hampered by poor governance, pervasive corruption and a deeply conflict-affected society. Major international governance indicators highlight the persistence of widespread and deeply rooted corruption. In the Governance Scenario, the overall governance performance of Ethiopia will be 26.7% higher than the Current Path by 2043.
In the third section, we compare the impact of each of these eight sectoral scenarios with one another and subsequently with a Combined scenario (the integrated effect of all eight scenarios). In our forecasts, we measure progress on various dimensions such as economic size (in market exchange rates), gross domestic product per capita (in purchasing power parity), extreme poverty, carbon emissions, the changes in the structure of the economy, and selected sectoral dimensions such as progress with mean years of education, life expectancy, the Gini coefficient or reductions in mortality rates.
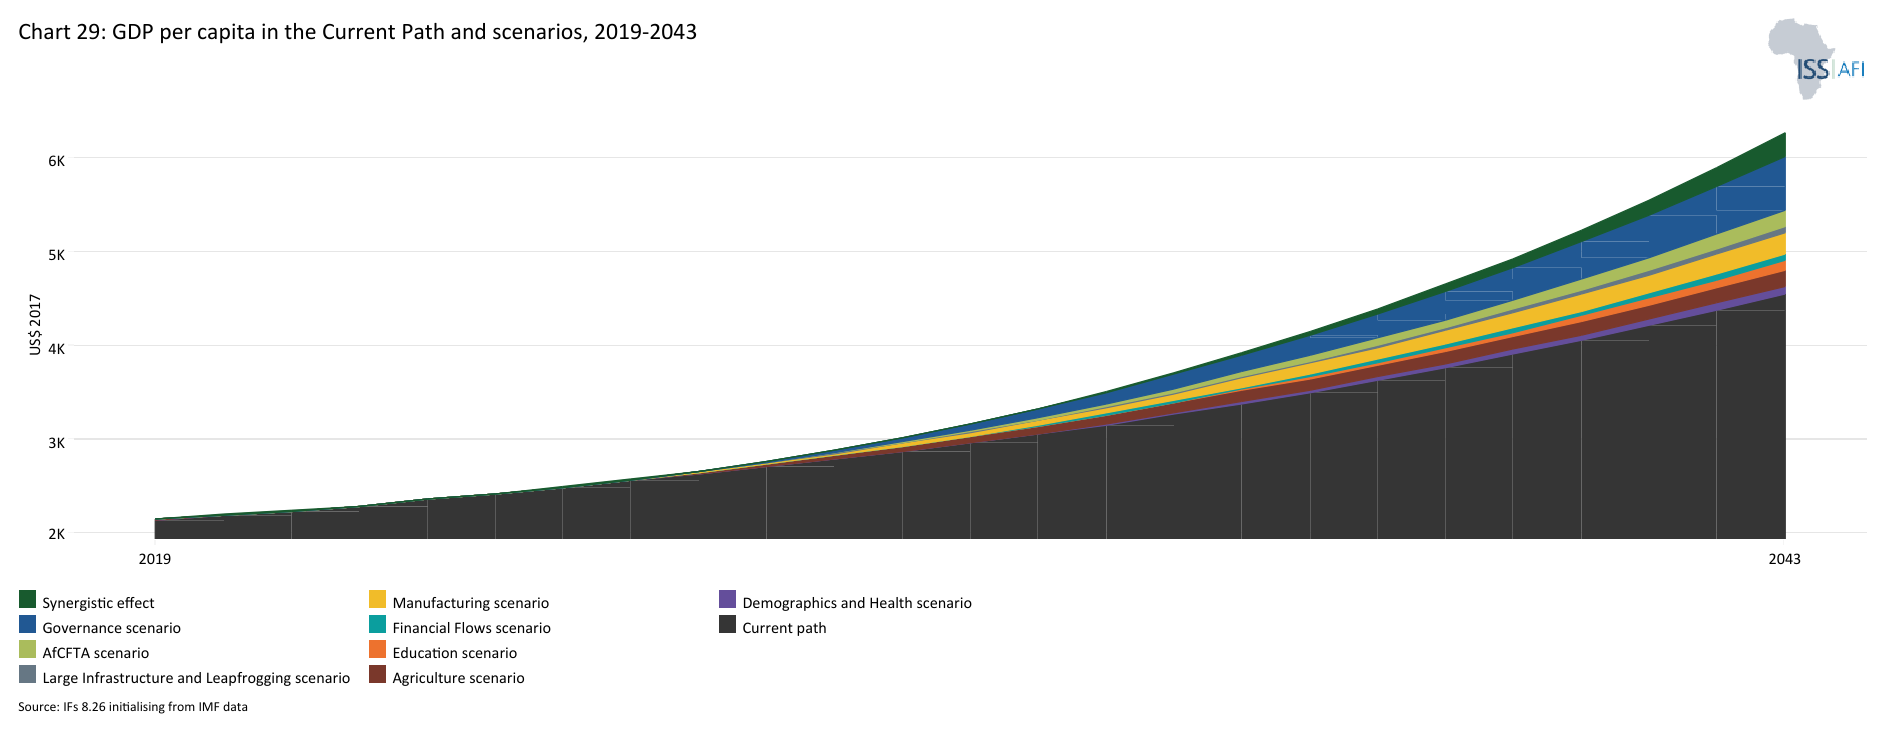
- The Combined scenario has a much greater impact on GDP per capita than the individual thematic scenarios. By 2043, Ethiopia's GDP per capita (PPP) will be US$6 266 which is US$1 714 larger than in the Current Path. Among the sectoral scenarios, the Governance scenario will have the most significantly positive impact on the GDP per capita, followed by Manufacturing, the AfCFTA, and the Agriculture scenarios.
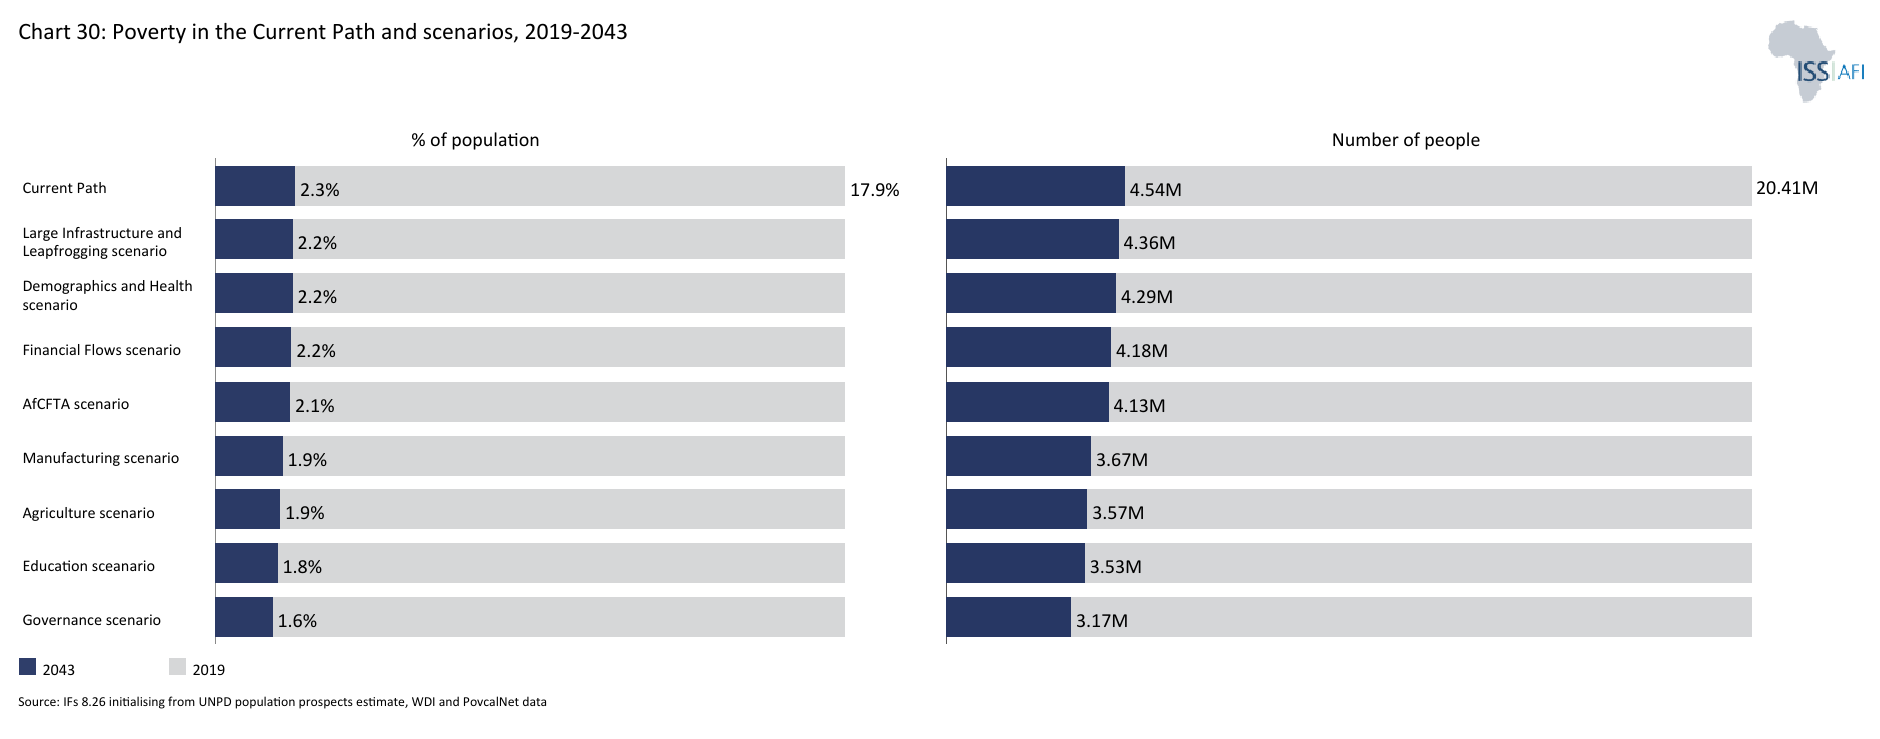
- All the sectoral scenarios contribute to poverty reduction in Ethiopia; however, the Governance scenario contributes most significantly to reducing the extreme poverty rate by 2043, followed by the Education, Agriculture and Manufacturing scenarios. In the Combined scenario, by 2043, the extreme poverty rate at the US$2.15 poverty threshold will decline to roughly 0.4% (853 000 people) compared to 2.9% (4.5 million people) in the Current Path.
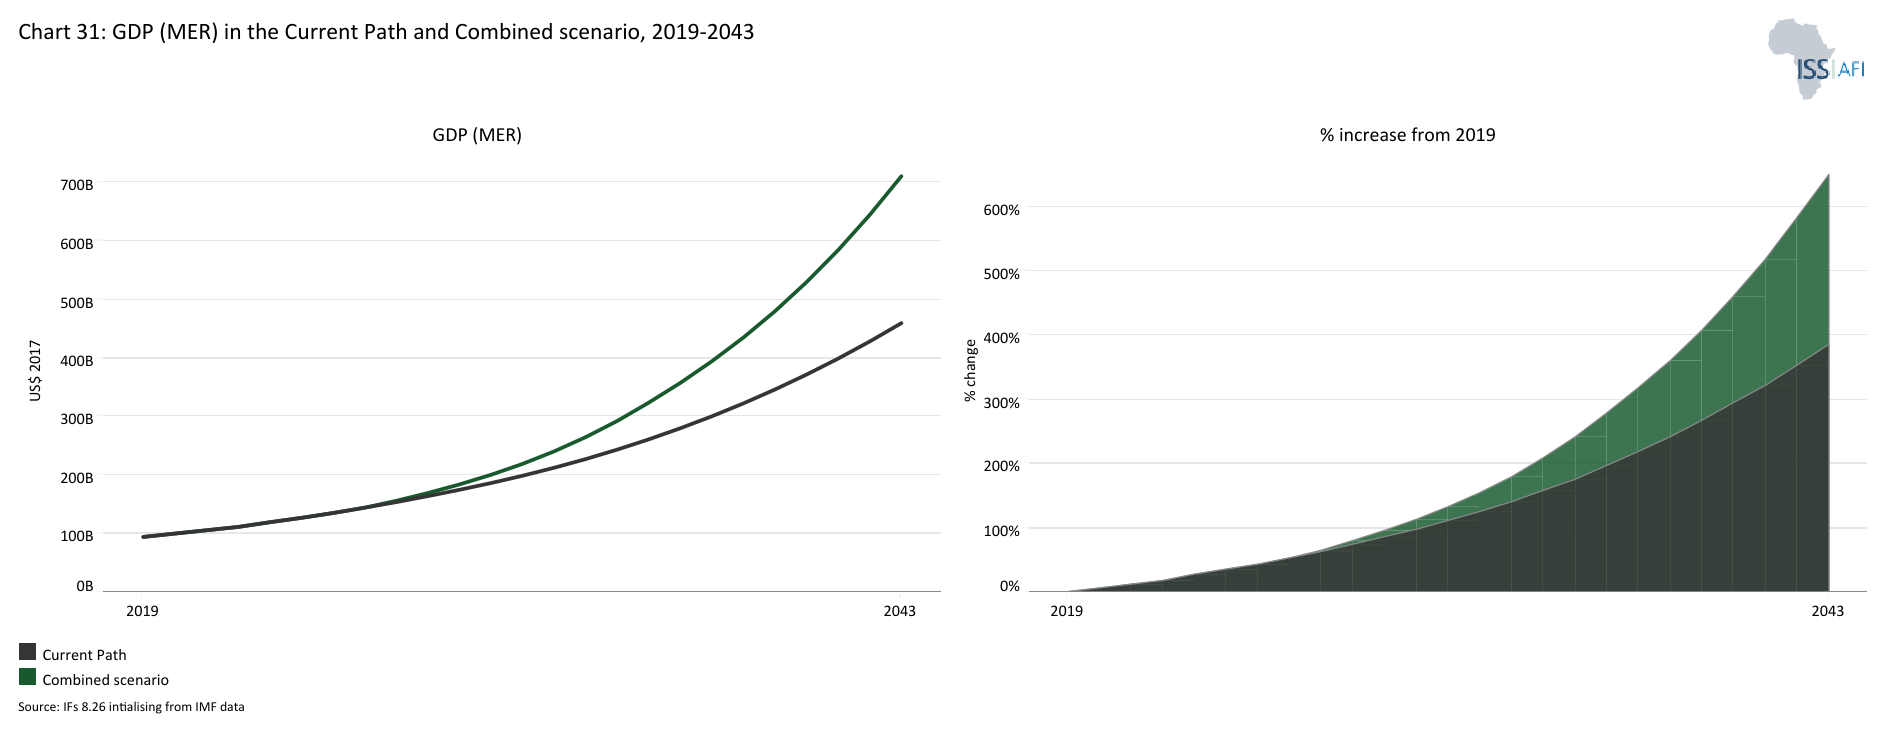
- The Combined scenario significantly improves Ethiopia’s growth prospects. In this scenario, the size of the Ethiopian economy measured in GDP at the market exchange rate (MER) is US$251 billion larger than the Current Path in 2043.
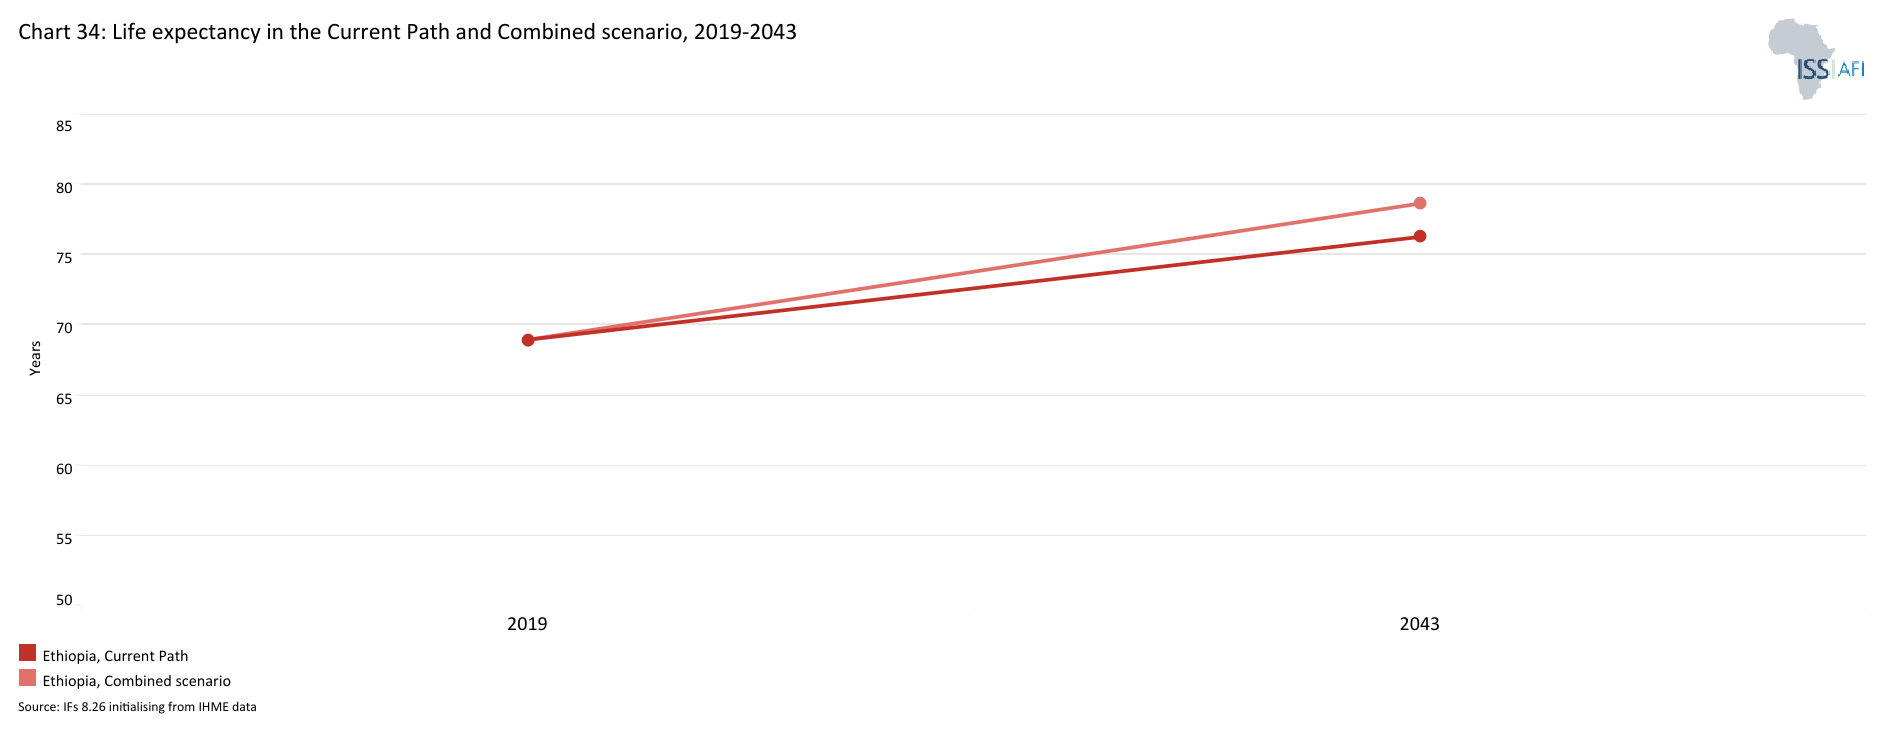
- In the Combined scenario, the average Ethiopia could expect to live 2.4 years longer at 78.7 years, compared with the projected 76.3 years on the Current Path by 2043.
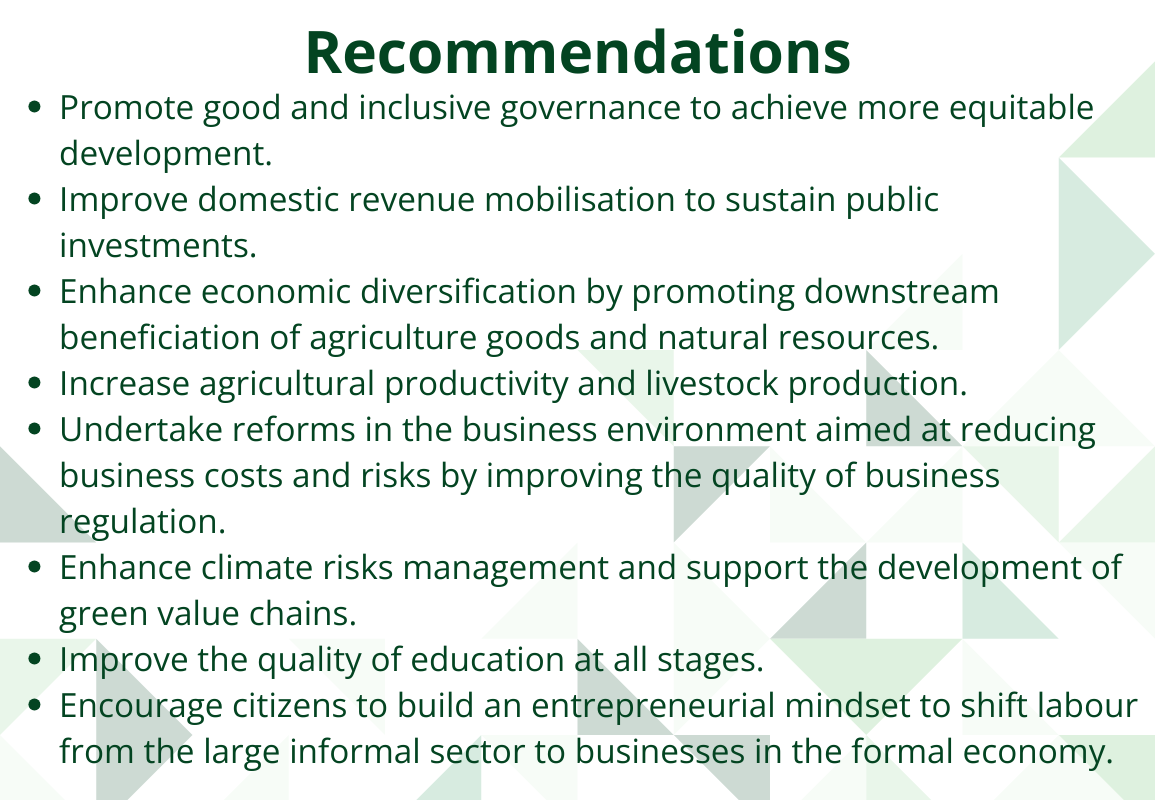
We end this page with a summarising conclusion offering key recommendations for decision-making. Ethiopia's main growth constraints include insecurity, overreliance on agriculture exports, climate change and variability, low agricultural productivity, weak governance and poor business environment, infrastructure shortage and limited human capital. To stimulate inclusive economic growth and development, the government should prioritise policy reforms and investments that improve governance, address infrastructure shortage, and facilitate private sector development and agricultural productivity. The country also needs to build quality human capital stock and diversify the economy away from agriculture.
All charts for Ethiopia
- Chart 1: Political map of Ethiopia
- Chart 2: Population structure in the Current Path, 1990–2043
- Chart 3: Population distribution map, 2023
- Chart 4: Urban and rural population in the Current Path, 1990-2043
- Chart 5: GDP (MER) and growth rate in the Current Path, 1990–2043
- Chart 6: Size of the informal economy in the Current Path, 2023-2043
- Chart 7: GDP per capita in Current Path, 1990–2043
- Chart 8: Extreme poverty in the Current Path, 2023–2043
- Chart 9: National Development Plan of Ethiopia
- Chart 10: Relationship between Current Path forecast and scenario
- Chart 11: Mortality distribution in the Current Path, 2023-2043
- Chart 12: Infant mortality rate in Current Path and Demographics and Health scenario, 2023–2043
- Chart 13: Demographic dividend in the Current Path and the Demographics and Health scenario, 2023–2043
- Chart 14: Crop production and demand in the Current Path, 1990-2043
- Chart 15: Import dependence in the Current Path and Agriculture scenario, 2023–2043
- Chart 16: Progress through education funnel in the Current Path, 2023 v-2043
- Chart 17: Mean years of education in the Current Path and Education scenario, 2023–2043 15 to 24 age group
- Chart 18: Value-add by sector as % of GDP in the Current Path, 2023-2043
- Chart 19: Value-add of the manufacturing sector in the Current Path and Manufacturing scenario, 2023–2043
- Chart 20: Exports and imports as % of GDP in the Current Path, 2000-2043
- Chart 21: Trade balance in the Current Path and AfCFTA scenario, 2023–2043
- Chart 22: Electricity access: urban, rural and total in the Current Path, 2000-2043
- Chart 23: Cookstove usage in the Current Path and Large Infra/Leapfrogging scenario, 2023–2043
- Chart 24: Access to mobile and fixed broadband in the Current Path and the Large Infra/Leapfrogging scenario, 2023–2043
- Chart 25: FDI, foreign aid and remittances as % of GDP in the Current Path, 1990-2043
- Chart 26: Government revenue in the Current Path and Financial Flows scenario, 2023–2043
- Chart 27: Government Effectiveness score in the Current Path, 2002-2043
- Chart 28: Composite governance index in the Current Path vs Governance scenario, 2023–2043
- Chart 29: GDP per capita in the Current Path and scenarios, 2023–2043
- Chart 30: Poverty in the Current Path and scenarios, 2023–2043
- Chart 31: GDP (MER) in the Current Path and Combined scenario, 2023–2043
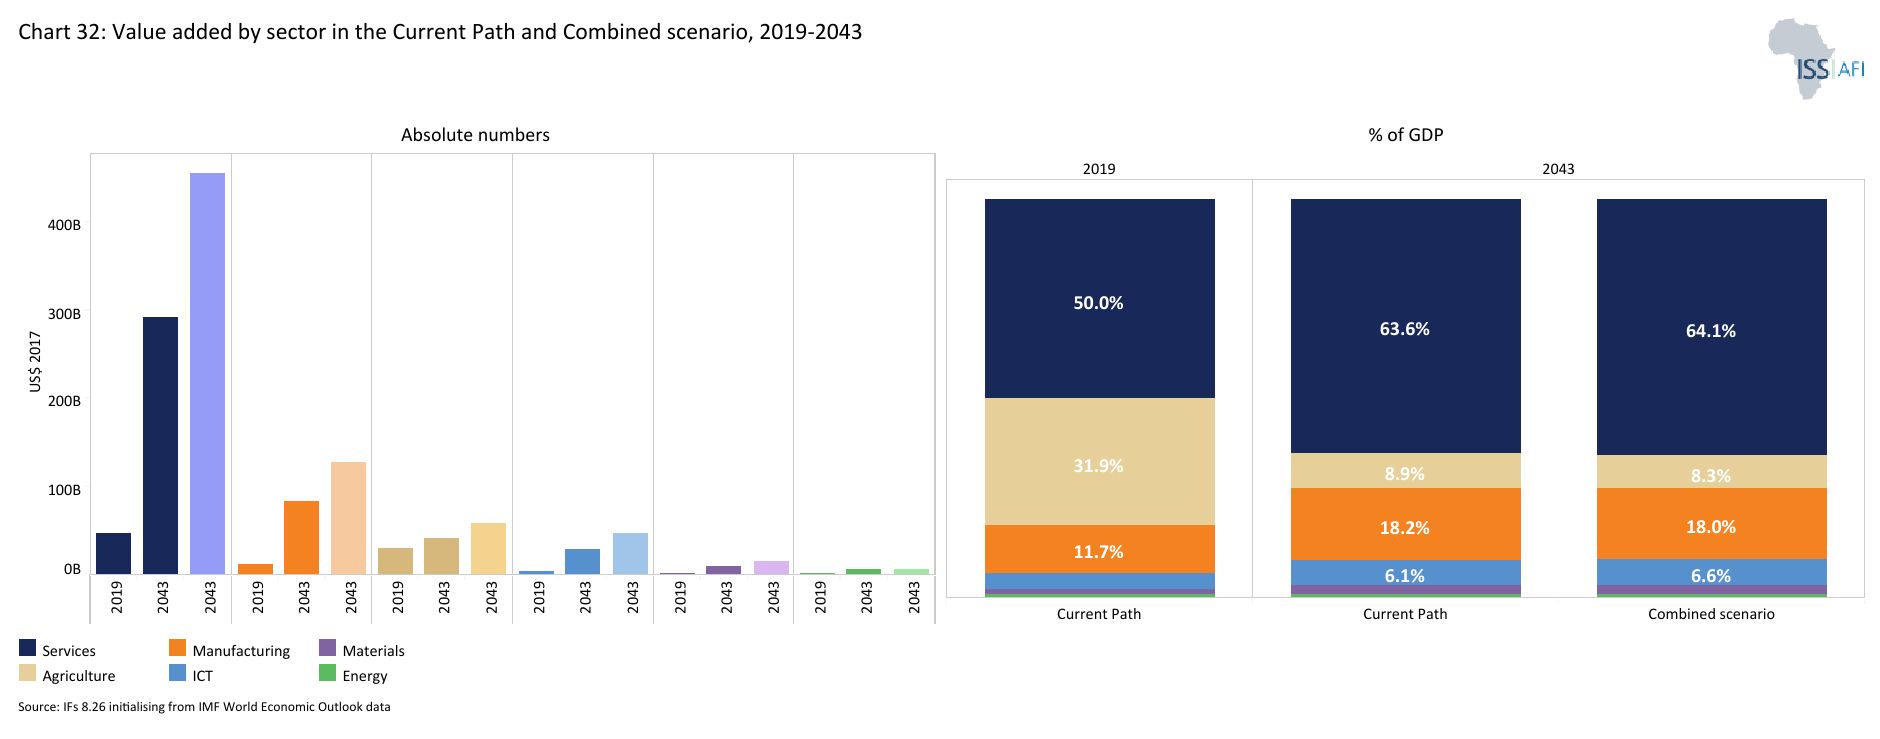
- Chart 32: Value added by sector in the Current Path and Combined scenario, 2023–2043
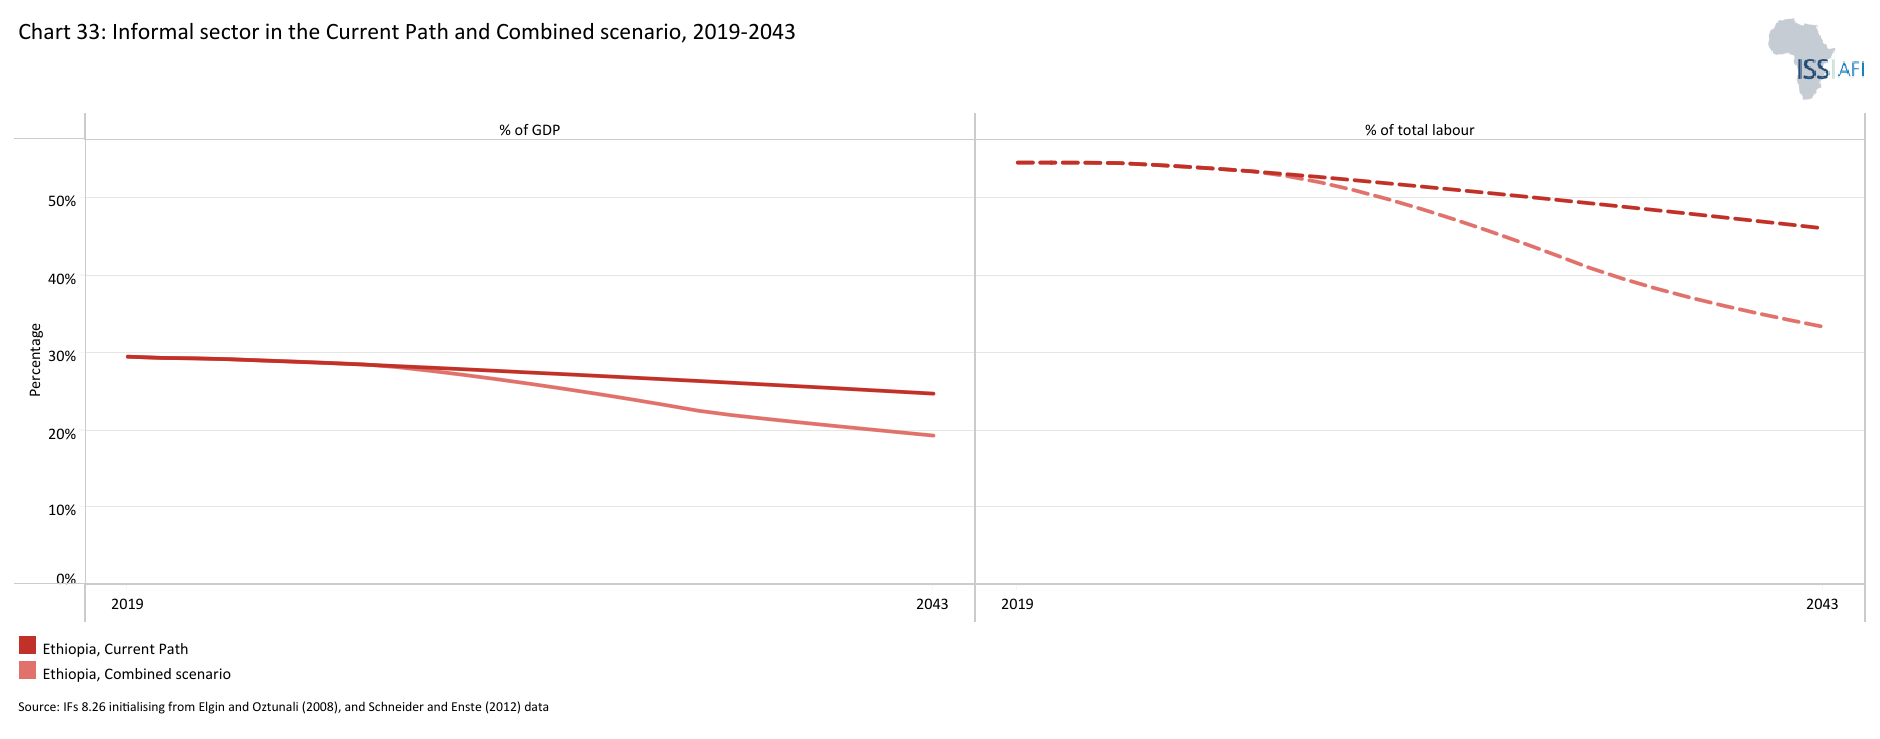
- Chart 33: Informal sector in the Current Path and Combined scenario, 2023–2043
- Chart 34: Life expectancy in the Current Path and Combined scenario, 2023–2043
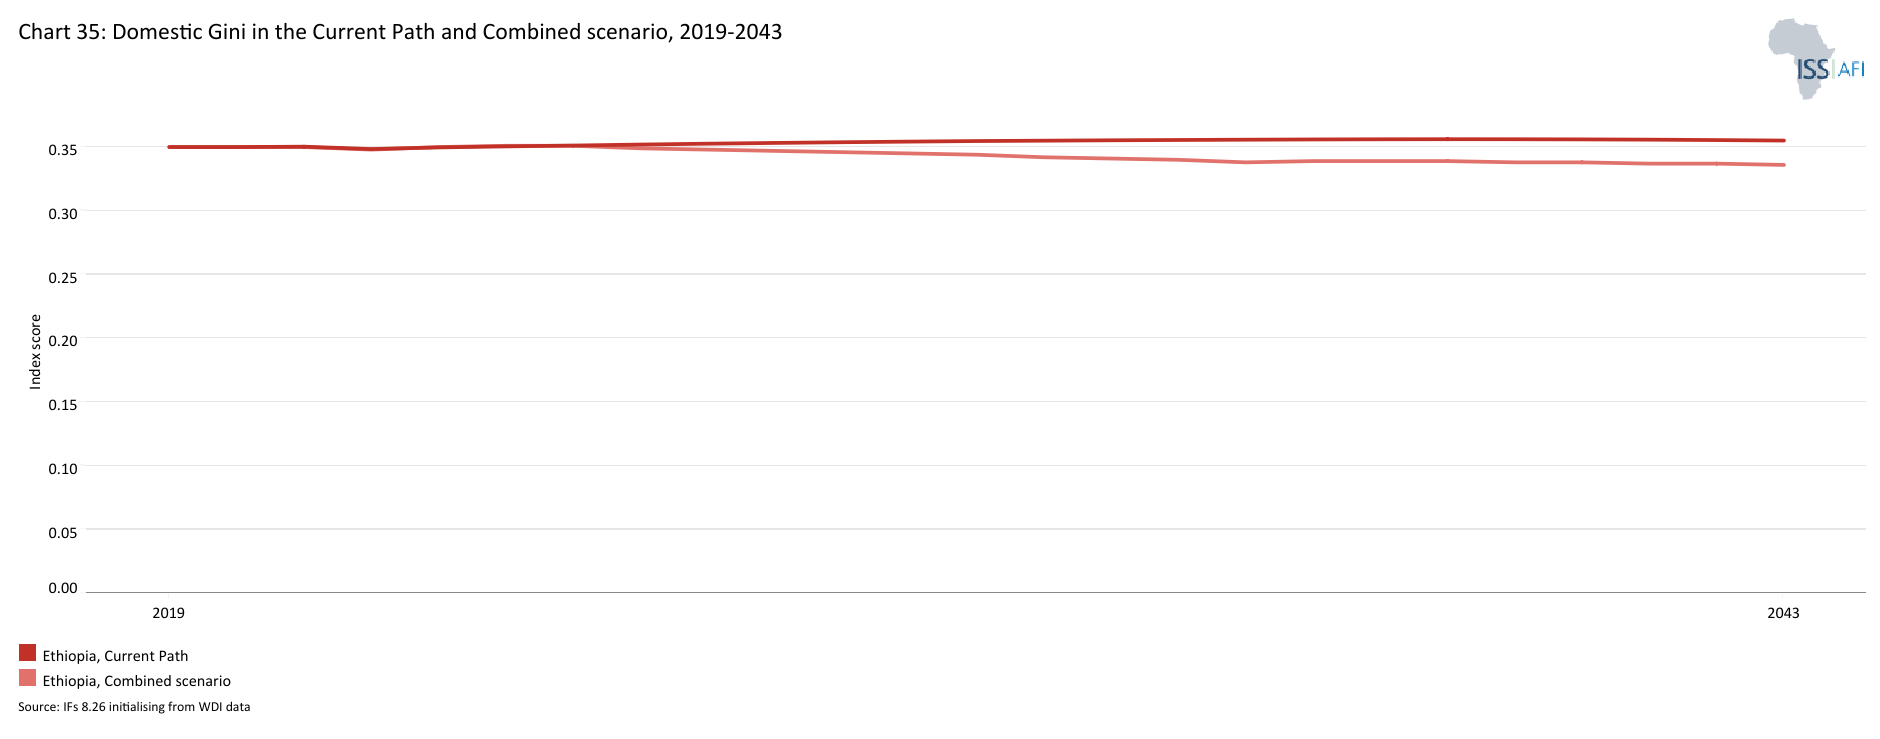
- Chart 35: Domestic Gini in the Current Path and Combined scenario, 2023–2043
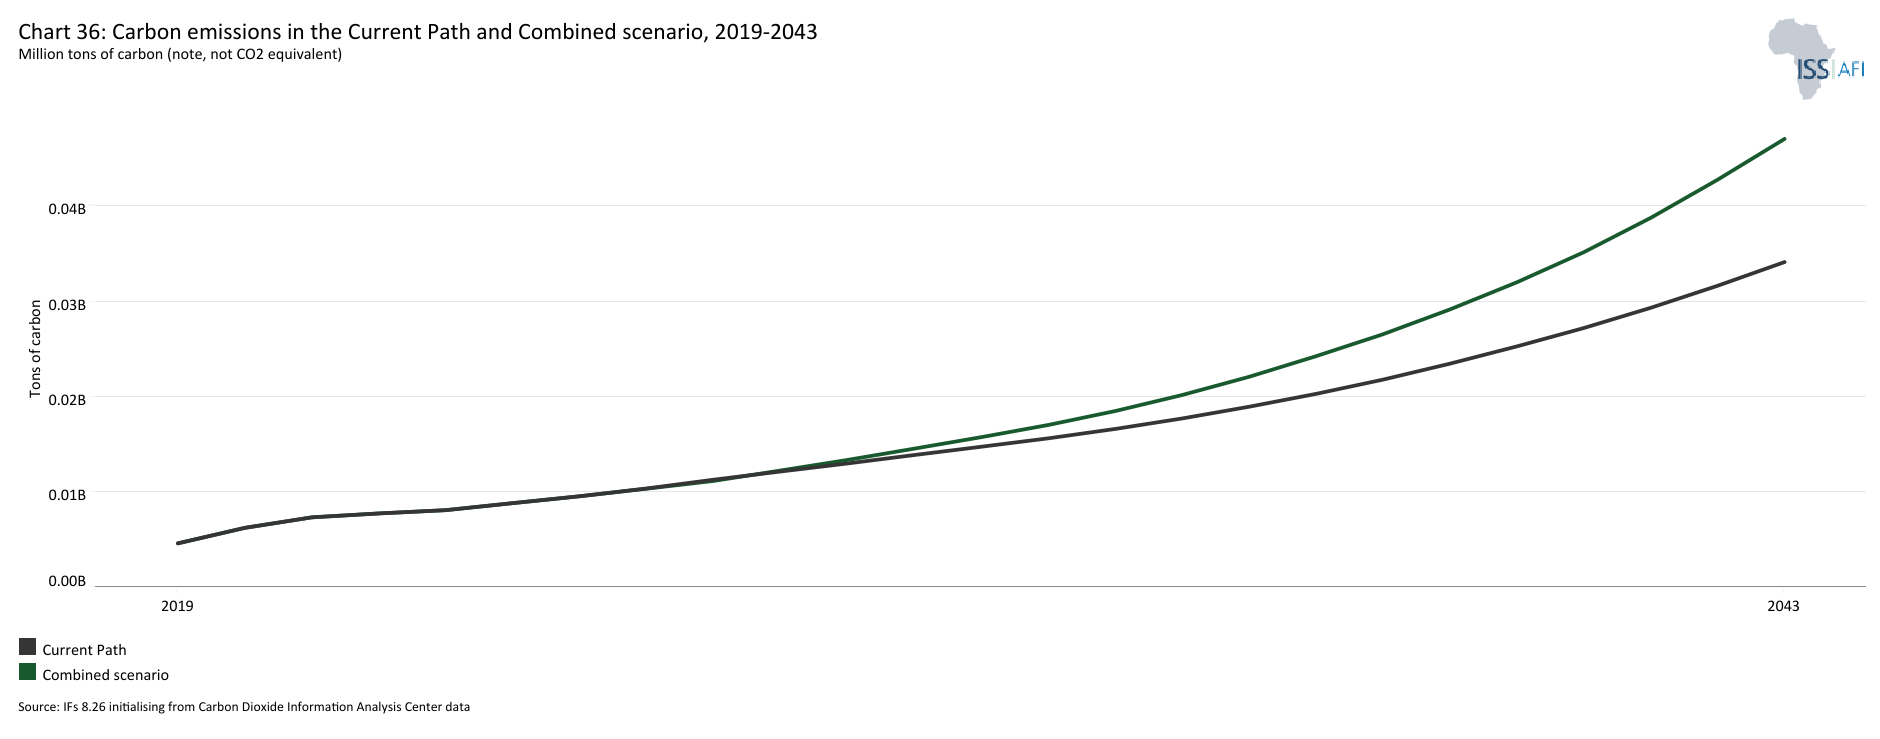
- Chart 36: Carbon emissions in the Current Path and Combined scenario, 2023–2043
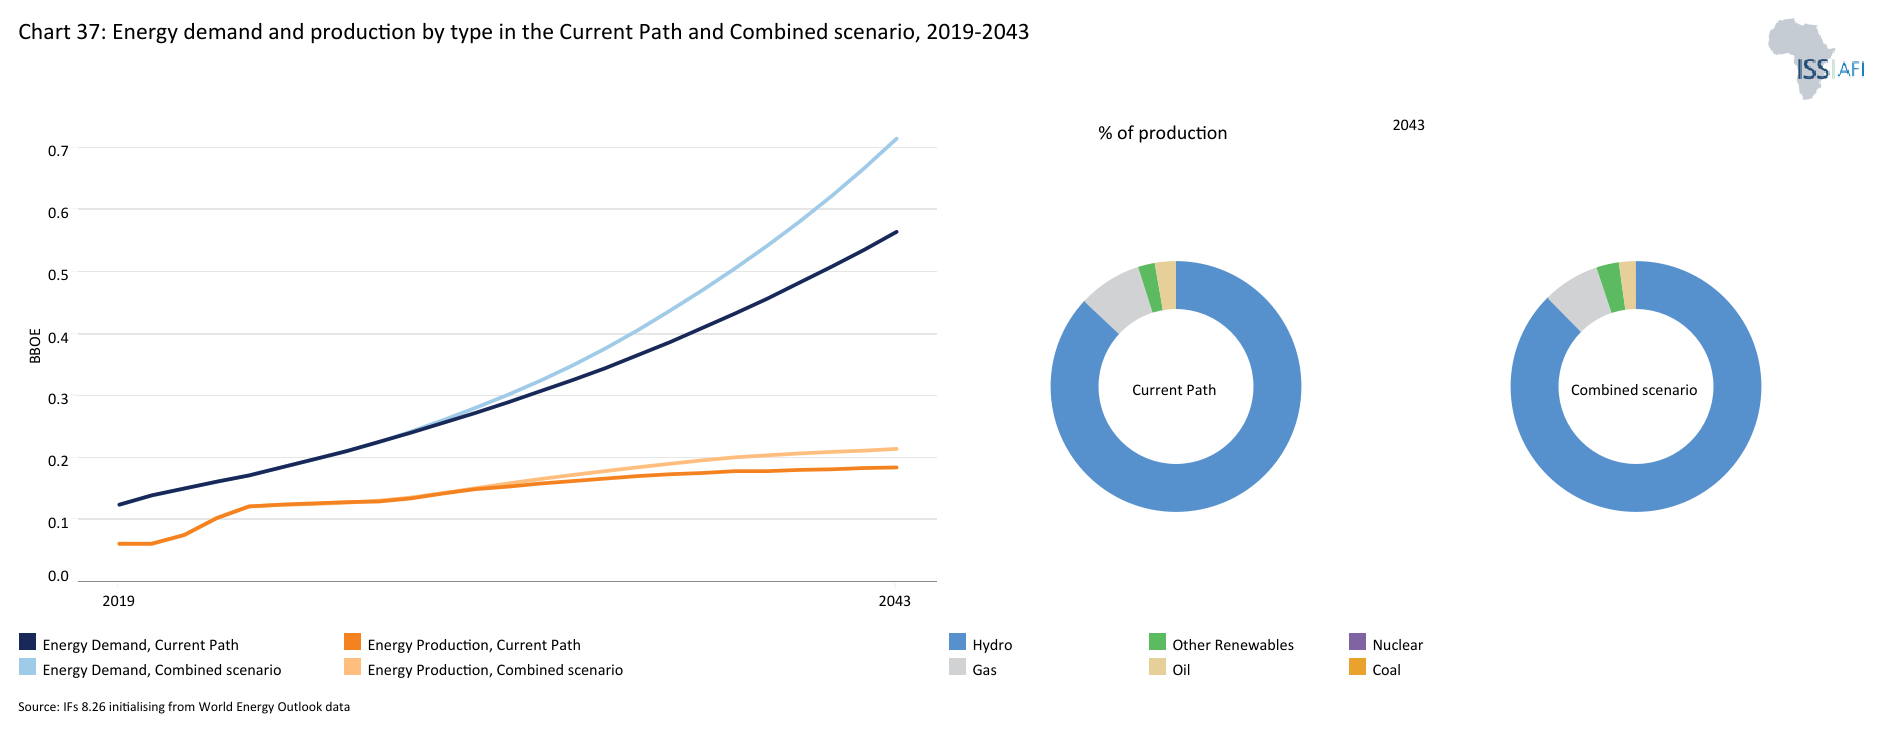
- Chart 37: Energy demand and production by type in the Current Path forecast and Combined scenario, 2023-2043
- Chart 38: Policy recommendations
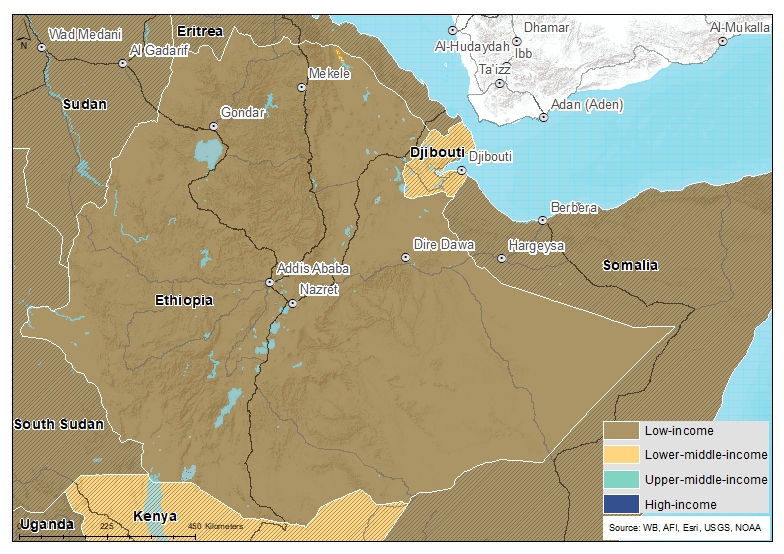
Chart 1 is a political map of Ethiopia.
Ethiopia is a low-income country located in the northeast of Africa, in the area known as the Horn of Africa. It is bordered by Eritrea to the north and northeast, Djibouti and Somalia to the east, Sudan and South Sudan to the west, and Kenya to the South. Its proximity to the Middle East and Europe, together with its easy access to the major ports of the Horn of Africa, enhances its international trade. With the secession of Eritrea in 1993, its former province along the Red Sea, Ethiopia became a landlocked country. It is a member of the Common Market for Eastern and Southern Africa (COMESA), the Intergovernmental Authority on Development (IGAD), and a participant in the recently begun Tripartite Free Trade Area (TFTA).
It is the largest country in the Horn of Africa (Djibouti, Eritrea, Ethiopia, Kenya, Somalia, Sudan, South Sudan and Uganda) and the 10th in Africa in terms of land mass, occupying a total land area of 1 136 240km². Its geography features rugged mountains, flat-topped plateaus, deep river canyons, rolling plains and lowlands. The Ethiopian highlands are divided by the Great Rift Valley, which starts in Palestine and runs down the Red Sea. Ethiopia has a diverse topography, which results in different climates and precipitation across its regions. Ethiopia’s climate is typically tropical in the south-eastern and north-eastern lowland regions but much cooler in the large central highland regions of the country. The mean annual temperatures are around 15-20°C in the high-altitude regions and around 25-30°C in the lowlands. The country's mean annual temperatures are forecast to increase by around 0.44-1.47°C by 2030.
The country has three annual rainfall seasons: 1) Kiremt - the main rainy season, which occurs from mid-June to mid-September and accounts for 50-80% of the annual rainfall; 2) Belg – less rainfall which occurs from February to May; and 3) Bega – dry season rainfall which has colder conditions and occurs from October to December. The increase in Bega rainfall would increase crop harvest loss. Hence early planting dates and identifying short-maturing crops during the Kiremt are some of the climate adaptation strategies. The mean annual rainfall is estimated at around 2 000mm in the south-western highlands and less than 300mm in the south-eastern and the north-eastern lowlands.
Ethiopia is the only African country with its own Alphabet letters and numbers that date back to ancient times but ethnically diverse with between 45 and 86 spoken languages. Amharic is the official language and a widely used lingua franca. Oromo is spoken by over a third of the population as their main language and is the most widely spoken primary language. Tigrinya is the primary language for over 95% of the population in Tigray, and Afar is the primary language for over 89% of the population of the Afar region. The country’s religious landscape is richly diverse, shaped by a long history, varied cultural influences and deep spiritual traditions. The primary religions practised in Ethiopia are Christianity (with Ethiopian Orthodox Christianity being the most prominent), Islam, and indigenous African religions. Additionally, there are smaller communities of other faiths, including protestant Christianity and Judaism.
It is Africa’s oldest independent country, liberated from a five-year occupation by Italy in 1941, through a combined effort of Ethiopian resistance fighters (known as the Arbegnoch Patriots) and allied forces, particularly from the British army. It derived prestige from its uniquely successful military resistance during the late 19th century Scramble for Africa, becoming the first African country to defeat a European colonial power and retain its sovereignty. It is among the first African independent nations to sign the Charter of the United Nations, and it gave moral and material support to the decolonisation of Africa and to the growth of Pan-African cooperation. These efforts culminated in the establishment of the Organization of African Unity in 1963 (the African Union, since 2002) and the United Nations Economic Commission for Africa (UNECA), both of which have their headquarters in Addis Ababa – the largest and capital city of Ethiopia, with Dire Dawa and Mek’ele being the second- and third-largest cities. The country has a total of 94 cities and more than 80 ethnic groups, each preserving its own unique customs and traditions.
Ethiopia’s political landscape is complex and deeply rooted in its historical, ethnic and socio-economic dynamics. The country is governed under a federal system (a system of government where power is shared between a central authority and smaller regional governments) based on ethnic identities, established by the 1995 constitution. Disputes over resources, land and political power often lead to violence and civil conflicts.
A clash between government forces and the Tigray People’s Liberation Front (TPLF) has had devastating effects. Although a peace agreement was reached between the federal government and the TPLF in November 2022, the rising insurgency in Oromia has further strained the country's stability. Despite these challenges, national elections in 2021 were conducted relatively peacefully, leading to a significant victory for the ruling Prosperity Party.
Classified as a terrorist organisation, the Oromo Liberation Army (OLA) (the largest ethnic group) has been engaged in numerous clashes with the Ethiopian government forces throughout 2024. In April 2024, the OLA forces clashed with the country’s troops, which resulted in heavy casualties among government forces. The clash escalated to South Oromia’s Guji Zone and other regions around October 2024, where local security forces suffered losses. Peace talks between the government and the OLA have occurred multiple times but have not yet resulted in a formal peace agreement.
Chart 2 presents the Current Path of the population structure, from 2019 to 2043.
The characteristics of a country's population can shape its long-term social, economic and political foundations; thus, understanding a nation's demographic profile indicates its development prospects.
Ethiopia’s population structure is characterised by a youthful demographic—with an estimated median age of 19.9 in 2023. As of 2023, about 39% of the country’s population was under 15 years of age. With this youthful population structure, Ethiopia’s dependency ratio is high, as a large portion of the population depends on a small workforce to provide for its needs.
When the ratio of the working-age population (15-64 years of age) to dependants (children and elderly) is 1.7 or higher, countries often experience more rapid growth, known as the demographic dividend, provided the workforce is appropriately skilled and absorbed in the labour market. In 2023, Ethiopia’s ratio was at 1.4 working-age persons to every dependant. In the Current Path, Ethiopia is likely to enter a potential demographic window of opportunity as from 2043 – the end of the 3rd 10-year implementation plan for the Africa Union (AU) Agenda 2063.
Ethiopia’s population grew rapidly at an average of about 2.8% per year from 2019 to 2023. It is the most populated country in the Horn of Africa and the second most populous country on the African continent after Nigeria. In 2023, its population was estimated at 127.3 million, about 60.5% of the Horn of Africa’s and 8.7% of the continent’s total population.
The country’s rapidly growing and youthful population presents both opportunities and challenges. Currently, the country is faced with challenges related to poverty, healthcare and education. In the Current Path, its population will reach 152.2 million by 2030 and 198.5 million by 2043.
Ethiopia also has a large youth bulge at 48.3% in 2023 – defined as the percentage of the population between 15 and 29 years of age relative to the population older than 15 years. In addition to the requirement for more spending on education, health services, and job creation, a large number of young adults can lead to positive political change in a country through youth activism, but they can also carry the seeds for socio-political instability in the absence of economic opportunities. Ethiopia’s youth bulge will decline to 40% by 2043.
The country has a high fertility rate, with an average estimate of 4.1 births per woman in 2023, nearly 16% below the average birth rate for low-income countries. Ethiopia’s fertility rate has declined from an average of 7.3 births per woman in the 1980s due to increased access to family planning and education. In 2019, the Ethiopia Mini Demographic and Health Survey (EMDHS) indicated that the prevalence of modern contraceptive use among married women increased from 14% in 2005 to 41% in 2019. With 96% of married women aged 15-49 years knowing at least one method of contraception. On the Current Path, Ethiopia’s fertility rate will continue declining, to about 2.7 births per woman by 2043.
The increase in contraceptive use is associated with improvements in maternal and child health outcomes, including a reduction in maternal mortality rates. Infant and maternal mortality rates in Ethiopia have declined significantly, reflecting improvement in healthcare - the rates have declined below the continent’s averages. Infant mortality has declined from 75.2 deaths per 1 000 live births to 38.8 in 2019 and was estimated at 32.7 in 2023. Maternal mortality has declined from 880 deaths per 100 000 live births in 2005 to 294 in 2019 and was estimated at 230.4 deaths per 100 000 live births in 2023. In the Current Path, infant and maternal rates will reach 13 deaths per 1 000 and 69.5 deaths per 100 000 live births, respectively, by 2043.
With improvements in maternal and child healthcare, Ethiopia’s median population will increase to 24.5 years, while its population share of under 15 years of age decreases to 31.6% by 2043. The share of elderly will increase to 5.1% in 2043 from 3.3% in 2023.
The country’s life expectancy has been rising, with the 2023 figures around 67.7 years for men (from 56.3 years in 2005) and 72.5 years for women (from 58.1 years in 2005), and an average of about 70.6 years for both - 3.2 years above Africa’s average. In the Current Path, Ethiopia’s life expectancy will increase to 76.3 years (74.3 years for men and 78.3 for women) by 2043.
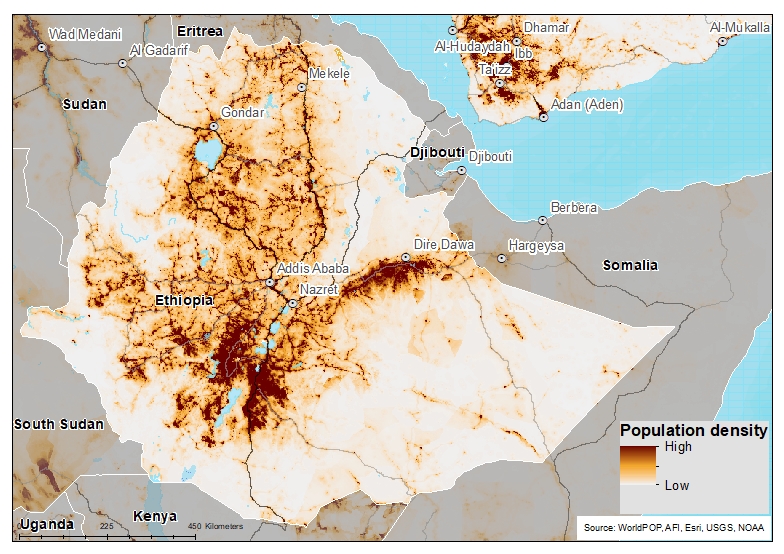
Chart 3 presents a population distribution map for 2023.
Ethiopia's population distribution is closely linked to its physical geography, climate and economic activities. The lowland regions, such as Somali, Afar and Benishangu-Gumuz in the eastern and southeastern regions, are characterised by lower population densities. These areas are more arid and not suitable for agriculture as they experience little rainfall.
The highland regions have the highest population densities. These include cities such as Addis Ababa, Amhara and Oromia. These areas have more favourable climates, better access to water, more fertile land, and more economic activities than the lowland regions. However, the majority of Ethiopians still reside in rural areas where population density can vary significantly depending on the suitability of land for farming.
Chart 4 presents the urban and rural population in the Current Path, from 1990 to 2043.
Urbanisation in Ethiopia is amongst the most rapid in Africa, although it is one of the least-urbanised countries historically. Ethiopia's urban population has been growing by more than 2% yearly since 2008 - one of the highest rates in Africa, driven by population growth, economic development and rural-to- urban migration. In 2023, about 23% of Ethiopia’s population lived in urban areas (a rise from 21% in 2019), a share which is relatively low when compared to low-income Africa (33%), the continent (45%) and global (57%) averages. The Ethiopian population resided in rural areas (77% in 2023), relying heavily on agriculture for their livelihoods. The country’s low urbanisation is influenced by several factors including historical, economic and social factors.
In the Current Path, the rate of urbanisation in Ethiopia will increase to about 33.z% by 2043, as the rural population drops to about 66.6%.
Addis Ababa, the capital city, remains the prime destination for many migrants who are attracted to the city by the opportunities it is perceived to offer or by its relative peace and security. Urbanisation, if well planned, offers an opportunity to promote an inclusive economy by accelerating the provision of a range of services, including education.
Chart 5 presents GDP in MER and growth rate in the Current Path, from 1990 to 2043.
For more than a decade, Ethiopia experienced some of the highest economic growth rates globally, growing at an average of about 11% per year from 2004 to 2015. The volume of GDP (at the market exchange rate (MER)) rose from US$22.4 billion in 2004 to US$68.2 billion in 2015. The impressive growth was mainly driven by investments in agriculture, infrastructure and manufacturing on top of determined leadership and clear policies. However, the growth rate slowed down with the death of Prime Minister Meles Zenawi in 2012 due to regional conflicts, political instability and the COVID-19 pandemic, but it remains positive. In 2023, Ethiopia’s GDP growth was estimated at about 7.2%, which translated to a GDP of US$119.7 billion (at MER).
The country’s target to reach lower-middle-income status by 2025 will be contingent on its ability to sustain growth. The clash between the Ethiopia government forces and TPLF in the Tigray area, one of Ethiopia’s most important industrial centres, has idled and destroyed many factories. Others are increasingly being shut out of markets. In 2021, President Joe Biden suspended Ethiopia’s tariff-free access to America, citing ‘gross violations of internationally recognised human rights’, by the forces of the prime minister, Abiy Ahmed. The prime minister initiated an operation against the TPLF in November 2020, alleging it had attacked a federal military base. The fight escalated to involve Eritrean and Amhara forces resulting in widespread human rights violations, mass displacement and a profound humanitarian crisis.
Ethiopia’s main challenges are sustaining economic growth and accelerating poverty reduction. Both of these require significant progress in job creation and improved governance to ensure that growth is equitable across society. A quick diplomatic resolution to the crisis is necessary for Ethiopia to overcome these challenges.
The agriculture sector is the backbone of Ethiopia’s economy, accounting for approximately 38% of GDP, approximately 80% of total exports and employing nearly 63% of total employment in 2022. Between 2024 and 2043, the country’s average growth rate will be around 7%, reaching a projected GDP of US$492.5 billion (at MER) in 2043, making it the fourth-largest economy (after Nigeria, Egypt and South Africa) in Africa on the Current Path.
Economic development depends more on sustainable growth over long periods than on bursts of explosive growth. Authorities in Ethiopia should make efforts to find a new political settlement that brings sustainable peace to the country, a critical condition for sustaining growth, and improves living standards.
Chart 6 presents the size of the informal economy as per cent of GDP and per cent of total labour (non-agriculture), from 2019 to 2043.
The informal economy comprises activities that have market value and would add to tax revenue and GDP, if they were recorded. Countries with high informality face a host of development challenges, including low revenue mobilisation, higher poverty, lower per capita incomes, greater inequality, and weaker productivity investment. Therefore, high levels of informality tend to constrain economic growth.
With the rise of unemployment, the informal sector has become a significant part of Ethiopia’s overall economic structure, contributing to employment, income generation, and the provision of goods and services for millions of people especially in the urban areas where formal job opportunities are limited relative to the amount of inhabitants. Similar to many developing countries, Ethiopia’s informal sector is defined by small-scale, unregulated and unregistered economic activities that operate outside formal legal and tax frameworks. A large share of Ethiopia’s agricultural economy operates informally, with smallholder farmers and informal traders playing central roles in rural areas.
The informal sector has helped Ethiopia reduce extreme poverty; an estimated 54.4% (equivalent to 33.9 million people) of the total labour force (non-agriculture) was informally employed in 2023. Women constituted 56.5% of the total labour force in the informal economy compared to 43.5% for men in 2023. This suggests that the role of the informal sector cannot be overemphasised, particularly for women.
The size of Ethiopia's informal economy was estimated to be 29% of the country's GDP in 2023 – 0.3 percentage points below the average for low-income countries and 3.2 percentage points above the African average. Ethiopia’s share of the informal sector represents approximately US$34.8 billion. By 2043, Ethiopia’s share of the informal sector will modestly decline to 24.8%, slightly below the average of 26.8% for low-income countries in Africa.
The formalisation of the informal sector will allow more people to benefit from better wages, social security packages and redistributive measures. Therefore, Ethiopia needs to reduce the size of its informal economy with the least friction possible by reducing the hurdles to registering a business, tackling corruption and improving access to education and finance. However, the formalisation should be gradual as the informal sector is currently the lifeblood of the growing population of young Ethiopians in the absence of formal sector opportunities. Providing support for workers in the informal sector will be key to Ethiopia’s broader development goals.
Chart 7 presents GDP per capita in the Current Path, from 1990 to 2043.
Ethiopia’s GDP per capita has risen by fourfold since 1992, faster than other low-income economies. Real GDP per capita in Ethiopia rose by an average annual rate of 4.8% from 1993 to 2022 — 3.2 percentage points more than Africa’s low-income pace of growth. Despite this improvement, the GDP per capita of Ethiopia is still very low. As of 2023, Ethiopia’s GDP per person (PPP, and constant 2017 US$) was estimated at US$2 365, the 3rd largest in Africa low-income countries. However, Ethiopia’s GDP per capita remains significantly smaller compared to Africa’s averages: about 103% smaller than the estimated average for Africa in 2023. The war between Ethiopia’s government and forces led by the Tigrayan People’s Liberation Front (TPLF) threatened to wipe away Ethiopia’s recent GDP per capita gains. However, the Pretoria Agreement signed in November 2022 marked a significant step towards ending the two-year conflict. This deal, brokered by the African Union (AU) in Pretoria, South Africa, included provisions for a permanent cessation of hostilities, disarmament of TPLF forces, restoration of essential services in Tigray, and unfettered humanitarian aid access.
On the Current Path, Ethiopia's GDP per person will grow to US$4 662 by 2043, making it the 30th largest in Africa and 36.4% below the projected average for the continent in the Current Path.
Chart 8 presents the rate and numbers of extremely poor people in the Current Path, from 2019 to 2043.
In 2022, the World Bank updated the poverty lines to 2017 constant dollar values as follows:
- The previous US$1.90 extreme poverty line is now set at US$2.15, also for use with low-income countries.
- US$3.20 for lower-middle-income countries, now US$3.65 in 2017 values.
- US$5.50 for upper-middle-income countries, now US$6.85 in 2017 values.
- US$22.70 for high-income countries. The Bank has not yet announced the new poverty line in 2017 US$ prices for high-income countries.
Monetary poverty only tells part of the story, however. In addition, the global Multidimensional Poverty Index (MPI) measures acute multidimensional poverty by measuring each person’s overlapping deprivations across 10 indicators in three equally weighted dimensions: health, education and standard of living. The MPI complements the international US$2.15 a day poverty rate by identifying who is multidimensionally poor and also shows the composition of multidimensional poverty. The headcount or incidence of multidimensional poverty is often several percentage points higher than that of monetary poverty. This implies that individuals living above the monetary poverty line may still suffer deprivations in health, education and/or standard of living.[x]
Ethiopia has made significant progress in reducing extreme poverty over the past decades. However, it remains a major constraint for the country. The poverty rate measured at the international extreme poverty line of US$2.15/day (per capita, 2017 PPP) declined from 74.9% in 1992 to 17.9% in 2019. The number of people living in extreme poverty has also declined from about 39 million in 1992 to 20.4 million in 2019. According to the World Bank, extreme poverty reduction was particularly significant in urban areas, driven by substantial investments linked to the urban renewal initiative and rapid economic growth. While poverty reduction in rural areas, where the majority of the poor reside, also showed strong progress, it has slowed during the past two decades. Poor households are typically more isolated and have less access to essential infrastructure and basic services. It is estimated that 16% of the rural population in Ethiopia is chronically poor.
Chart 8 shows past trends in poverty and projections on the Current Path. In 2023, extreme poverty (at US$2.15) in Ethiopia was estimated at 13.3% (equivalent to about 17 million people), the second-lowest poverty rate (after Gambia) among the 22 low-income countries in Africa. By 2030, Ethiopia's poverty rate will decline to 8.2%. Thus, Ethiopia will not be able to meet the Sustainable Development Goal (SDG) target of reducing extreme poverty below 3% by 2030. Without any policy interventions, Ethiopia will not meet this SDG target until 2041. By 2043, Ethiopia will have a poverty rate of about 2.3%, equivalent to about 4.5 million Ethiopians in that year - a significant positive progress as the population growth rate increases.
Chart 9 depicts the National Development Plan of Ethiopia.
The government of Ethiopia has launched a new 10-Year Development Plan, based on the 2019 Home-Grown Economic Reform Agenda, which will run from 2020/21 to 2029/30. The ten-year development plan outlines a long-term vision to establish Ethiopia as an "African Beacon of Prosperity" by creating both the necessary and sufficient conditions. The ten-year development plan aims to:
- Enhance income levels and wealth accumulation to enable citizens to meet their basic needs and fulfil their aspirations.
- Improve basic economic and social services, such as food, clean water, shelter, health, education, and other basic services, for every citizen regardless of their economic status.
- Establish a supportive and equitable environment in which citizens can fully utilise their potential and resources to lead high-quality lives.
- Enhance social dignity, equality and freedom, allowing citizens to actively participate in all social, economic and political affairs of their country, regardless of their social background.
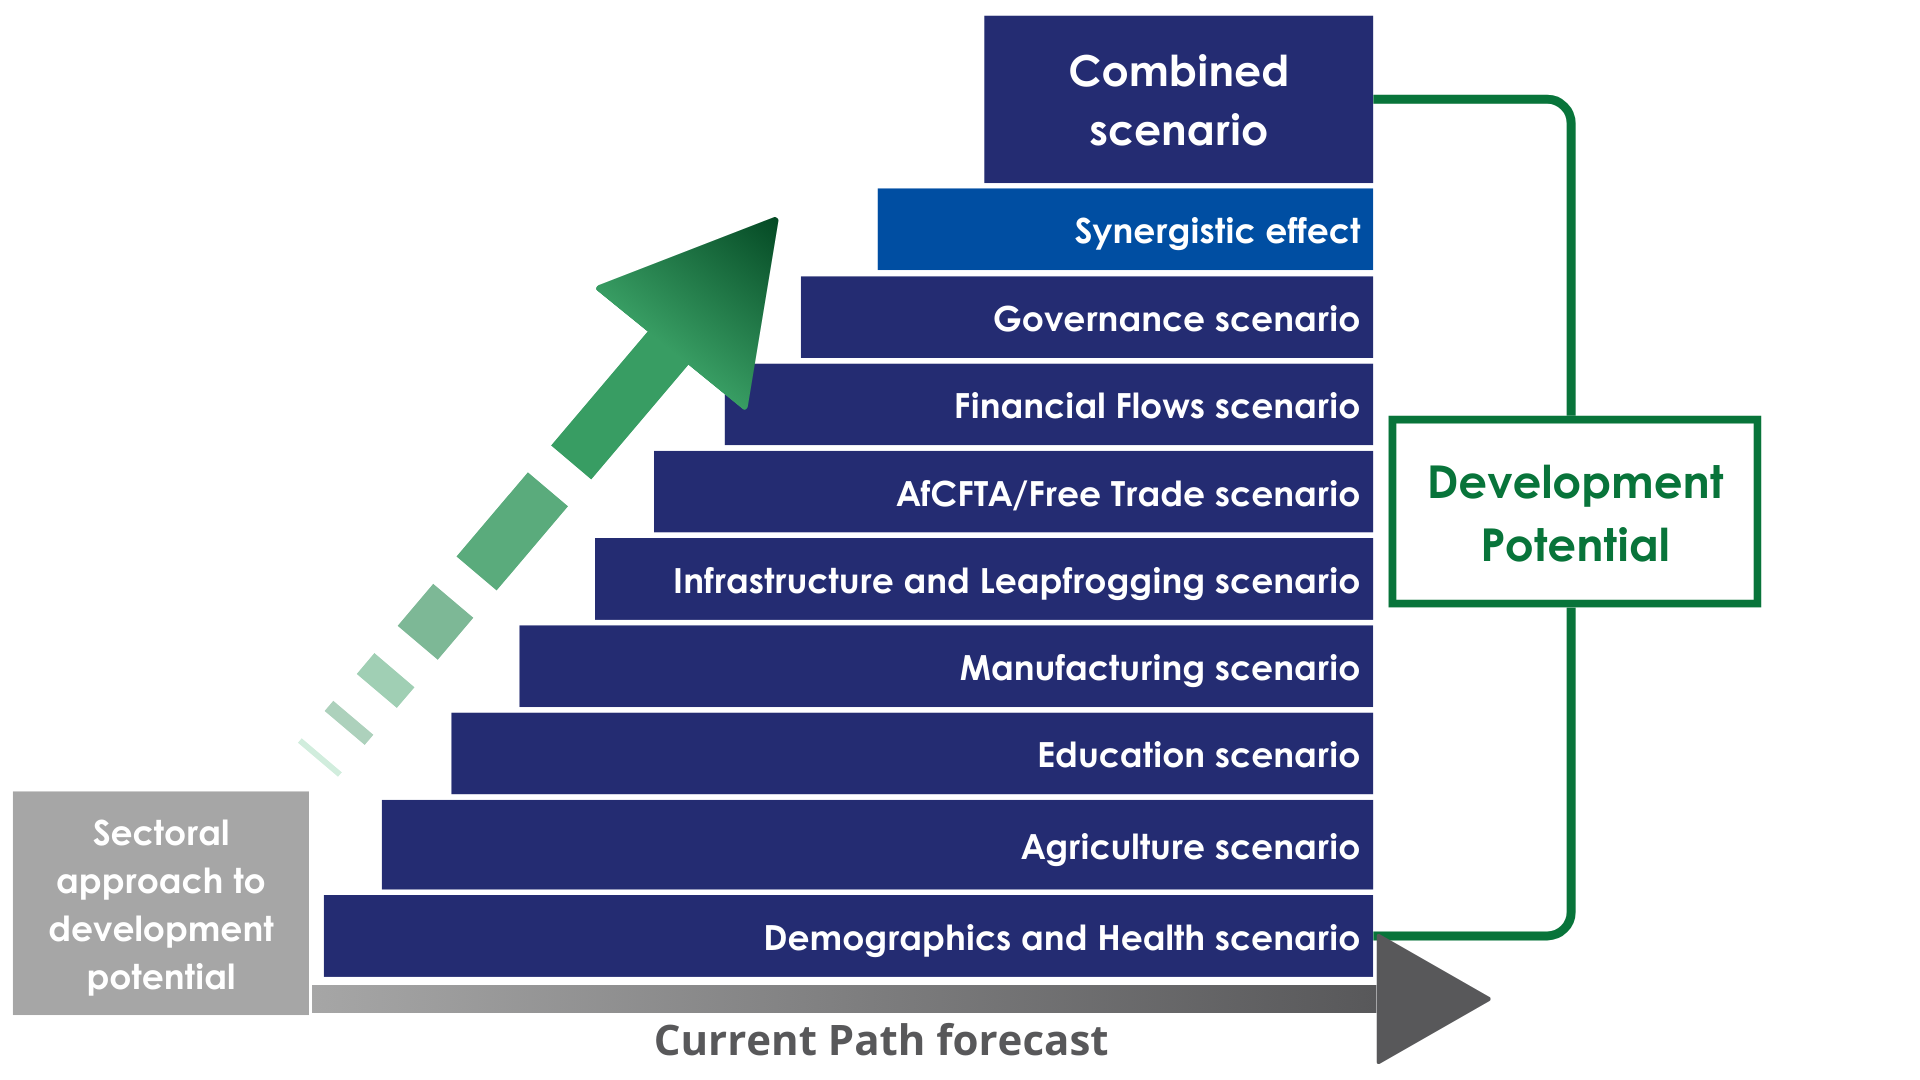
The eight sectoral scenarios as well as their relationship to the Current Path forecast and the Combined scenario are explained in the About Page. Chart 10 summarises the approach.
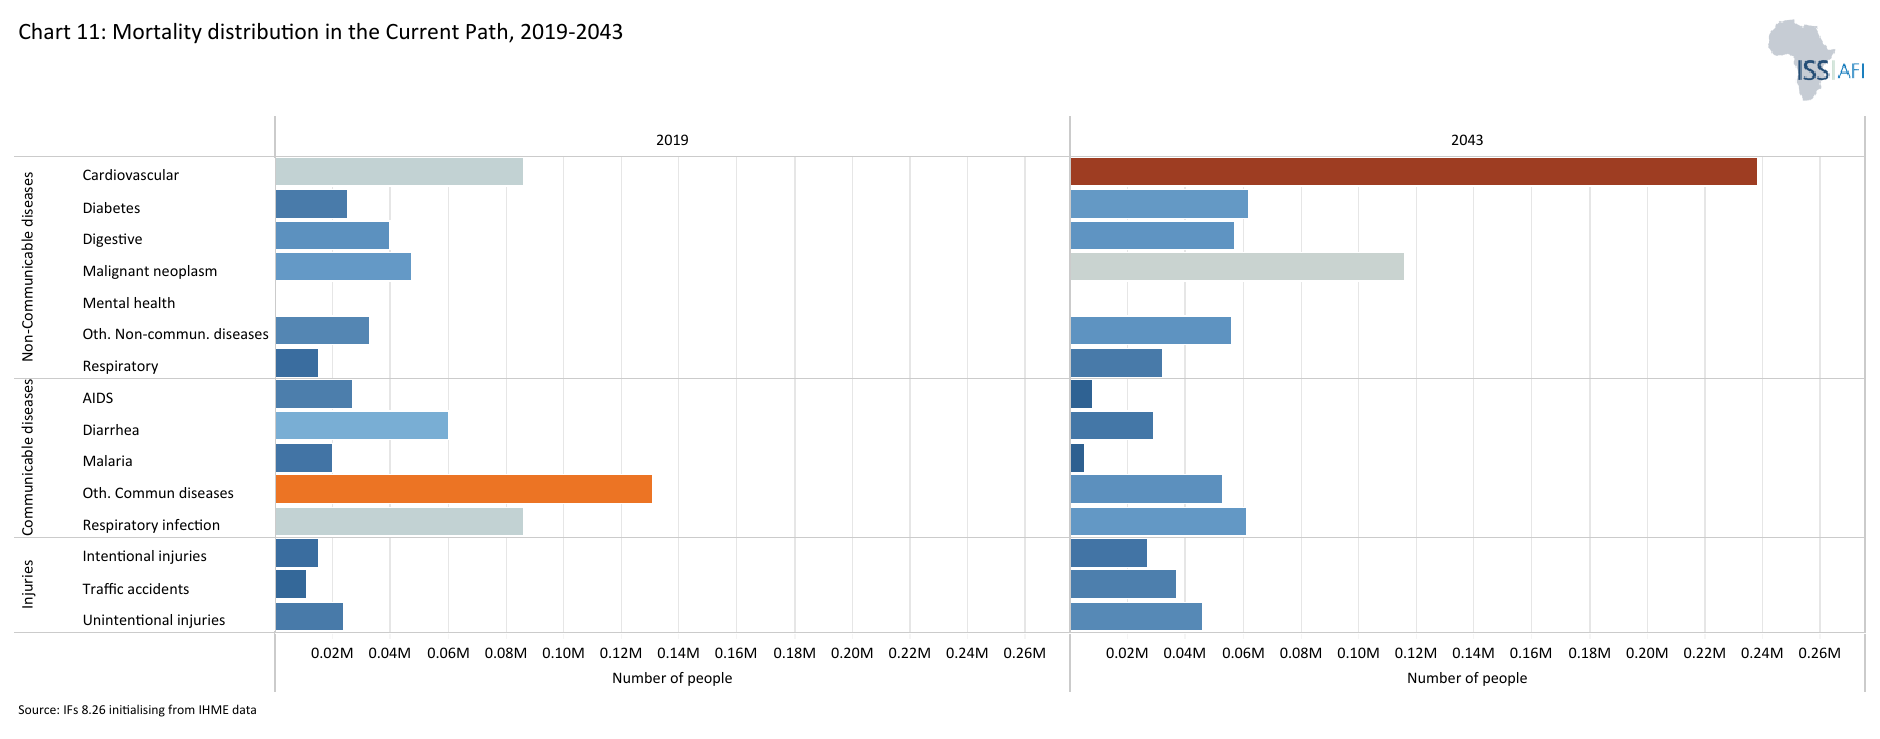
Chart 11 presents the mortality distribution in the Current Path for Ethiopia, for 2023.
The Demographics and Health scenario envisions ambitious improvements in child and maternal mortality rates, enhanced access to modern contraception, and decreased mortality from communicable diseases (e.g., AIDS, diarrhoea, malaria, respiratory infections) and non-communicable diseases (e.g., diabetes), alongside advancements in safe water access and sanitation. This scenario assumes a swift demographic transition supported by heightened investments in health and water, sanitation, and hygiene (WaSH) infrastructure.
Visit the themes on Demographics and Health/WaSH for more detail on the scenario structure and interventions.
Strong interactions exist between population and health. A country's health status influences fertility, mortality and morbidity levels. At the same time, high population growth contributes to an increased need for basic necessities of life, such as nutrition and health.
Access to basic health care in Ethiopia has significantly improved over the last two decades; however, it has remained limited, particularly in the rural areas. Mortality distribution in Ethiopia is influenced by a combination of communicable and non-communicable diseases. Common communicable health issues include lower respiratory infections, diarrheal diseases and HIV/AIDS. Lower respiratory infections (such as pneumonia) are a leading cause of death, particularly among children under five. The lack of adequate healthcare access in rural areas worsens the effects of these illnesses. Inadequate sanitation, unsafe drinking water and limited access to proper hygiene are major factors contributing to deaths from diarrheal diseases, particularly among children. Non-communicable disease issues include cardiovascular, diabetes, digestive, malignant neoplasm and mental health.
Despite advancements in reducing HIV-related deaths through awareness and treatment initiatives, HIV/AIDS remains one of the major causes of mortality, especially in urban areas of Ethiopia. However, Ethiopia’s HIV/AIDS prevalence is lower than that of its peers (low-income Africa) and below Africa’s average. In Ethiopia, the HIV prevalence is higher in urban areas, particularly among young women and girls.
Tuberculosis remains a challenge in Ethiopia, contributing to overall mortality. Its co-infection with HIV increases the mortality risk. Malaria mortality, particularly in rural and lowland areas, also remains a leading cause of death. This mortality profile highlights the impact of poverty, inadequate access to healthcare, and socio-economic inequalities across the country. Non-communicable diseases such as cardiovascular remain the leading causes of death among the elderly.
However, recent prevention and treatment efforts have resulted in a decline in mortality rates. These efforts include implementing a National Strategic Action Plan (NSAP) for the prevention and control of non-communicable diseases, which aims to reduce their prevalence, including cardiovascular diseases, diabetes, cancer and chronic respiratory conditions. The NSAP emphasises promoting healthier lifestyles, addressing common risk factors (such as tobacco use, unhealthy diets and air pollution), and improving access to early detection and treatment services.
The stunting rate among children under the age of five has declined from 66.9% in 1992 to 35.1% in 2023, less than one percentage points above the estimated average for low-income Africa and nearly six percentage points above Africa’s average in 2023. However, Ethiopia will fail to achieve the SDG target of 25% by 2030. On the Current Path, the stunting rate among children (0-5 years) will decline to just 28.9% by 2030 and to 19.9% by 2043.
Maternal mortality has declined significantly from 1 210 deaths per 100 000 live births in 1992 to 230.4 in 2023, far below the averages for low-income Africa and Africa. The reduction is driven by improved access to quality maternal health services and an increase in the number of trained health personnel in rural areas. On the Current Path, the maternal mortality rate in Ethiopia will likely decline to 162.5 deaths per 100 000 live births by 2030 (significantly above the SDG targets of less than 70 per 100 000 live births) and 69.2 per 100 000 births by 2043.
As a result of reductions in deaths from many causes, most notably communicable diseases, the country is currently (occurring in 2024) undergoing a significant epidemiological transformation, a point at which death rates from non-communicable diseases exceed that of communicable diseases, while the average for Africa low-income countries occurs in 2031. This transition is influenced by demographic changes, urbanisation, lifestyle shifts, and improved healthcare access. The increase in the burden of disease from non-communicable diseases has implications for Ethiopia’s healthcare system which will need to invest in the capacities for dealing with this burden of disease.
The Ethiopian government should continue strengthening their support for improving the health system in the country. Government public health expenditure accounted for 2.9% of GDP in 2023, slightly above the average of 2.4% for low-income Africa. Life expectancy in Ethiopia increased to 70.6 years in 2023, from 48.5 years in 1990. On the Current Path, Ethiopia’s life expectancy will increase to 73 years in 2030 and to 76.3 years by 2043.
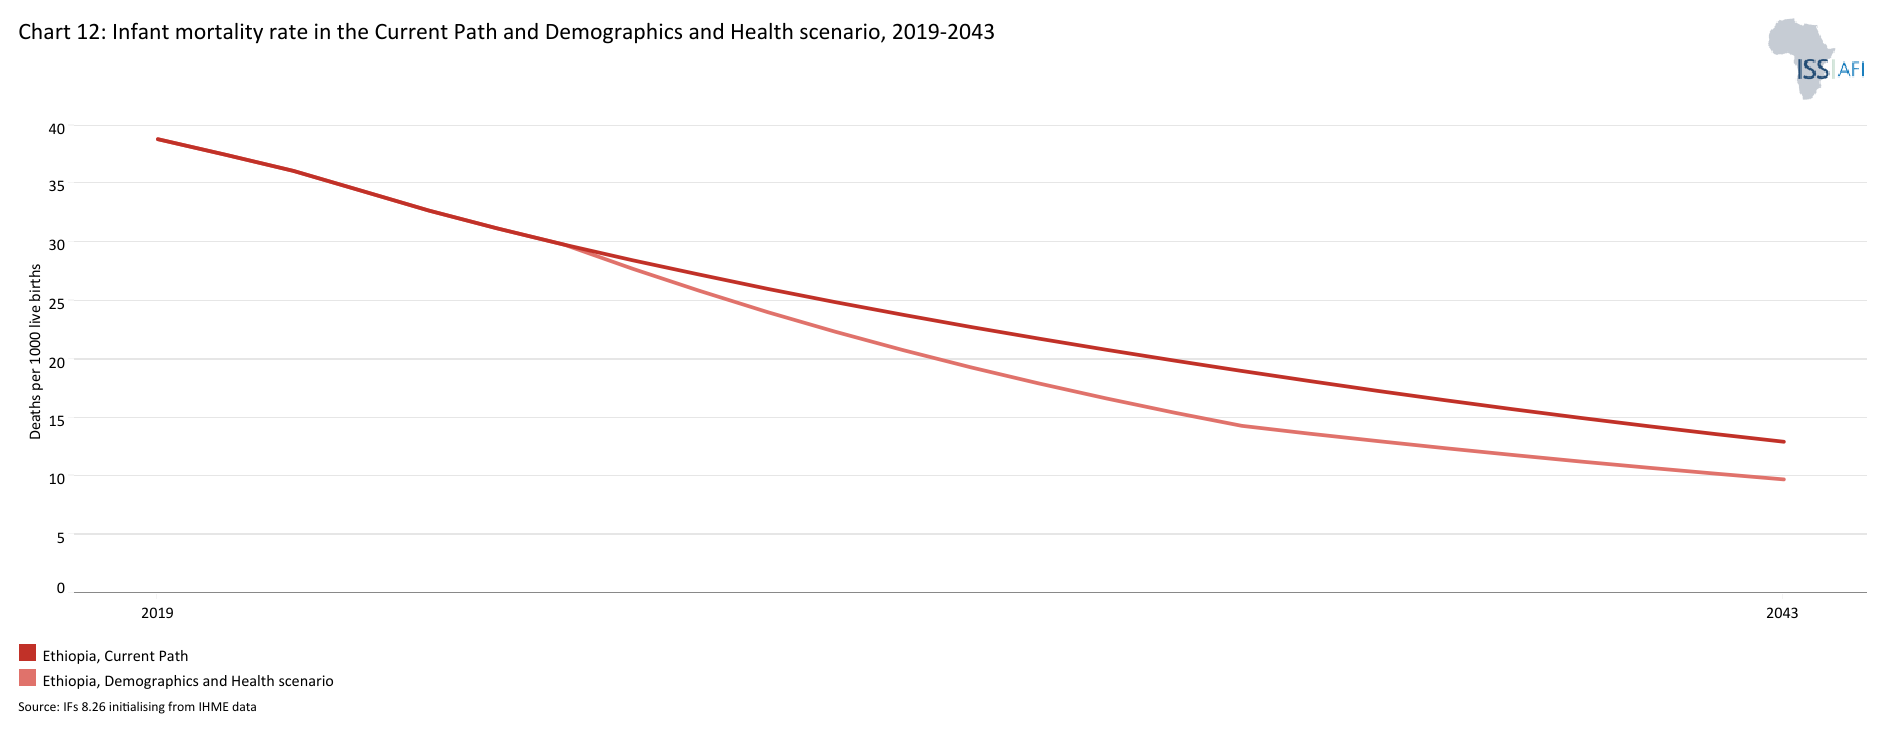
Chart 12 presents the infant mortality rate in the Current Path and in the Demographics and Health scenario, from 1990 to 2043.
The infant mortality rate is the probability of a child born in a specific year dying before reaching the age of one. It measures the child-born survival rate and reflects the social, economic and environmental conditions in which children live, including their health care. It is measured as the number of infant deaths per 1 000 live births and is an important marker of the overall quality of the health system in a country.
Ethiopia has made significant progress in lowering infant mortality; although below Africa’s averages, the rates are still relatively high compared to the global average. In 2023, Ethiopia’s infant mortality rate stood at around 32.7 deaths per 1000 live births.
On the Current Path, infant mortality will continue to decline to 23.8 deaths per 1 000 live births by 2030, on track with the SDG target of at least as low as 25 deaths. By 2043, Ethiopia’s infant mortality will decline to 13 deaths per 1 000 live births, far below the estimated averages for Africa.
The interventions in the Demographics and Health scenario see Ethiopia's infant mortality rate drop even further by 2043 to 9.7 deaths.
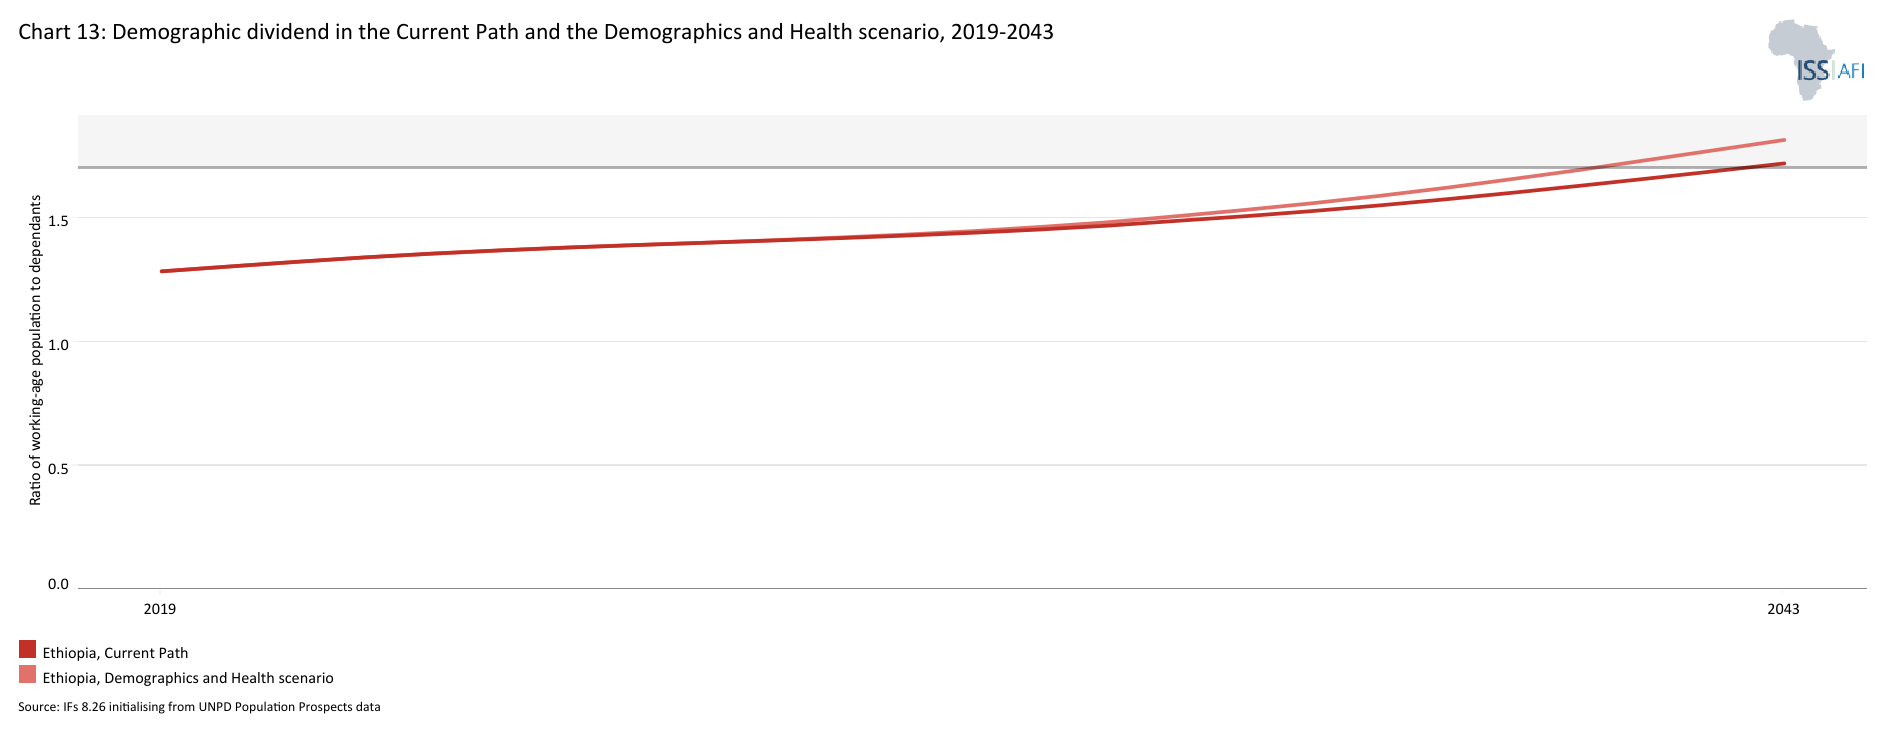
Chart 13 presents the demographic dividend in the Current Path and in the Demographics and Health scenario, from 2019 to 2043.
The demographic dividend can be defined as the economic growth generated by a country’s demographic change. This change in population structure creates an opportunity for faster economic growth if it is supported by appropriate policies and investment. It generally materialises when a country reaches a ratio of at least 1.7 people of working age (15-64 years of age) for each dependant (children (0-14 years) and elderly people (65+ years).
The demographic dividend is driven by several factors, including a decline in the fertility rate and improved health and education. When there are fewer dependants to care for, both families and governments can save more and invest in education, infrastructure, and the economy, accelerating growth.
In 2023, Ethiopia’s ratio was estimated at about 1.4 people of working age for each dependant. On the Current Path, Ethiopia will enter its first demographic window of opportunity by 2043, when the ratio will reach 1.7:1.
The Demographics and Health scenario will enable Ethiopia to achieve its first demographic dividend by 2041, two years earlier. However, it is important to note that the growth in the working-age population relative to dependants does not automatically translate into rapid economic growth unless the labour force acquires the needed skills and is absorbed by the labour market.
As of 2021 (latest available historical data), only 68.3% of Ethiopia’s working-age population was estimated to be economically active. At a disaggregated level, the women's labour force participation rate was estimated at 57.6%, while men’s at 79.2% in 2021.
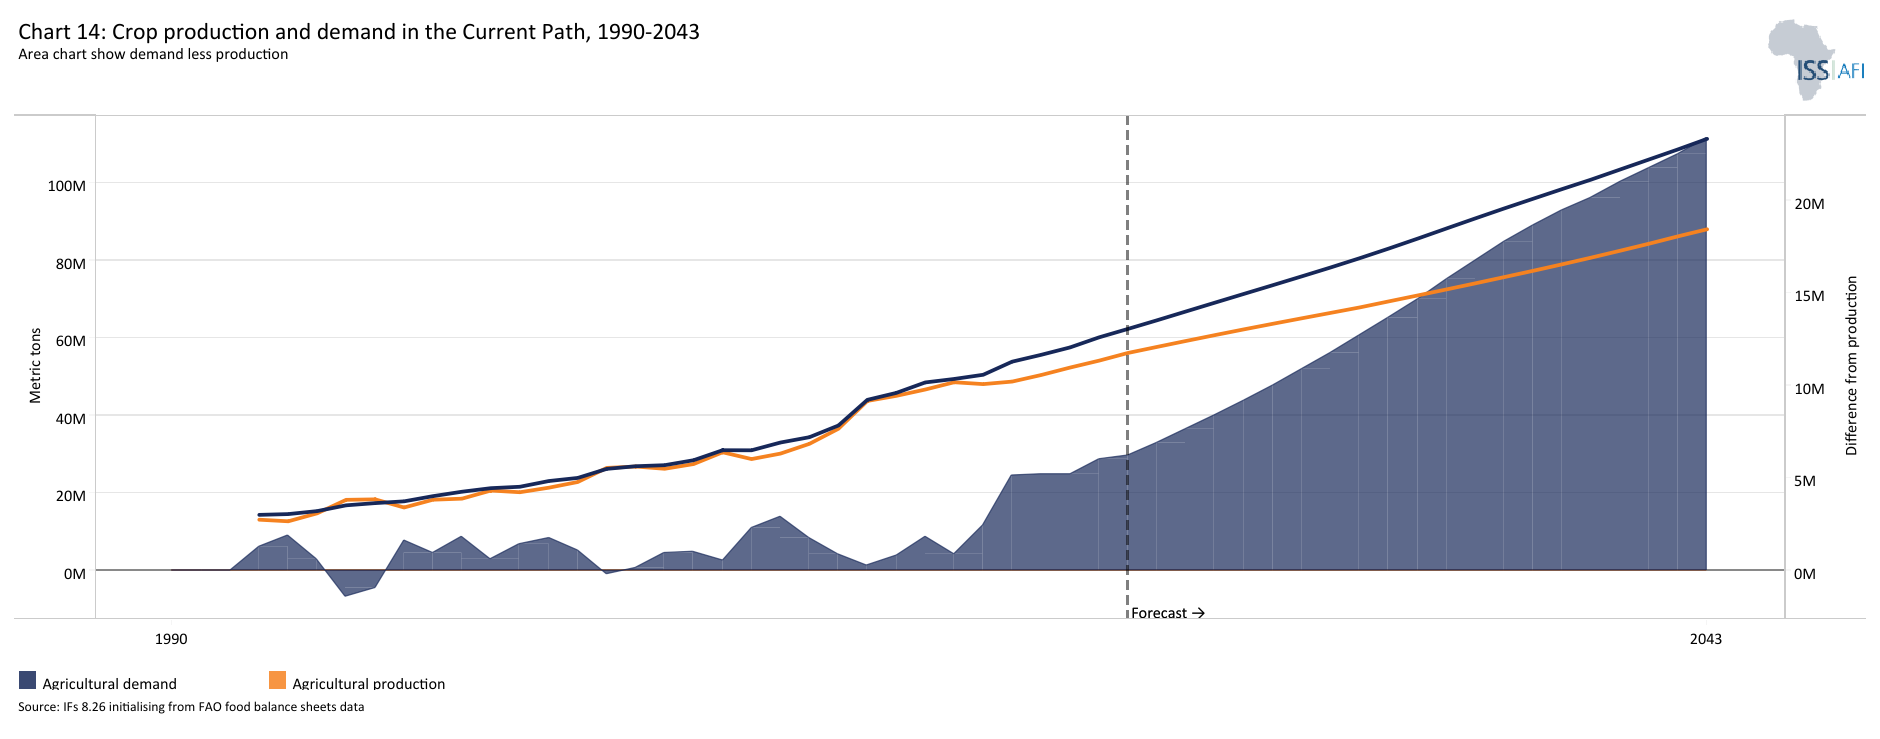
Chart 14 presents crop production and demand in the Current Path, from 1990 to 2043.
The Agriculture scenario envisions an agricultural revolution that ensures food security through ambitious yet feasible increases in yields per hectare, thanks to improved management, seed, fertiliser technology, and expanded irrigation and equipped land. Efforts to reduce food loss and waste are emphasised, with increased calorie consumption as an indicator of self-sufficiency and prioritising it over food exports. Additionally, enhanced forest protection signifies a commitment to sustainable land use practices.
Visit the theme on Agriculture for our conceptualisation and details on the scenario structure and interventions.
The agriculture sector plays a critical role in Ethiopia’s economy, accounting for nearly 38% of GDP, about 90% of the country’s total export earnings, and an estimated 63% of the country’s workforce in 2022. The major crops grown in Ethiopia include cereals, oilseeds, coffee, fruits and vegetables. When it comes to coffee, Ethiopia remains one of the largest producers in the world. However, agricultural production is primarily rain-fed, making it vulnerable to climate change. Thus, irrigation plays a crucial role in Ethiopia’s agriculture sector. In 2023, around 800 000 hectares of land were under irrigation. However, in the Current Path, land under irrigation in Ethiopia will decline to about 731 000 hectares in 2030 and to 700 000 by 2043. This decline in irrigated land in Ethiopia stems from several interrelated challenges i.e., environmental degradation.
The share of the agricultural labour force has remained dominant relative to other sectors; however, it has declined significantly from about 78% in 2005, while the share of total economic output (GDP) has declined from nearly 64% in 1992. These trends reflect a structural shift occurring in Ethiopia’s economy. They are inevitable but should not divert attention from the goal of enhancing productivity in the agricultural sector.
In 2023, Ethiopia had the fifth-highest crop production in Africa (after Nigeria, Egypt, DR Congo and South Africa), with an estimated production of about 56.1 million metric tons. However, it had one of the lowest average crop yields per hectare in Africa, with an estimated 3.3 tons per hectare in 2023, although above the average of 2.9 tons for Africa’s lower-middle-income countries. Ethiopia ranked 34 out of 54 African countries. On the Current Path, the average crop yields per hectare for Ethiopia will marginally increase to nearly 4 tons by 2043, far below the projected average of about 5.1 for Africa in the same year.
The significant role of the agriculture sector in the Ethiopian economy highlights its continuous importance as a key driver of economic growth and poverty reduction. However, just five per cent of land is irrigated and crop yields from small farms are below regional averages.
Market linkages are weak, and the use of improved seeds, fertilisers and pesticides remains limited. In the coming years, Ethiopia will likely face significant challenges in ensuring food security due to rapid population growth, climate change, a decline of natural resources, inflation of essential goods, rising youth unemployment, political turmoil, and civil conflict.
Going forward, feeding the growing population under these conditions will be one of the country's greatest challenges. As of 2023, crop demand was estimated at 62.3 million metric tons, creating a deficit of 6.2 metric tons. On the Current Path, crop production will increase to about 88 million metric tons by 2043, while crop demand will increase to about 111.3 million metric tons, an estimated deficit of 23.3 million metric tons in that year. The Current Path illustrates a widening gap between domestic crop production and demand (Chart 14), which will worsen Ethiopia's agricultural crop trade deficit, with food import dependency rising to 22.8% of total demand by 2043, compared to just 12.2% in 2023.
Despite these challenges, agriculture-led economic growth linked to improved livelihoods and nutrition can become a long-lasting solution to Ethiopia’s chronic poverty and food insecurity. The country has a huge labour force, water resources and great opportunities, such as commercialising fruits, vegetables and ornamental plant production. Ethiopia also has varying climates and soil types that enable it to grow a diversity of horticultural crops. However, Ethiopia’s current production of fruits and livestock for export is very limited due to fragmented farming practices and lack of quality.
Addressing these challenges will require a stronger commitment from the government, non-governmental organisations, and international bodies to ensure the basic needs of the population. Additionally, inspiring citizens to commercialise agriculture through improved infrastructure, incentives and support for exporting agricultural products will be essential.
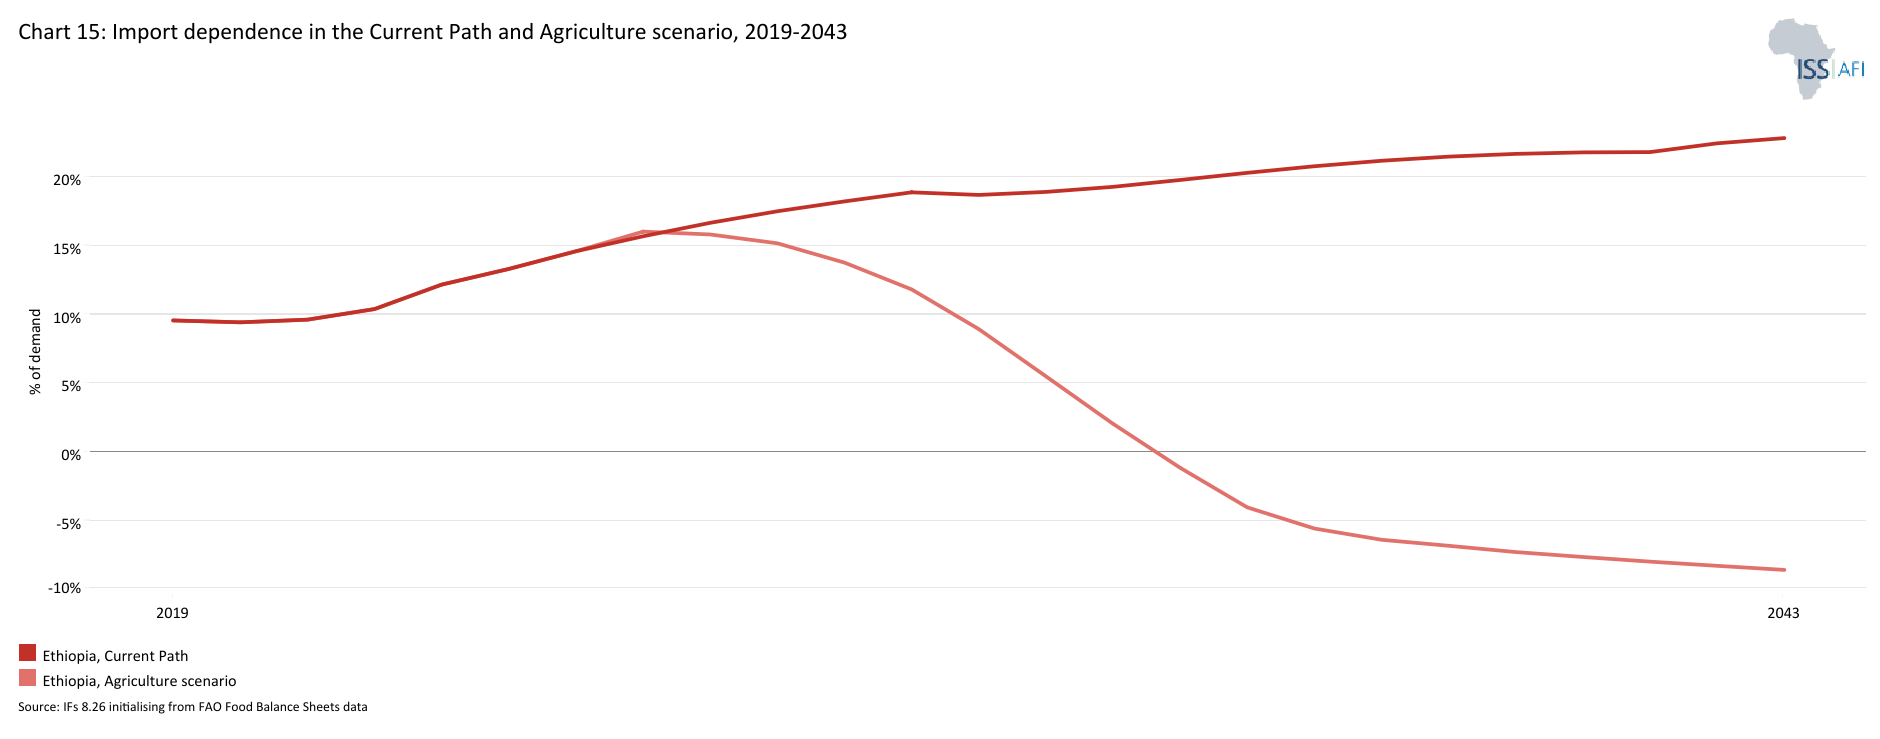
Chart 15 presents the import dependence in the Current Path and the Agriculture scenario, from 2019 to 2043.
The Agriculture scenario will benefit Ethiopia by boosting yields, decreasing reliance on vulnerable rain-fed crops through irrigation schemes, reducing post-harvest losses, and unlocking Ethiopia's agricultural potential.
In the Agriculture scenario, crop production by 2043 will be 121.8 million metric tons, 38.5% higher than in the Current Path, while demand will be 111.2 million metric tons. As a result, Ethiopia will have a surplus of 8.6% of total demand, compared to a deficit (import dependency) of 22.8% in the Current Path (Chart 15).
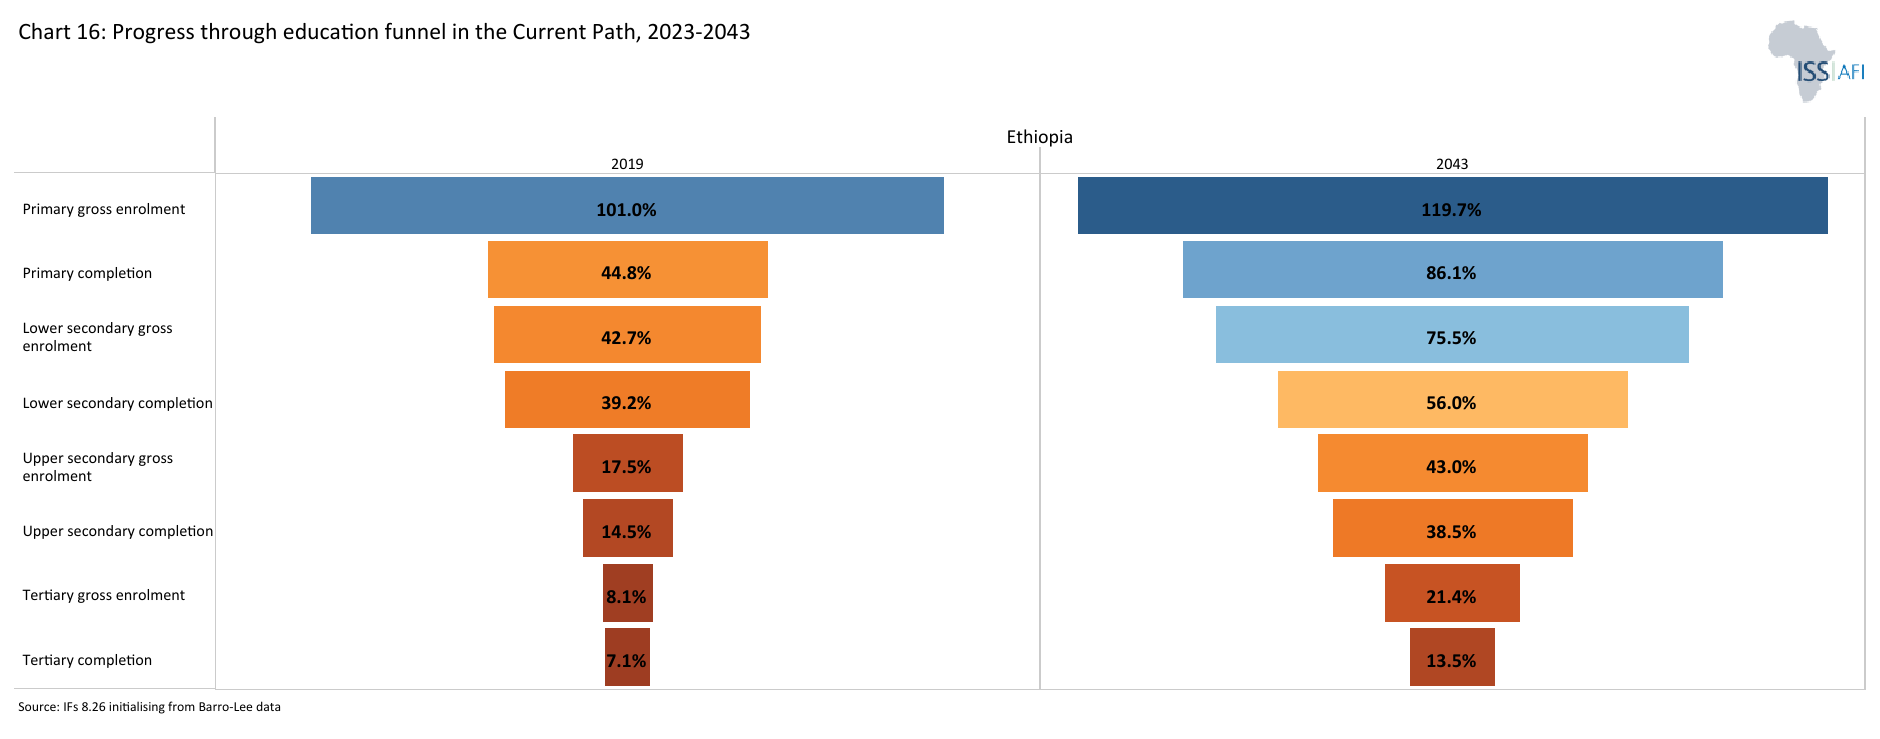
Chart 16 depicts the progress through the educational system in the Current Path, for 2023 and 2043.
The Education scenario represents reasonable but ambitious improved intake, transition and graduation rates from primary to tertiary levels and better quality of education at primary and secondary levels. It also models substantive progress towards gender parity at all levels, additional vocational training at the secondary school level and increases in the share of science and engineering graduates.
Visit the theme on Education for our conceptualisation and details on the scenario structure and interventions.
Over the past five years, Ethiopia's education systems have faced severe challenges due to the overlapping crises of armed conflict, changes in language policies, COVID-19 pandemic and climate change. The combined impact left at least 13 million children out of school in Ethiopia, with long-term implications for their futures. Since 2021, eight thousand schools have been damaged, looted or destroyed, depriving millions of children and youth of their right to education. Since the onset of these crises, many children, youth and their families have been exposed to violence. The impact of emergencies on education in Ethiopia is further exacerbated by additional barriers, including traditional gender norms, long distances to school (particularly in rural areas) and the heavy burden of domestic work (especially for girls).
Ethiopia's language policies in education have evolved significantly over time, influencing both educational access and sociopolitical relations. Under Emperor Haile Selassie, Amharic was designated as the primary language of instruction, serving as a tool for nation-building and centralisation. While this policy aimed to unify the country, it often disadvantaged non-Amharic-speaking communities, creating barriers for students from diverse linguistic backgrounds and impacting their academic success and social inclusion.
After 1991, Ethiopia's education language policy underwent a significant transformation under the Ethiopian People's Revolutionary Democratic Front (EPRDF) government. The new policy adopted a decentralised approach, introducing mother-tongue instruction in primary schools as part of a broader federalisation framework. Currently, more than 20 local languages serve as mediums of instruction in Ethiopian schools, reflecting the nation's commitment to embracing ethnic and linguistic diversity. English becomes the primary language of instruction in secondary and higher education.
However, despite that, Ethiopia has made significant progress toward universal primary education with an estimated net enrollment of 86% in 2023, 7.1 percentage points above the average for low-income Africa and about 1.7 percentage points above the estimated average for Africa. The estimated pupil-teacher ratio at the primary level is 39:1, with female teachers making up just 39% of all primary school educators. Children in rural areas are much less likely to attend school, remain enrolled and perform well.
Although most Ethiopian children are enrolled in primary school, many do not progress, with only 33.7% making it to secondary school (net enrolment), slightly above the average for low-income Africa and below the average of 42.5% for Africa in 2023. The secondary completion rate remains very low: 10.1% of the population 15 years of age and above in 2023 compared with an average of 13.3% for low-income countries. Because of low completion and transition rates, fewer students are eligible for tertiary education levels and the resultant outcomes get poorer, which in turn reduces human capital accumulation.
The gross tertiary enrollment rate is just about 9.8%. The mean educational attainment for adults (15+ years of age) is a good indicator of the stock of human capital in a country but Ethiopia has one of the lowest in the world, at four years in 2023. The country ranked 47th in Africa in 2023. The quality of learning is also a major challenge, with 45.4% of the population 15 years and older being illiterate in 2023. This continues to be one of the major challenges facing the education system.
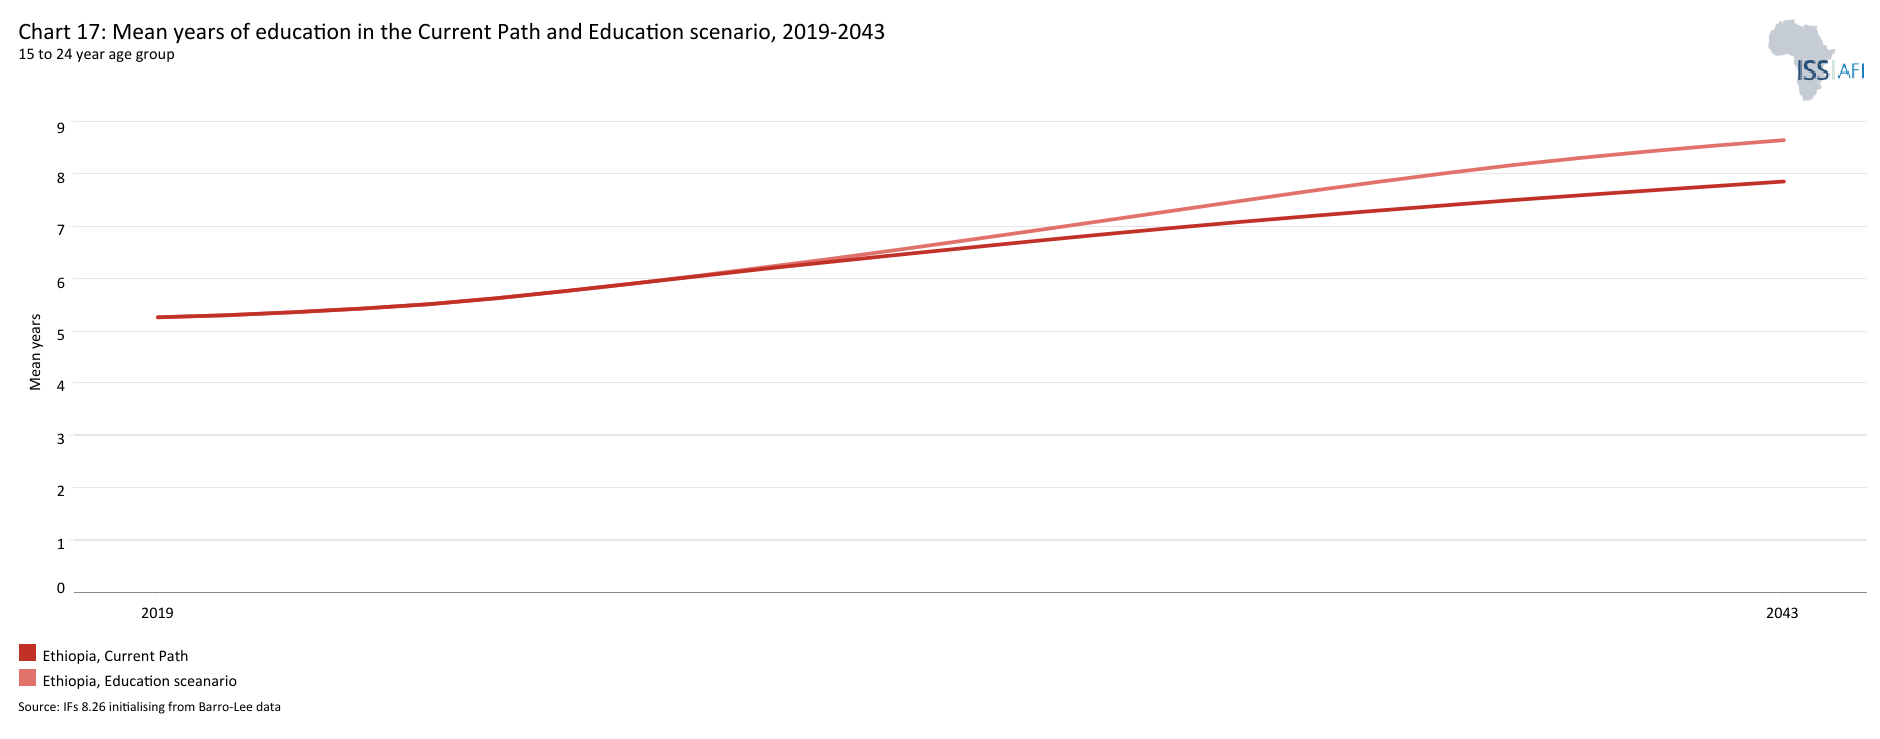
Chart 17 presents the mean years of education in the Current Path and in the Education scenario, from 2019 to 2043, for the 15 to 24 age group.
The average years of education in the adult population aged 15 to 24 is a good first indicator of how society's stock of knowledge is changing.
The average years of Education in the adult population aged 15 to 24 years is a good first indicator of how the stock of knowledge in society is changing. The mean educational attainment for this group in Ethiopia is low, at 5.5 years in 2023 and will reach about 7.9 years by 2043. The Education scenario would improve the mean years of education for adults aged 15 to 24 in Ethiopia to 8.7 years by 2043.
In Ethiopia, the labour force is predominantly composed of low-skilled and poorly educated workers. Due to the country's low economic complexity, the labour market currently favours unskilled labour. Ethiopia's low economic complexity also affects its ability to respond to global market changes and economic shocks, as the country lacks a diversified economic base capable of absorbing and adapting to fluctuations. Moreover, this situation restricts opportunities for innovation, value addition and the development of high-skilled jobs, all of which are essential for sustained economic growth.
However, as economic complexity increases over time, there will be a growing demand for skilled labour, especially in the formal sector. Given the current weaknesses in the education system, Ethiopia is not well-equipped to develop the relevant skills needed for the job market, potentially hindering competitiveness and productivity.
The Education scenario could contribute to addressing these challenges. The share of science and engineering students among tertiary graduates in Ethiopia will increase to 21.4% by 2043, five percentage points higher than on the Current Path. Also, the share of vocational enrollment at secondary education will increase to 51.7% compared to only 44.2% on the Current Path by 2043.
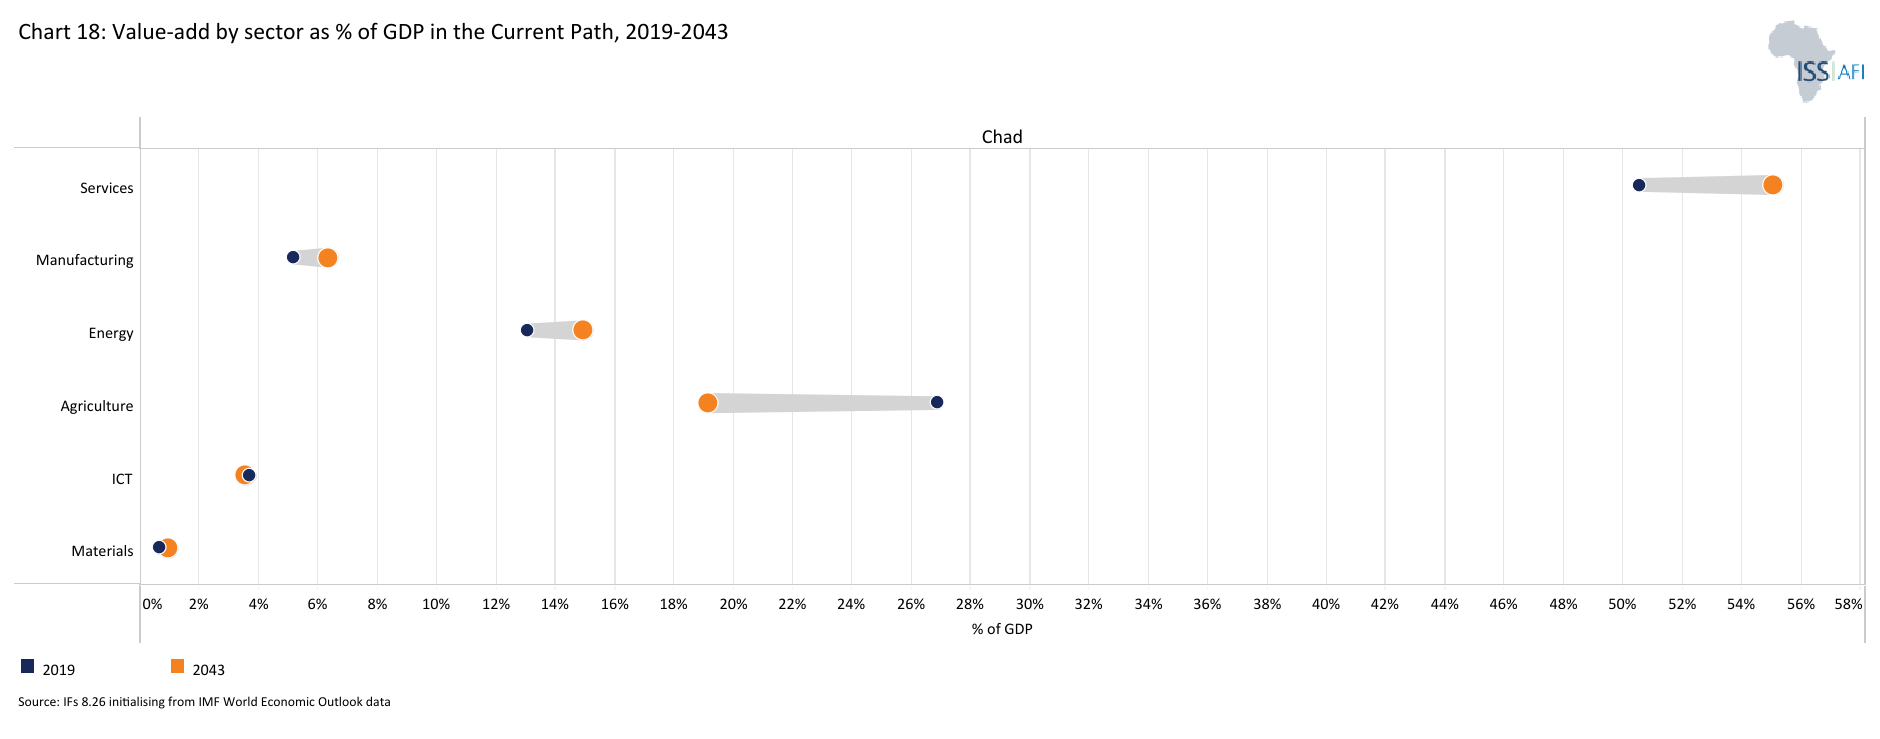
Chart 18 presents the value-add by sector as share of GDP in the Current Path, for 2023 and 2043.
In the Manufacturing scenario, reasonable but ambitious growth in manufacturing is envisaged through increased investment in the sector, research and development (R&D), and improved government regulation of businesses. This aims to enhance total labour participation rates, particularly among females where appropriate and is accompanied by increased welfare transfers to unskilled workers to mitigate the initial rises in inequality typically associated with a low-end manufacturing transition.
Visit the theme on Manufacturing for our conceptualisation and details on the scenario structure and interventions.
Despite Ethiopia's emergence as one of Africa's fastest-growing economies, its manufacturing sector is not a driving force for growth and economic transformation. The sector currently plays a marginal role in job creation, exports and overall output, while also failing to stimulate strong domestic linkages.
Ethiopia’s manufacturing sector is dominated by small and medium enterprises (SMEs), resource-based industries and low-technology industries. These industries produce low-value, low-technology goods with limited linkages both within the sector and across other industries. Food products, beverages, non-metallic minerals and textiles continue to account for more than 50% of total sector output, with limited product diversification.
Ethiopia’s manufacturing sector faces several challenges, driven mainly by a combination of macroeconomic pressures, security issues and external economic shocks. Many business leaders have raised concerns about the limited capacity of the Ethiopian manufacturing workforce. Ethiopia's relatively weak labour law system and absence of a minimum wage pose significant challenges for workers and hinder the development of a robust and skilled industrial labour force. Low wages, low productivity and high employee turnover can deter manufacturing investment. The government of Ethiopia acknowledges the importance of enhancing the skills of the nation's workforce and has invested in technical training institutes and several regional vocational colleges.
The sector accounted for only 4.6% of GDP and contributed 5% to total employment in 2023, a decrease from 5.9% of GDP in 2022. The country’s manufacturing sector meets only about 38% of domestic demand, with the remaining 62% being imported.
Nearly 450 firms, out of approximately 5 000, ceased production across the country in 2022, while the remaining firms were operating below capacity, close to 30% capacity. One of the key challenges was the worsened security situation in the country which has partly improved although instability remains, particularly due to conflicts in the Oromia and Amhara regions, which pose challenges for businesses.
According to the United Nations Development Program (UNDP), Ethiopia currently has 18 industrial parks (five privately built and 13 public parks). These industrial parks had attracted more than 60 foreign investors with US$740 million of FDI and created employment opportunities for 150 000 Ethiopians. However, many foreign firms left as a result of the civil war and subsequent instability, the suspension of the African Growth and Opportunity Act (AGOA), and ongoing security issues. Due to these and other factors, Ethiopia is unlikely to achieve its SDG target of doubling the share of its manufacturing employment by 2030. Ethiopia was suspended from the AGOA in January 2022 due to human rights violations associated with the conflict in the northern Tigray region.
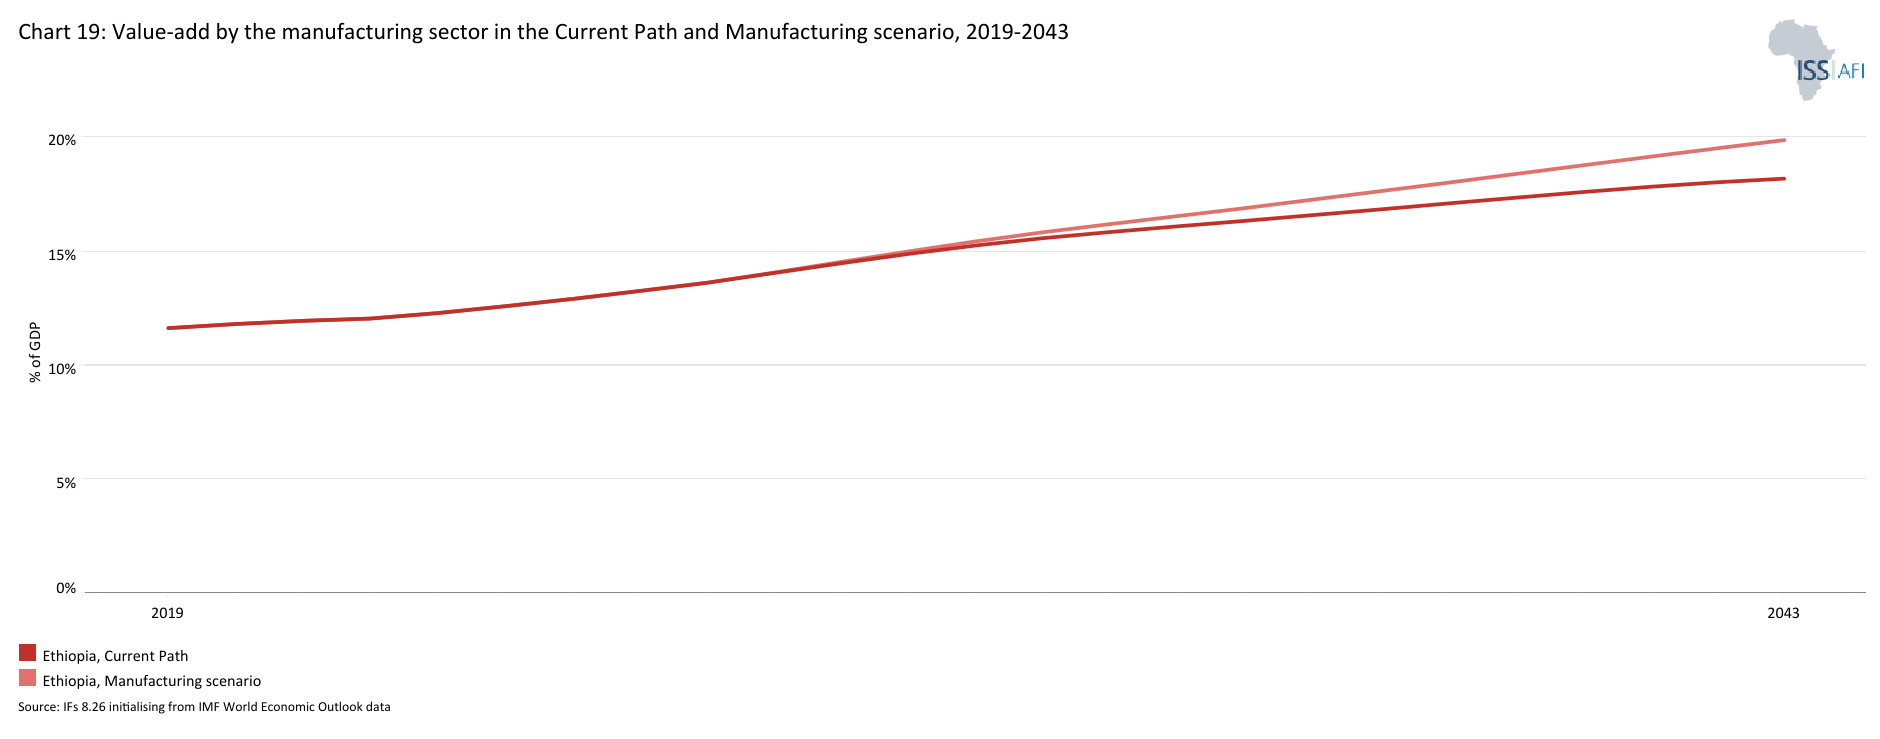
Chart 19 presents the contribution of the manufacturing sector to GDP in the Current Path and in the Manufacturing scenario, from 2019 to 2023. The data is in US$ and % of GDP.
Manufacturing is crucial for Ethiopia’s structural transformation, as the sector has the potential to create quality jobs for over two million youth entering the labour market each year, generate foreign exchange, and enhance the overall quality of life. On the Current Path, the share of the manufacturing sector in Ethiopia’s GDP will likely increase to 18.2% by 2043, slightly below the average of 20.1% for low-income Africa. The implementation of the manufacturing scenario could push the share of the manufacturing sector in GDP to about 20% by 2043.
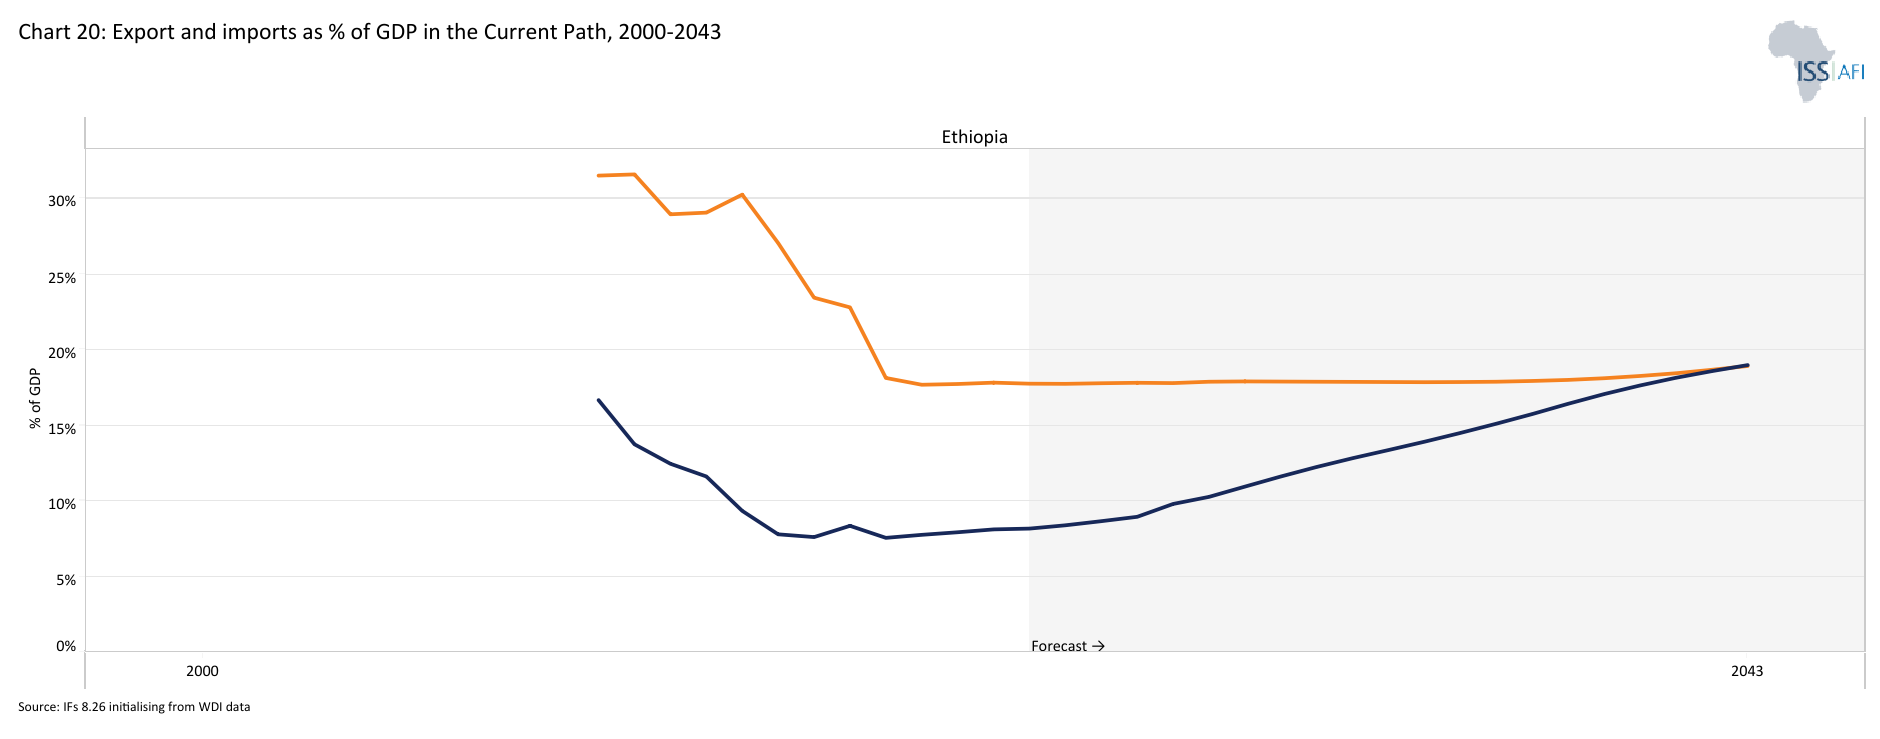
Chart 20 depicts exports and imports as a percentage of GDP, from 1990 to 2043, in the Current Path and in the AfCFTA scenario.
The AfCFTA scenario represents the impact of fully implementing the African Continental Free Trade Agreement by 2034. The scenario increases exports in manufacturing, agriculture, services, ICT, materials and energy exports. It also includes improved multifactor productivity growth from trade and reduced tariffs for all sectors.
Visit the theme on AfCFTA for our conceptualisation and details on the scenario structure and interventions.
Ethiopia is an open economy and trades globally. However, its trade is costly due to non-trade barriers, particularly on imports. The importation process can be expensive, logistically challenging and time-consuming. Some sources indicated that importing inputs or goods from an international distributor can take six to nine months. A consequence of that is the negative effect on the growth of the manufacturing sector. Ethiopian manufacturers are unable to source their needed industrial (or capital) inputs from the local supply chain, so they are highly dependent on importing these resources. As a result of this inefficiency, Ethiopian manufacturers often opt to produce only a niche range of products with strong consumer demand—requiring minimal marketing—rather than risking investment in a new product line (product diversification) with uncertain demand or profit margins.
In 2023, Ethiopia’s top imports were dominated by agricultural inputs such as fertilisers (60%), animal, vegetable or microbial fats and oils (22%), mineral fuels, oils, and bituminous substances (6%). The total import value was estimated at 17.8% of GDP. On the Current Path, the value of Ethiopia’s imports will reach nearly 19% of GDP by 2043—slightly below its export share.
Ethiopia is one of the world’s leading producers and exporters of coffee. In 2023, Ethiopia’s export composition was dominated by coffee, vegetables and oil seeds, accounting for about 90% of total exports. This evidences its heavy reliance on agriculture. Key export destinations were South Africa, Eswatini, Tunisia, Morocco, Kenya and Madagascar, collectively accounting for around 80% of this value. The total export value was estimated at 8.2% of GDP in 2023. On the Current Path, the value of exports will reach 19% of GDP by 2043.
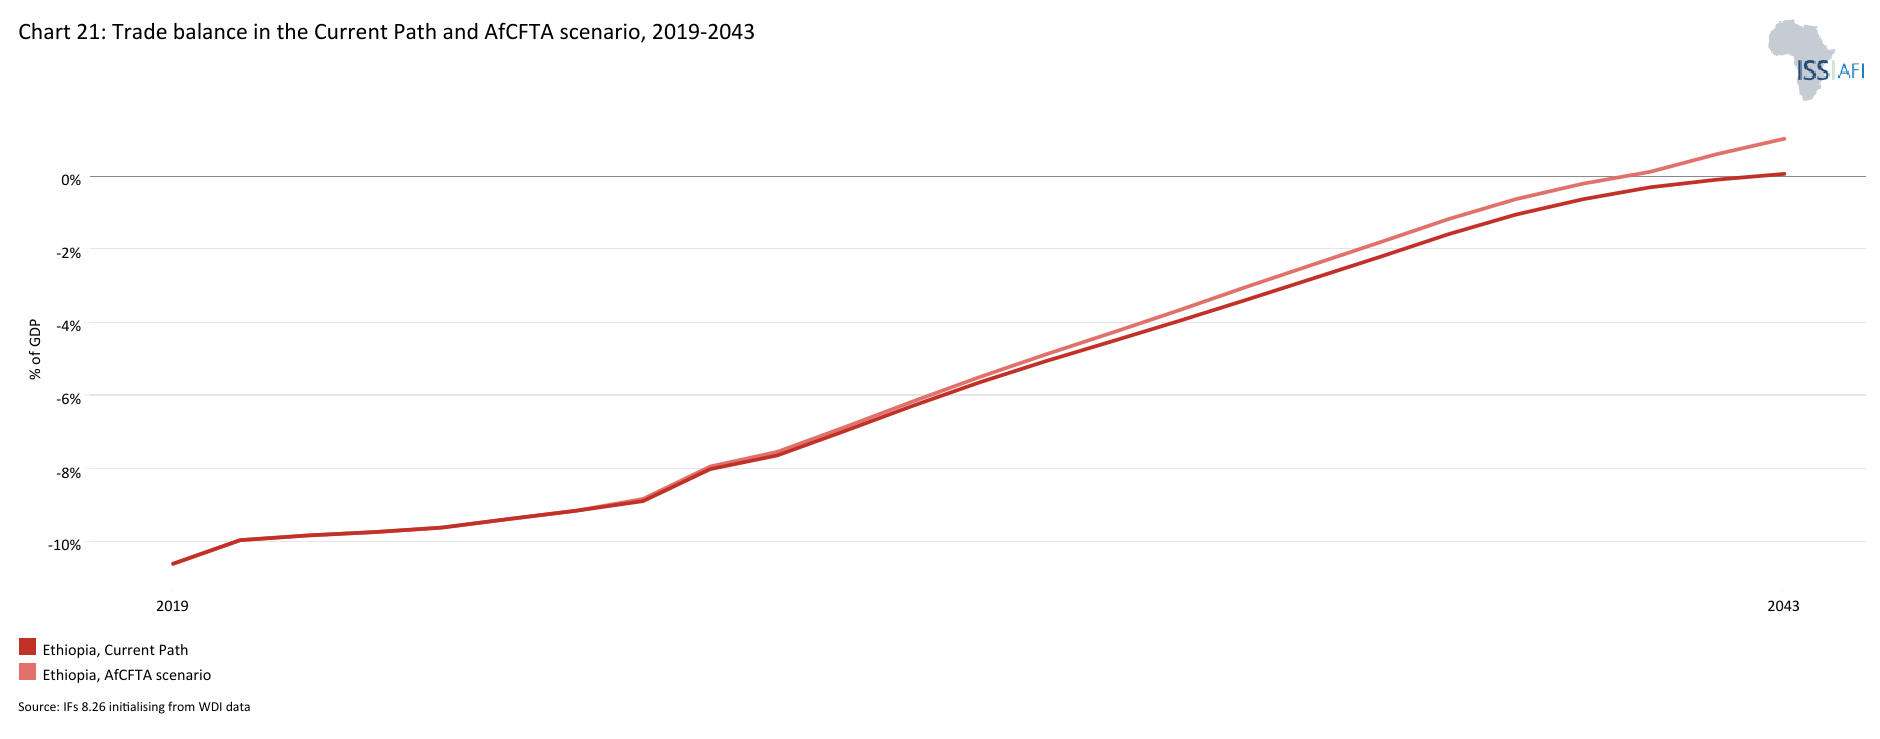
Chart 21 presents the trade balance in the Current Path and in the AfCFTA scenario, from 2019 to 2043, as a percentage of GDP.
Ethiopia’s trade balance is structurally in deficit— a trend which is likely to persist until 2042, translating into regular shortages of foreign exchange. On the Current Path, the trade deficit will likely be equivalent to 6.3% of GDP by 2030, which is significantly lower than its level of 9.6% in 2023. By 2043, Ethiopia will have a trade surplus equivalent to nearly 0.1% of GDP. In the AfCFTA scenario, where trade restrictions are loosened and productivity is increased, Ethiopia will record a trade surplus equivalent to one percent of GDP by 2043.
The AfCFTA represents a major opportunity for African countries, including Ethiopia, to overcome the constraints of narrow domestic markets and boost exports. In the AfCFTA scenario, the value of Ethiopia’s total exports will be US$18.6 billion larger than the Current Path in 2043. These gains will, however, require major efforts to reduce the burden on businesses and traders to cross borders quickly and safely and with minimal interference by officials.
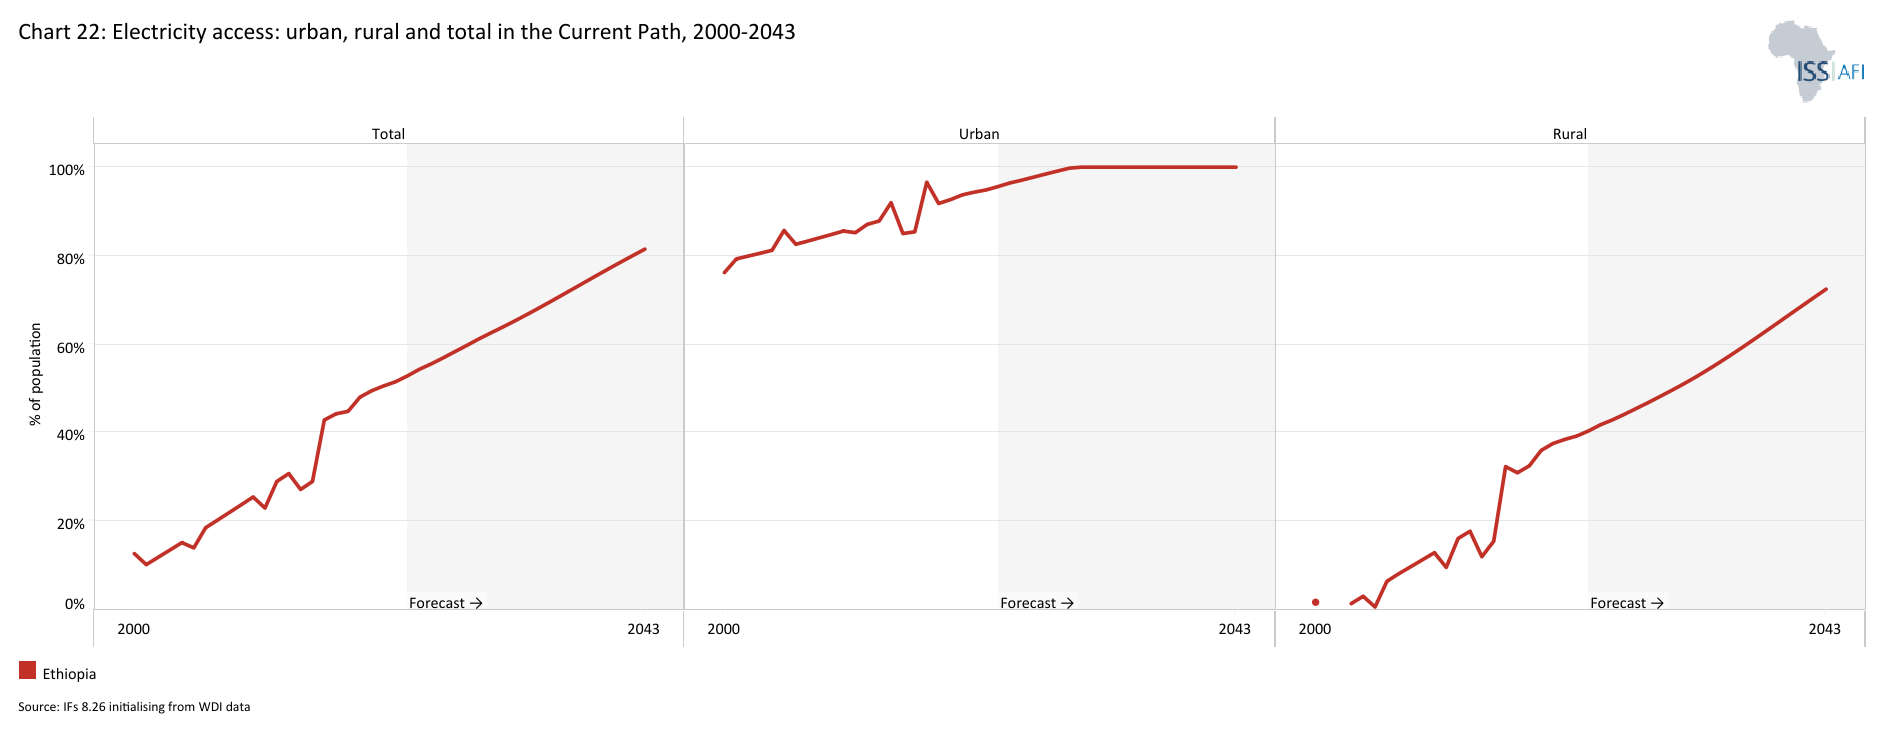
Chart 22 presents the Current Path of access to electricity for urban, rural and the total population from 2000 to 2043.
The Large Infrastructure and Leapfrogging scenario involves ambitious investments in road and renewable energy infrastructure, improved electricity access and accelerated broadband connectivity. It emphasises adopting modern technologies to enhance government efficiency, incorporating significant investments in major infrastructure projects like rail, ports, and airports while highlighting the positive impacts of renewables and ICT.
Visit the themes on Large Infrastructure and Leapfrogging for our conceptualisation and details on the scenario structure and interventions.
Ethiopia has an underdeveloped infrastructure, including roads, transportation systems, electricity, supply chain logistics, water and sanitation facilities, and mobile and internet communication services. These deficiencies hinder access to many regions, complicate the import and export of goods, and reduce the country's global competitiveness.
In 2022, Ethiopia ranked 48 out of 54 African countries on the African Infrastructure Development Index (AIDI). Poor infrastructure coverage and low quality in Ethiopia increase transaction costs and lower the return on capital and work, discouraging domestic and foreign investment and constraining economic growth. Poor infrastructure coverage also has a negative impact on poverty reduction.
Ethiopia's road and rail infrastructure are poor, hindering the efficient movement of goods and people. Access to many rural regions is limited, restricting trade and slowing economic integration. In 2023, only 15.7% of Ethiopia’s total roads were paved. With only 27.5% of Ethiopia’s rural population living within two kilometers of all-season (or all-weather) roads this is far below the average of nearly 40% for low-income Africa. Since as much as 77% of Ethiopia’s population lives in rural areas, this translates into a high degree of isolation and inability to take goods to market, children to school and generally to integrate rural areas into the economy.
The country's large geographical expanse and the wide dispersion of the rural population make addressing this issue particularly difficult. Moreover, the current transport network is insufficient to meet the demands of the country’s expanding population and industrial sector. The country’s conflicts have worsened the situation, as many infrastructures were damaged. On the Current Path, about 38.3% of Ethiopia’s population will have access to all-season roads by 2043 – a 10.8 percentage increase compared to 2023.
Despite its vast hydropower potential, Ethiopia ranked 32 out of 48 sub-Saharan African countries in terms of electricity access deficit in 2023. Ethiopia’s electricity grid is unreliable and fails to reach many of its regions. Frequent power outages and inconsistent supply negatively impact manufacturing productivity and disrupt businesses nationwide.
About 47.2% of the Ethiopian population had no access to electricity in 2023 – slightly above the average of 43.1% for Africa. On the Current Path, the percentage of Ethiopians without access to electricity will drop to 18.5% by 2043. The percentage of the rural population with electricity will increase to 72.4% in 2043, from 40.4% in 2023. The Grand Ethiopian Renaissance hydroelectric project represents Ethiopia's drive to reshape its energy sector and accelerate economic progress. With a planned capacity of 6 450 megawatts, the dam is set to significantly expand Ethiopia's electricity supply, reduce poverty, and position the country as a regional energy exporter.
Limited access to and poor quality of digital connectivity also limits Ethiopia's growth potential. In 2023, the mobile broadband subscriptions per 100 people were about 31.8, against an average of 37.2 for low-income Africa.
Addressing these infrastructure gaps is crucial for improving Ethiopia's global competitiveness, supporting industrial growth and fostering sustainable economic development. Better infrastructure will facilitate trade, boost agriculture production, enhance tourism, reduce poverty and boost shared prosperity for all citizens.
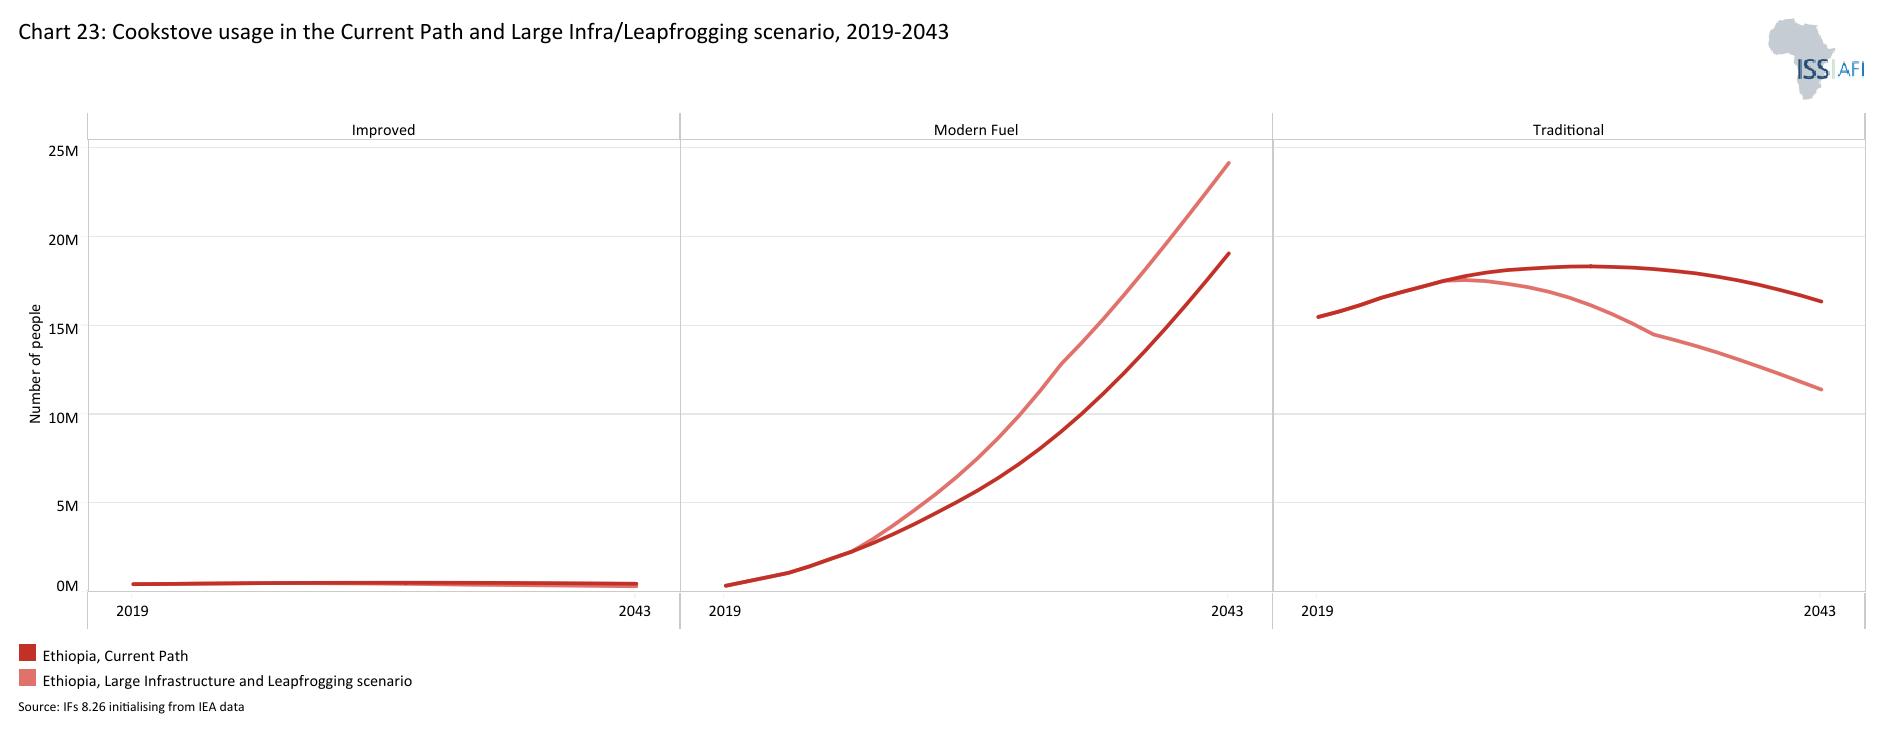
Chart 23 presents the number of people using cookstoves in the Current Path and in the Large Infrastructure and Leapfrogging scenario, from 2019 to 2043.
Due to limited electricity access in Ethiopia, particularly in rural areas, most households continue to rely on inefficient energy sources for cooking. About 85% of the Ethiopian population uses traditional biomass (i.e., fuel wood and animal dung) and inefficient traditional cookstoves that can cause sickness and even death.
Biomass is one of the renewable energy sources; however, in Ethiopia it is being overused in a way that limits its regeneration capacity. Sustainability is a fundamental problem in addition to health threats. It is, therefore, very concerning that the percentage of households that use traditional cookstoves will still be at 45.6% by 2043, although down from 89.7% in 2023.
However, in the Large Infrastructure and Leapfrogging scenario, the percentage of households that use traditional cookstoves will be 31.8%, while the share of households using modern cookstoves will be 67.3% by 2043, compared to the Current Path of 53.1% in the same year.
These findings imply that increasing access to energy and electricity or off-grid renewable energy solutions, especially in rural areas, could contribute to reducing emissions by shifting households away from traditional cooking methods to modern ones.
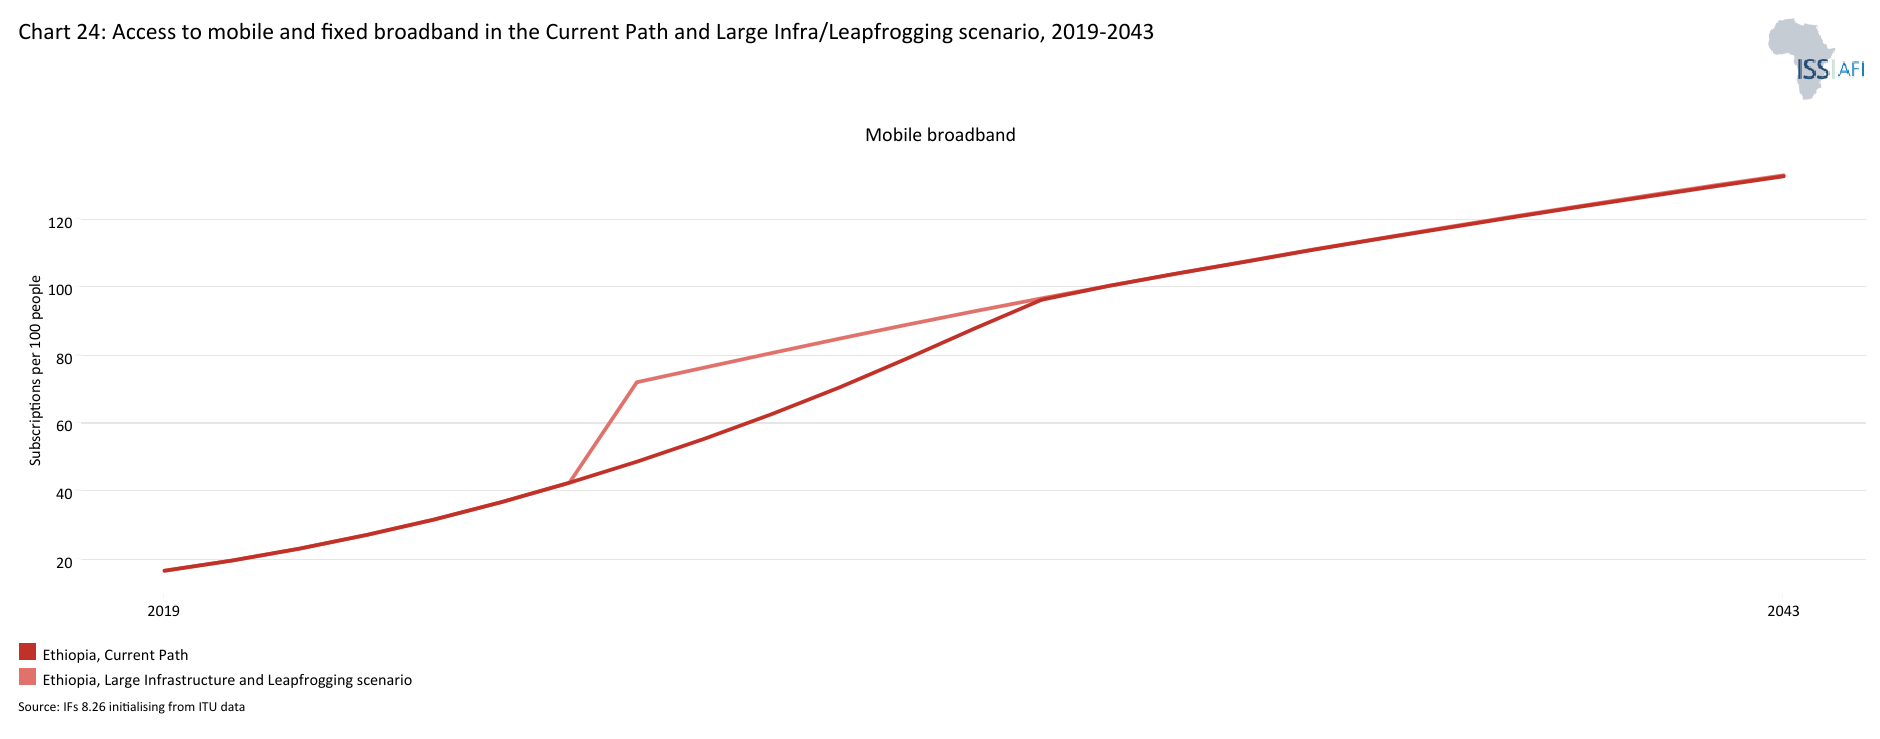
Chart 24 presents the percentage of the population and number of people with access to mobile and fixed broadband in the Current Path and in the Large Infrastructure and Leapfrogging scenario, from 2019 to 2043. The user can toggle between mobile and fixed broadband.
Mobile broadband in Africa is rapidly expanding, but fixed broadband lags behind. Fixed broadband provides faster internet access speeds with more secure connections and is important for higher-value-added service sectors. Since 2018, Ethiopia has been liberalising its telecommunications sector to improve internet services, enhance competition and foster economic growth.
On the Current Path, mobile broadband subscriptions per 100 people in Ethiopia will increase to 132.7 by 2043. In the Large Infrastructure and Leapfrogging scenario, mobile broadband subscriptions will increase slightly to 133 by 2043, equivalent to a 0.3 subscriptions per 100 people increase relative to the Current Path. Whilst fixed broadband subscriptions will increase to 22.3 per 100 people (in the scenario) by 2043, compared to 18.7 per 100 people in the Current Path.
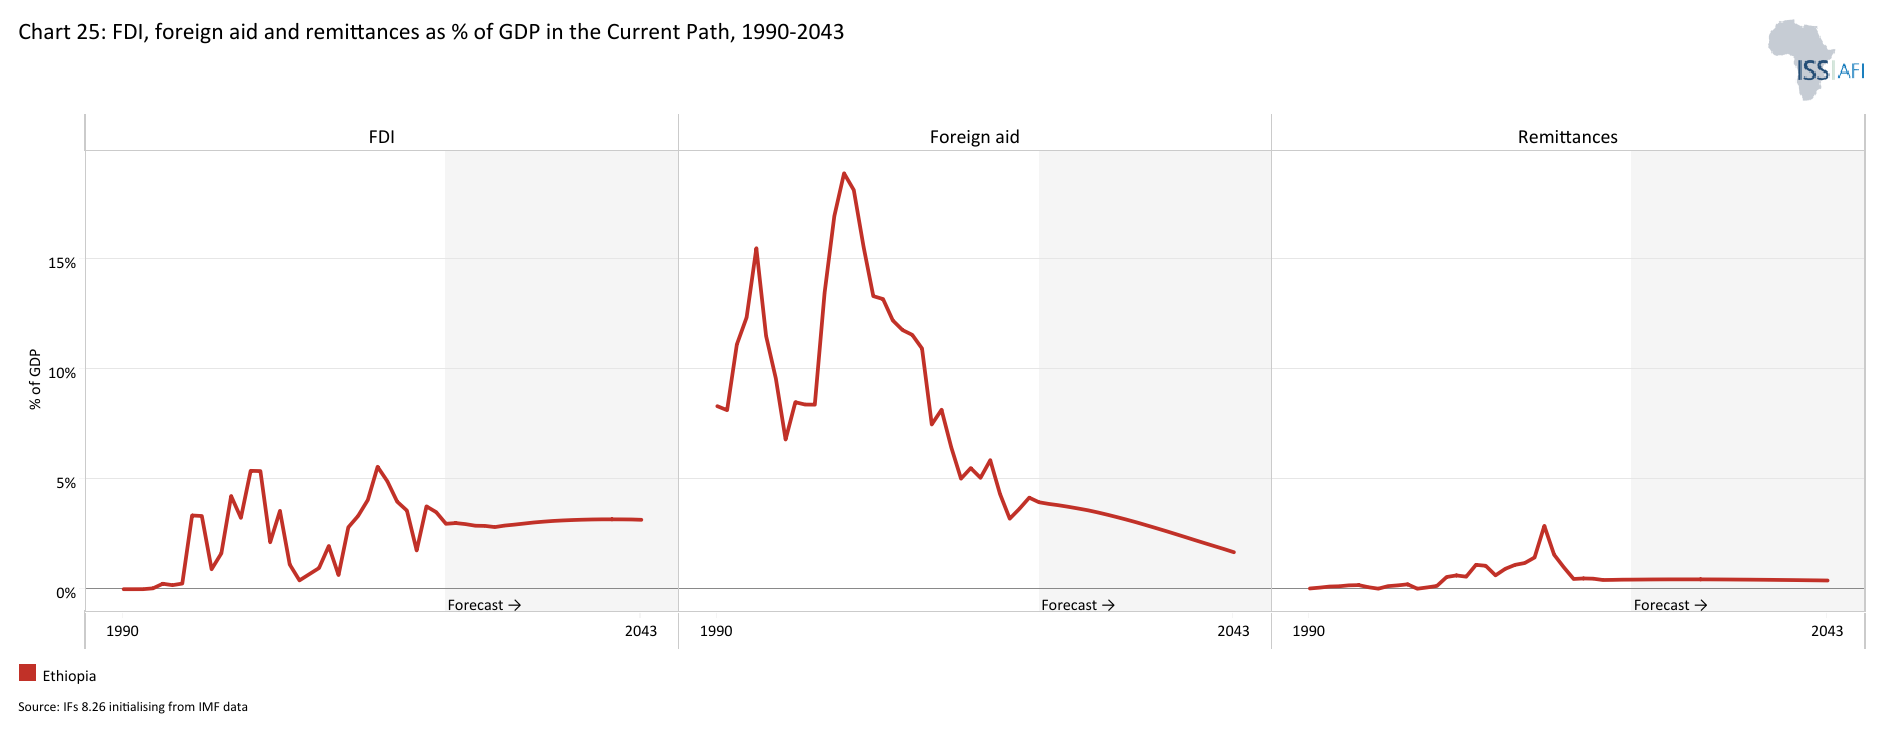
Chart 25 presents the trends in FDI, aid and remittances as a percentage of GDP, from 1990 to 2043.
The Financial Flows scenario represents a reasonable but ambitious increase in inward flows of worker remittances, aid to poor countries and an increase in the stock of foreign direct investment (FDI) and additional portfolio investment inflows. We reduce outward financial flows to emulate a reduction in illicit financial outflows.
Visit the theme on Financial Flows for our conceptualisation and details on the scenario structure and interventions.
Despite the impacts of the recent global crises (e.g., the COVID-19 pandemic, climate change, and the current Russia—Ukraine war) on foreign aid, many countries in sub-Saharan Africa are still heavily dependent on foreign aid to fund the provision of basic services like education and health. This is the case in Ethiopia, foreign aid is one of its sources of physical capital accumulation.
Ethiopia is a large recipient of aid inflows into the Horn of Africa. Net aid receipts constituted roughly 4% (equivalent to US$4.7 billion) of the country's GDP in 2023, below the average of 7.8% of GDP for low-income Africa. On the Current Path, Ethiopia's net aid receipts as a percentage of GDP will decline to 1.7% (equivalent to US$7.7 billion) by 2043 due to rapid economic growth.
FDI can act as a catalyst for economic development, bringing much-needed capital and technology to recipient countries. FDI flows to Ethiopia during the years 2018 and 2023 were volatile due to the global COVID-19 pandemic and unsecure political conditions. FDI inflows to Ethiopia as a percentage of GDP decreased to 3% in 2023, down from 4% of GDP in 2018. The FDI inflows to Ethiopia dropped below the average of 3.8% of GDP for low-income Africa in 2023. On the Current Path, FDI inflows to Ethiopia will increase to about 3.2% of GDP by 2043 – a 0.2 percentage points increase compared to 2023.
The Ethiopian government has recently implemented several policies and reforms to attract more FDI, especially to the manufacturing sector, i.e., the construction of industrial parks. However, FDI inflows still remain below the level that could be a game changer for the country’s development, probably due to political instability and poor business climate.
International remittances are an essential source of foreign exchange for Ethiopia. Remittance flows to Ethiopia amounted to US$522 000 in 2023 (equivalent to 0.4% of GDP), below the average of 2.1% of GDP for low-income countries in Africa. Across the forecast horizon, Ethiopia remains a net recipient of remittances, with inflows amounting to US$1.8 billion by 2043.
Chart 26 presents government revenue in the Current Path and in the Financial Flows scenario, from 2023 to 2043. The data is in US$ 2017 and % of GDP.
Wagner's law, or the law of increasing state activity, is the observation that public expenditure increases as national income rises. It is reasonable to expect that government revenues will increase as a per cent of GDP in the Financial Flows scenario compared to the Current Path forecast.
In the Financial Flows scenario, government revenue increases to reach 17.1% of GDP by 2043 (US$80.2 billion), up from 14.1% (US$16.9 billion) in 2023. This will be 0.2 percentage points of GDP above the Current Path in 2043.
There are several possible explanations for the positive relationship between capital inflows and government revenue. One is direct: an increase in aid leads to more funds available for the government to deliver public services. Another is indirect: greater inflows are linked to higher tax revenue, as foreign direct investors often demonstrate strong tax compliance or are liable for natural resource taxes. Additionally, higher inflows may contribute to increased economic growth, which in turn boosts government revenues.
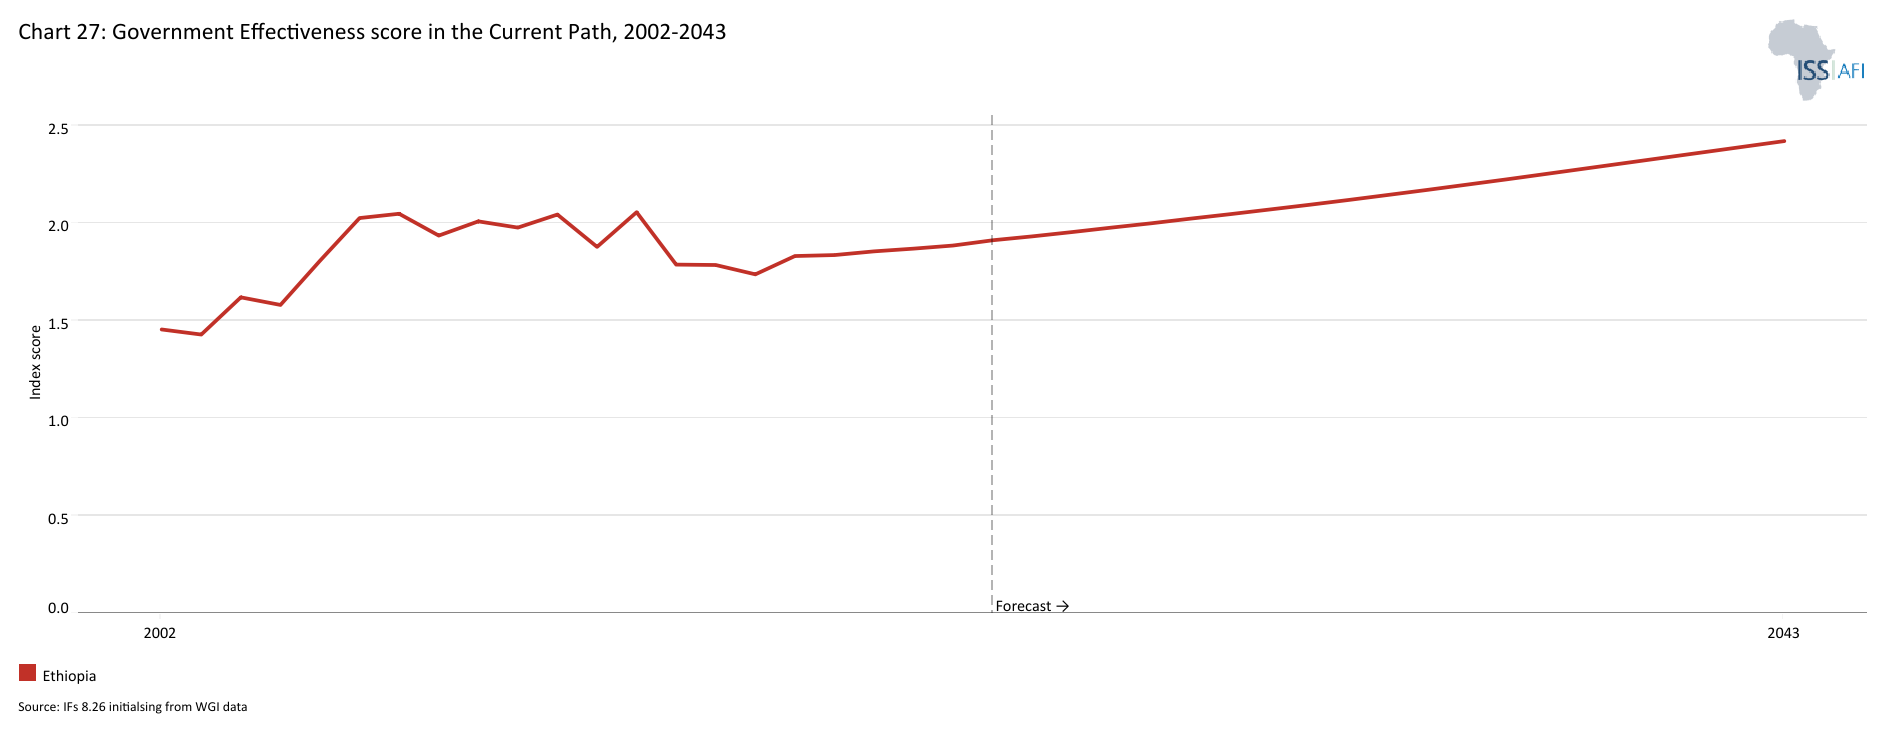
Chart 27 presents the Current Path of government effectiveness, from 2002 to 2043.
Good governance is crucial for economic advancement. Enhanced national security and stability foster a favourable environment for both domestic and foreign investment, allowing governments to implement sustainable development strategies more successfully.
Poor governance, widespread corruption and a deeply conflict-ridden society have hindered Ethiopia's development. The country's recent history has been marked by instability, pervasive corruption and an entrenched system of patronage that affects all sectors of society. According to the 2022 Ibrahim Index of African Governance (IIAG) report, Ethiopia scored 46 out of 100 in overall governance, ranking 32 out of 54 in Africa, a lower score than the average of 48.9 for Africa. A score of 100 represents the complete delivery of political, social and economic public goods and services that citizens expect from their government, and which the state is responsible for providing. According to the report, security and the rule of law have deteriorated significantly since 2012 following the death, in office, of Prime Minister Meles Zenawi who had presided over the country since the overthrow of the Derg in 1991.
Key international governance indicators point to ongoing, widespread and deeply entrenched corruption. In November 2022, Prime Minister Abiy stated that “corruption has become a threat to our national security.” The country is currently undergoing reforms, and several public officials have been prosecuted for corruption.
According to the global Corruption Perceptions Index (CPI) 2023 by Transparency International, Ethiopia, with a score of 37 out of 100, occupies 98th position out of the 180 countries surveyed – a decline in score from 39 in 2021. A lower score means high corruption, while a higher score of 100 means very clean (no corruption). This high level of corruption, combined with limited public administration capacity, centralised resources and decision-making in the capital, low revenue levels, and the country's vast size, ethnic diversity and sparely populated and arid lowlands, weakens the government's effectiveness in delivering services. Several structural challenges, including civil conflicts, widespread poverty, high population growth and climate change, constrain the country's governance capacity.
In terms of government effectiveness, as measured by the World Bank, Ethiopia scored 1.9 out of 5 in 2023, an increase from 1.3 in 2000. The country performs moderately well compared to the average for Africa low-income countries. The Ethiopian government has prioritised investments in public services, focusing on infrastructure, healthcare and education. These initiatives align with the country’s long-term development objectives and have contributed to improved social sector outcomes. Despite challenges, Ethiopia has demonstrated a capacity for effective policy formulation and implementation, especially in large-scale projects like the Grand Renaissance hydro and telecommunications liberalisation. On the Current Path, Ethiopia’s Governance effectiveness score will increase to 2.4 (out of 5) by 2043, above the average score of 1.7 for low-income African countries.
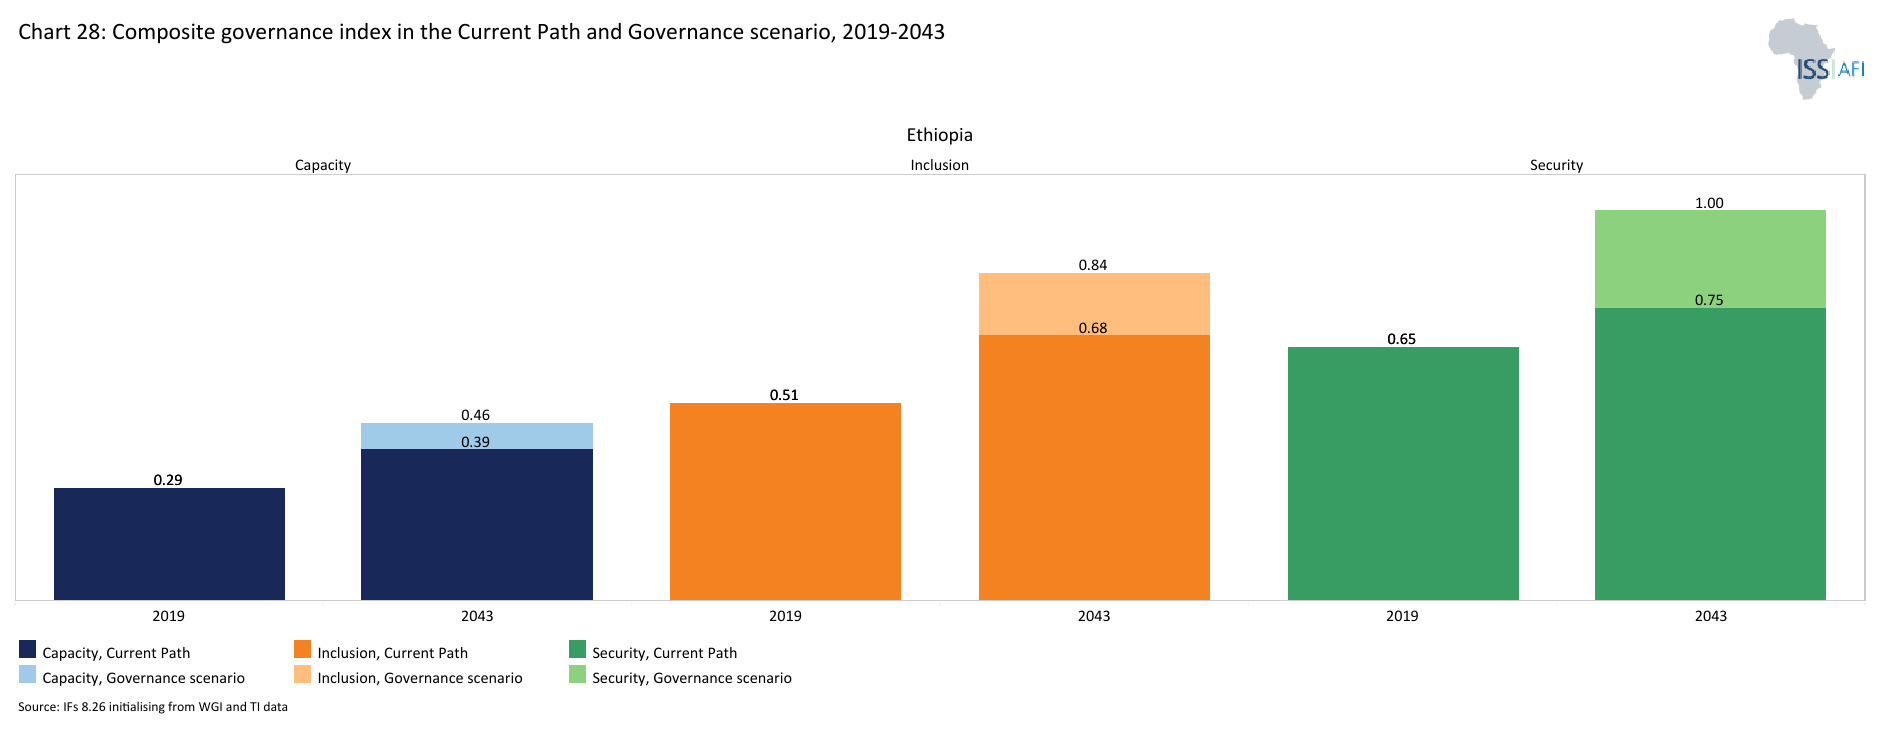
Chart 28 presents the composite governance index for the Current Path versus the Governance scenario, from 2023 to 2043.
This scenario assumes better governance: stability, capacity, and inclusion. It measures a state’s progress using the average of these three indices. To this end, it includes an index (0 to 1) for each dimension, with higher scores indicating improved outcomes.
Visit the theme on Governance for a full conceptualisation and details on the scenario structure and interventions.
The security dimension measures the probability of intra-state conflict and the general level of risk. The second dimension, capacity, is related to government revenue, corruption, regulatory quality, economic freedom, and government effectiveness. The third dimension, inclusiveness, measures the level of democracy and gender empowerment.
Ethiopia performs poorly in terms of capacity compared to other dimensions of governance, with a score of 0.3 out of 1 in 2023. This reflects the low level of government revenue, endemic corruption, poor regulatory quality, and weak government effectiveness. For instance, Ethiopia's tax-to-GDP ratio in 2023 (10.1%) was lower than the average of 17.9% for Africa.
The worsening security situation in Ethiopia has also resulted in a higher portion of government spending being directed towards national defence. The country’s military expenditure as a percentage of GDP increased from 0.5% of GDP in 2020 to 0.9% in 2022, however far below the average of around 1.5% for Africa low-income countries in 2022. Ethiopia performs better in terms of security (0.7 out of 1) compared to other dimensions of governance. However, it remains vulnerable to civil conflicts and violence.
On the Current Path, Ethiopia will make progress in all three dimensions (capacity, inclusion and security) of governance. As a result, the country’s score on the composite governance index, which is a simple average of the three dimensions of governance mentioned above, will be about 21.5% higher in 2043 than its level in 2023 and slightly above the average for Africa low-income countries. In the Governance Scenario, the overall governance performance of Ethiopia will be 26.7% higher than the Current Path by 2043.
Chart 29 presents GDP per capita in the Current Path and each of the eight sectoral scenarios plus the synergistic effect. The data is from 2019 with a forecast to 2043 in purchasing power parity.
The Combined scenario combines all eight sectoral scenarios: Governance, Demographics and Health, Education, Large Infrastructure and Leapfrogging, Agriculture, Manufacturing, AfCFTA, and Financial Flows. This section compares the impacts of each sectoral scenario on GDP per capita. Ethiopia's GDP per capita increases in all eight scenarios.
The Governance scenario has the most significant positive impact on GDP per capita with an increase of US$564 per person above the Current Path in 2043. The second, third and fourth most significant impact of the GDP per capita is achieved in the Manufacturing scenario, US$222, above the Current Path, the AfCFTA and Agriculture scenarios with an increase of US$174 (each) above the Current Path. The Large Infrastrucure and Leapfrogging and the Financial Flows scenarios will have the least impact in terms of GDP per capita, with an increase of US$72 and US$71 (respectively) compared with the Current Path in 2043.
These sectors are not isolated; rather, they are closely interconnected. For instance, infrastructure and human capital development play a key role in driving industrialisation and economic diversification. Likewise, the construction of rural roads is essential for the commercialisation of agriculture and achieving food self-sufficiency. Agriculture can also serve as a foundation for manufacturing through agro-processing, while improvements in governance and security impact all sectors. As such, a comprehensive or coordinated policy approach across industries is the most effective way to achieve inclusive, sustained growth in Ethiopia. The Combined scenario, therefore, integrates all sectoral strategies, representing a unified development effort to overcome the critical barriers to long-term, inclusive growth and development in Ethiopia.
The Combined scenario has a much greater impact on GDP per capita than the individual thematic scenarios. By 2043, Ethiopia's GDP per capita (PPP) will be US$6 266 (or US$1 714 larger than in the Current Path), indicating that an integrated push across all the development sectors could significantly improve Ethiopians’ living standards.
Chart 30 presents poverty in the Current Path and for each scenario, from 2019 to 2043. The data is for the number of people and as a % of the population. The user can select the number of extremely poor people or the percentage of the population.
All the scenario interventions contribute to poverty reduction in Ethiopia, however, the Governance scenario has the most significant impact on reducing extreme poverty by 2043. Under this scenario, the extreme poverty rate will fall to about 1.5% by 2043, compared to nearly 2.3% (equivalent to about 4.5 million Ethiopians) in the Current Path. This reduction will be equivalent to about 1.5 million fewer Ethiopians living in poverty (at US$2.15) than the Current Path by 2043.
Good governance, exemplified by the control of corruption and the creation and implementation of effective regulatory policies, greatly enhances the ability of the poor to engage in and benefit from economic growth. Corruption, for example, harms the poor by diminishing the government's capacity to distribute public services efficiently and fairly.
The Education, Agriculture, and Manufacturing scenarios follow the Governance scenario in terms of poverty reduction. By 2043, the extreme poverty rate will be 1.78% under the Education scenario, equivalent to about 1.02 million fewer Ethiopians in extreme poverty. Education is frequently called the great equaliser, as it can provide access to jobs, resources and skills that enable individuals not just to survive but to thrive, but it takes up to a generation to have real effect.
In the Agriculture scenario, the extreme poverty rate will be 1.8%, compared to the Current Path of 2.3% for the same period. This will be equivalent to 967 million fewer Ethiopians under extreme poverty relative to the Current Path by 2043. Given that agriculture employs 63% of Ethiopia’s workforce, increasing productivity in this sector could boost incomes for millions and significantly reduce poverty.
In the Manufacturing scenario, extreme poverty will be reduced to about 1.85% of the Ethiopian population by 2043. This will be equivalent to 869 000 fewer Ethiopians than the Current Path in 2043. As in many other African countries, a significant portion of impoverished individuals in Ethiopia are trapped in low-productivity sectors and informal sector activities. Developing the manufacturing sector can promote inclusive growth by facilitating the movement of low-income individuals into higher-productivity areas. This shift not only increases incomes but also initiates a positive cycle, where the expansion of productive employment, skill development and earnings mutually reinforce each other, driving economic growth and reducing poverty.
In the AfCFTA, Financial flows, Large Infrastructure and Leapfrogging, and Demographics and Health scenarios, 2.08% (413 000 fewer people), 2.1% (363 000), nearly 2.2% (247 000) and 2.2% (176 000) Ethiopians will be lifted out of extreme poverty relative to the Current Path by 2043, respectively.
In the Combined scenario, by 2030, about 6.8% of Ethiopians will be living in extreme poverty (at US$2.15) compared to 8.2% in the Current Path. This represents about 2.2 million fewer Ethiopians living in extreme poverty compared to 12.5 million Ethiopians in the Current Path. Although the Combined scenario does not completely eliminate extreme poverty in Ethiopia by 2030, its implementation has a significant impact on reducing extreme poverty in the country. By 2043, extreme poverty in Ethiopia will be at 0.4% compared to 2.9% (4.5 million people) in the Current Path in that year.
Chart 31 presents GDP in the Current Path and in the Combined scenario, from 2019 to 2043. The data is in US$ 2017 and at market exchange rates.
In the Combined scenario, the average growth rate between 2026 and 2043 will be 9.6%, compared with 7% on the Current Path over the same period. The 2043 growth rate will be 10.2% in the Combined scenario, compared to a growth rate of 7.3% on the Current Path. The size of the Ethiopian economy measured in GDP (at MER) will be US$250.7 billion larger than the Current Path in 2043.
Chart 32 presents the value added by sector in the Current Path forecast and in the Combined scenario, from 2019 to 2043. The data is in US$ 2017 and as a % of GDP.
Our modelling provides forecasts in six economic sectors namely agriculture, energy, materials (including mining), manufactures, services and ICTech.
In the Combined scenario, the absolute value added will increase relative to the Current Path by 2043 for all sectors (agriculture, energy, ICT, manufacturing, materials, and services). Valued-added gain as a percentage of GDP would increase the service and ICT sectors only.
The service sector will have the largest value-added gain of US$163 billion relative to the Current Path by 2043. The sector share gain as a percentage of GDP would increase by 0.5% (relative to the Current Path) to account for 64.1% of Ethiopia’s GDP by 2043.
The absolute value added in manufacturing will increase by US$44.2 billion relative to the Current Path. However, its share as a percentage of GDP would decrease to nearly 18%, compared to about 18.2% on the Current Path by 2043.
In terms of absolute value added, the manufacturing sector will be followed by the ITC, agriculture, materials, and energy sectors, respectively. The value added of these sectors would increase by US$18.5 billion, US$18.1 billion, US$5.2 billion, and US$749 000 (respectively) relative to the Current Path by 2043.
The percentage share of the ITC sector would increase by nearly 0.6% of GDP (equivalent to US$19.1 billion) to account for about 6.6% of GDP, while for agriculture, materials and energy, the percentage share would decrease by about 0.6%, 0.3%, and 0.25% (respectively) relative to the Current Path to account for about 8.4%, 2.2%, and 0.8% of Ethiopia’s GDP, respectively.
Chart 33 presents the size of the informal sector as percentage of the total economy in the Current Path and in the Combined scenario, from 2019 to 2043.
The informal economy is the predominant source of employment and livelihood opportunities in Ethiopia. However, workers in this sector face significant decent work challenges, such as limited access to public social protection. Ethiopia’s informal economy is well-structured, with two-thirds of workers belonging to associations, cooperatives, or indigenous organisations like Iddirs (insurance) or Eqqubs (savings). Many informal workers join social groups to access social services, and trade unions may offer organisational support.
Many informal workers' organisations are primarily local, which limits their capacity to engage in national policymaking, decision-making or social dialogue. Despite this, they play a vital role in civil society by strengthening communities, providing economic and financial services, and expanding social protection.
With limited formal sector opportunities, most of Ethiopia's workforce is employed in the informal sector, 54.4% in 2023, and forecasted to decrease to about 46.2% by 2043 on the Current Path. In the Combined scenario, the share of informal labour in the total workforce will decrease to about 33.4% - a 12.8% percentage points below the Current Path by 2043, as the economy formalises. The size of Ethiopia's informal economy will be 19.3% of GDP in the Combined scenario – 5.4 percentage points below the Current Path forecast in 2043.
Chart 34 compares life expectancy in the Current Path with the Combined scenario, from 2019 to 2043.
Life expectancy in Ethiopia has significantly improved since the 2000s, with females' life expectancy being higher than males' over the time horizon. As of 2023, life expectancy was estimated at 70.6 years (combined average), 72.5 for females, and 68.7 for males. These numbers are significantly higher than the average for Africa’s lower-middle-income countries
In the Current Path, life expectancy in Ethiopia will increase to 76.3 years—78.5 years for females and 74.5 years for males by 2043. In the Combined scenario, life expectancy would increase to 78.3 years—80.1 years for females and 76.6 for males in 2043, further extending the extent to which Ethiopians will experience longer life expectancy compared to other African countries at similar levels of development.
Chart 35 compares the Gini coefficient in the Current Path with the Combined scenario, from 2019 to 2043.
The Gini index measures a country's level of income inequality by assessing the distribution of income or wealth among its population. The coefficient of the Gini index ranges from 0 (or 0%) to 1 (or 100%), with 0 representing perfect equality and 1 representing perfect inequality
With a Gini coefficient of 0.35 in 2023, Ethiopia has lower inequality than most other African countries, ranking 9th out of 54. Unlike other rapidly growing developing countries, Ethiopia has not significantly experienced an increase in inequality as measured by the Gini coefficient index.
In most developing countries, the most vulnerable people experience fewer benefits from economic growth than those in medium-higher income deciles. This highlights the potential policy trade-offs between growth and inequality. The government of Ethiopia’s development plans have been strongly focused on inclusive growth and increased spending aimed at benefiting the poor.
On the Current Path, income inequality in Ethiopia will slightly increase with a Gini coefficient of 0.355 by 2043. The Combined scenario would, however, generate more inclusive growth and improve income distribution in the country. In the combined scenario, the Gini index will decline to 0.339 by 2043.
Chart 36 compares carbon emissions in the Current Path with the Combined scenario from 2019 to 2043.
Carbon emissions cause climate change, see the climate theme. In 2023 Ethiopia released about 8 million tons of carbon, which accounted for about 1.8% of Africa’s total carbon emissions in that year. On the Current Path, Ethiopia will emit 35 million tons of carbon, accounting for about 4.2% of Africa's carbon emissions by 2043. Africa emitted about 456 million tons of carbon, which was just 4.6% of the world's total carbon emissions in 2023.
While carbon emissions are expected to rise with increased economic activity in Ethiopia, the country's emissions start from a very low level. Like many other African countries, Ethiopia will disproportionately face the impacts of climate change, despite contributing very little to it. However, Ethiopia still needs to reduce its emissions and transition to renewable energy to ensure sustainable growth and help mitigate climate change.
The Combined scenario will increase Ethiopia’s carbon emissions to 47 million tons by 2043 –about 38.2% above the Current Path by 2043. The Governance, AfCFTA and Manufacturing scenarios will have the largest contribution (respectively) to carbon emissions in 2043. The Demographics and Health scenario would reduce carbon emissions below the Current Path over the forecast horizon.
Chart 37 compares energy demand and production in the Current Path forecast with the Combined scenario from 2019 to 2043. Production is done in six types, namely oil, gas, coal, hydro, nuclear and other renewables. The data is converted into billion barrels of oil equivalent (BOE) to allow for comparisons. Note that energy production could be for domestic use or for export.
Next to DR Congo, Ethiopia has the largest potential hydropower in Africa, estimated at 45GW and has the largest hydroelectric power plant in Africa and one of the most ambitious infrastructure projects on the continent - the Grant Renaissance dam. Its construction started in 2011 and has been a centerpiece of Ethiopia’s development strategy. In February 2022, the first turbine at the Grand Ethiopian Renaissance Dam was officially launched, producing about 375 MW of electricity. A second turbine began operating late in 2022, bringing the total capacity in use to about 750 MW. The dam is expected to be fully operational by 2025 with a total capacity of 5.15 GW.
From an energy perspective, Ethiopia still faces significant challenges. In 2023, Ethiopia produced a total of 122 million billion barrels of oil equivalent (BOE), while energy demand stood at 172 million BOE, creating a deficit of 50 million BOE. The country's main sources of energy production are gas, oil, hydro and renewable energy.
On the Current Path, by 2043 Ethiopia’s total energy production will increase to 184 million BOE, while the demand will increase to 594 million BOE, which will only account for 32.6% of the demand. Thus, the deficit will also continue to widen with time; the energy production will only meet 32.6% of the demand in 2043. Ethiopia will have to import in order to meet the growing demand.
The Combined scenario will increase total energy production to 211 million BOE by 2043, an increase of 27 million BOE compared to the Current Path. The Combined scenario will also increase energy demand by 144 million BOE in 2043. Thus, instead of producing 31% of its energy demand, Ethiopia will produce 36%
Chart 38 summarises the policy recommendations for Ethiopia.
This report highlights the opportunities and current development challenges Ethiopia faces and identifies strategic opportunities to set the country on a course toward inclusive and sustainable growth and development.
The analysis reveals that Ethiopia faces a range of complex, interconnected challenges that have contributed to its economic fragility and hindered sustainable growth and development. Key constraints to the country’s growth include insecurity, higher dependence on agriculture (with low productivity and limited economic diversification), climate change, weak governance, a poor business environment, infrastructure shortages, and limited human capital.
Addressing these issues is essential for placing the country on a trajectory of sustained growth and development. The government needs to implement decisive and targeted actions based on the priority policies outlined below:
- Promote good governance
Ethiopia is at risk from its fragile institutions. Paradoxically, as the country opens up and sheds some of its more authoritarian characteristics, it is likely to actually become less stable in the short to medium term. None is more pressing than finding a way forward in terms of ethnic inclusion and halting a potential downward spiral towards ethnic nationalism and fragmentation.
Authorities should make efforts to find a new political settlement that brings sustainable peace to the country, a critical condition for sustaining growth, and that improves living standards. Ethiopia’s economic development depends more on sustainable growth over long periods than on bursts of explosive growth. While institutional reform is key, it has to happen in a steady and measured way, which is to say genuinely.
The government of Ethiopia must focus on establishing inclusive, transparent and accountable institutions. The existing overcentralised governance, coupled with ineffective government and a lack of accountability, contributes to social exclusion, inequality and conflict. Consequently, the government should prioritise efforts to combat corruption and impunity, enhance public sector administration, improve transparency in the agriculture and manufacturing sectors, and promote the decentralization process to bolster local governance and improve public service delivery.
- Promote economic diversification
Improving the business environment to foster private sector development and attract manufacturing FDI can diversify the economy away from agriculture and enhance formal job creation. This includes supporting light manufacturing, such as agro-processing, and promoting services, particularly within the digital economy.
- Increase agricultural productivity
Ethiopia must continue to invest in productivity-enhancing technologies and ensure farmers' access to high-yield, disease-resistant and drought-resistant seedlings, fertilisers, and credit guarantees. Furthermore, it is crucial to support research and development (R&D) activities focused on enhancing resilience and agricultural productivity. Since access to land, water and other natural resources is a key factor in the rising inter-communal conflicts within the country, Ethiopian authorities should implement a national land policy to ensure the effective, sustainable and equitable use of land. They should also improve the quality and supply of infrastructure to reduce production and transaction costs, improve connectivity and productivity, and boost regional integration and better public service delivery.
- Transform and invest in education
Without improving the quality of education Ethiopia will not be able to build the human capital required to industrialise. Better and more education is a prerequisite and appears to hinge on changes to language policies (a controversial issue hotly debated in Ethiopia), minimum teacher educational requirements and the introduction of modern facilities and practices.
Page information
Contact at AFI team is Blessing Chipanda
This entry was last updated on 14 August 2025 using IFs v8.26.
Reuse our work
- All visualizations, data, and text produced by African Futures are completely open access under the Creative Commons BY license. You have the permission to use, distribute, and reproduce these in any medium, provided the source and authors are credited.
- The data produced by third parties and made available by African Futures is subject to the license terms from the original third-party authors. We will always indicate the original source of the data in our documentation, so you should always check the license of any such third-party data before use and redistribution.
- All of our charts can be embedded in any site.
Cite this research
Blessing Chipanda (2026) Ethiopia. Published online at futures.issafrica.org. Retrieved from https://futures.issafrica.org/geographic/countries/ethiopia/ [Online Resource] Updated 14 August 2025.
