 DR Congo
Feedback welcome
Our aim is to use the best data to inform our analysis. See our About page for information on the IFs forecasting platform. We appreciate your help and references for improvements via our feedback form.
This page presents a comprehensive analysis of the Democratic Republic of the Congo (DR Congo). The analysis outlines the nation's extensive socio-economic challenges and opportunities, examining various developmental paths through 2043. It discusses the significant economic growth potential from its rich natural resources while noting the country's persistent issues with poverty, governance, and infrastructure. Various scenarios consider the impacts of improvements in sectors like agriculture, education, and manufacturing. The analysis aims to provide policymakers and researchers insights to guide DR Congo towards a more prosperous future.
Summary
We begin this page with an introductory assessment of DR Congo’s context looking at the current population distribution and structure, climate and topography.
- DR Congo is the largest country by land area in sub-Saharan Africa, the second-largest in Africa and the 11th-largest in the world. The country has the second-largest tropical rainforest in the world covering more than 992 000 km. It is well known for its abundant and diverse mineral resources (mining is DR Congo’s largest industry), extensive navigable waterways, vast hydroelectric potential and arable land estimated at 80 million hectares. However, in 2021, DR Congo ranked only 49th when comparing GDP per capita (US$903.6 at PPP) in Africa. It is classified as a low-income country. Nearly 70.4% of the population lived in extreme poverty on less than US$2.15 per day (at 2017 prices) in 2021.
This section is followed by an analysis of the Current Path forecast for DR Congo which informs the country’s likely current development trajectory to 2043. It is based on current geopolitical trends and assumes that no major shocks would occur in a ‘business as usual’ future. We also provide an overview of the national development plan
- DR Congo had the 3rd fastest-growing population in Africa (after Seychelles and Niger) and 6th globally in 2022, with an annual population increase of 3.2%. It was the fourth most populated country in Africa (after Nigeria, Ethiopia and Egypt) and the 15th most in the world.
- The country’s economy grew by 8.9% in 2022, driven by increased mining production and high global prices of commodity exports. DR Congo is heavily dependent on commodity trade, particularly oils, copper, cobalt, tin, tungsten and tantalum.
- DR Congo’s GDP per capita is forecast to increase to US$2 605 in 2043, which is equivalent to 84.2% of low-income African countries’ projected average in the same year.
- In 2022, about 72.3% of DR Congo’s population (equivalent to 71.8 million people) lived in extreme poverty, surviving on less than US$2.15 a day. As a result, nearly one-quarter of people who lived in extreme poverty in low-income countries in Africa in 2022 lived in DR Congo.
The next section compares progress on the Current Path with eight sectoral scenarios. The eight sectoral scenarios are Demographics and Health; Agriculture; Education; Manufacturing; the African Continental Free Trade Area (AfCFTA); Large Infrastructure and Leapfrogging; Financial Flows; and Governance. Each scenario is benchmarked to present an ambitious but reasonable aspiration in that sector.
- DR Congo's health sector has been greatly impacted by the country’s protracted conflict, as well as by the continued long-standing complex humanitarian crises in the world. In the Demographics and Health scenario, DR Congo will enter a demographic window of opportunity from 2047, nine years earlier than in the Current Path (or business as usual) forecast.
- DR Congo has more potential agricultural land than any other African country, estimated at 80 million hectares of available arable land. However, only 10% of this is currently being cultivated. In the Agriculture scenario, production in DR Congo will increase by 36.2 million metric tons relative to the Current Path forecast of 119.2 million metric tons in 2043.
- Political instability and conflicts in the 1990s severely affected educational outcomes in DR Congo. In the Education scenario, the mean years of education (15+ age group) will increase to 9.1 years—an increase of about 0.7 years relative to the Current Path forecast in 2043.
- The Manufacturing scenario will reduce the share of Congolese people living below the US$2.15 poverty line from 48.1 million people (in the Current Path forecast) in 2043 to 35.7 million people. This is a 25.7% reduction relative to the Current Path forecast.
- In the African Continental Free Trade Area (AfCFTA) scenario, DR Congo’s trade balance will become positive (a surplus) in the short-medium term, between 2029 and 2035, with a trade surplus of US$1 billion, equivalent to 0.8% of GDP in 2035. This contrasts with the Current Path forecast, which projects a trade deficit of about 2.4% of GDP in 2035. The trade surplus will come from the materials sector. By 2043, the country will have a trade deficit of US$2.2 billion (scenario) compared to US$13.3 billion on the Current Path forecast.
- DR Congo has a very low mobile broadband rate relative to the average of its peers. In 2022, the country had about 26.2 subscriptions per 100 people, well below the average of 32.6 subscriptions per 100 people for low-income African countries. In the Large Infrastructure and Leapfrogging scenario, mobile broadband subscriptions in DR Congo will increase to 125.7 subscriptions per 100 people by 2043, a 0.7% increase relative to the Current Path forecast.
- The conflicts of the 1990s effectively kept foreign investors away from DR Congo. In the Financial Flows scenario, FDI inflows in 2043 will represent about 6.8% of GDP compared to 5.7% in the Current Path forecast.
In 2022, DR Congo's governance effectiveness index was 28.5% below the average for low-income African countries, indicating that DR Congo generally is more poorly governed than most low-income African countries.In the Governance scenario, the gap will reduce to 8.2% relative to the estimated average of its low-income African peers in 2043.
The third section compares the impact of each of the eight sectoral scenarios with one another and with a Combined Agenda 2063 scenario (the sum effect of all eight scenarios).
Progress is measured on various dimensions such as economic size (in Market Exchange Rates), Gross Domestic Product per Capita (in Purchasing Power Power Parity), extreme poverty, carbon emissions, the changes in the structure of the economy, and selected sectoral dimensions such as progress with mean years of education, life expectancy, the Gini coefficient or reductions in mortality rates.
- The first scenario comparison uses GDP per capita. In 2022, DR Congo’s GDP per capita was US$1 133, which was about 39% below the average of Africa’s low-income countries. The Combined scenario will increase the country’s GDP per capita by 61.2% (or US$1 593) above the Current Path forecast of US$2 605 in 2043. Among the sectoral interventions, the Manufacturing scenario will have the most significantly positive impact on GDP per capita, followed by Governance and the AfCFTA scenarios. However, in the short to medium term (2026-2025), the Agriculture scenario will have the largest impact on GDP per capita, followed by the Manufacturing and Infrastructure and Leapfrogging scenarios.
- In the Combined scenario, DR Congo’s GDP per capita will increase by 61% relative to the Current Path forecast by 2043. Its economy will be 73% larger than the Current Path forecast for that year.
- Extreme poverty in DR Congo is very high, with limited responsiveness to growth. In 2022, 71.8 million Congolese people (72.3% of the population) lived below the US$2.15 poverty line for low-income countries. In the Combined scenario, poverty in DR Congo will decrease to 6.6% or 11.2 million people, compared to 26.1% (48.1 million people) in the Current Path forecast by 2043. The Manufacturing, Governance and Education scenarios will have the largest impact on reducing poverty in DR Congo by 2043. In the short term (2026-2030), it will be Agriculture, Manufacturing and the Infrastructure scenarios respectively. DR Congo’s GDP will grow substantially from US$49.4 billion (2022) to US$259.8 billion in 2043 in the Current Path forecast and to US$449.8 billion in the Combined scenario.
- In the Combined scenario, the services, materials and manufacturing sector will dominate DR Congo’s economy in 2043. At the lower end, there will be the energy and ICT sectors, respectively. The services sector will contribute 32.7% to the GDP, while the materials and manufacturing will contribute 30% and 25.3%, respectively.
- In 2022, DR Congo’s informal sector was estimated to account for approximately 41.8% of GDP. The large informal sector is a significant constraint on economic growth. By 2043, the contribution of the informal sector to the country’s GDP will decline to about 33% on the Current Path and to 23.5% in the Combined scenario.
- Life expectancy at birth for the average Congolese person in 2022 was 62.5 years, with females having 2.4 years higher life expectancy than males. In the Current Path forecast, the average life expectancy in DR Congo will increase to 68.1 years in 2043, with female life expectancy 3 years higher than that of males. DR Congo's lower life expectancy is attributed to a relatively high disease burden of both communicable and non-communicable diseases, as well as high levels of stunting. Life expectancy in DR Congo will increase to 69.7 years in the Combined scenario by 2043.
We end this page with a summarising conclusion offering key recommendations for decision-making.
All charts for DR Congo
- Chart 1: Political map of DR Congo
- Chart 2: Population structure in Current Path, 2019–2043
- Chart 3: Population distribution map, 2022
- Chart 4: GDP in MER and growth in the Current Path forecast, 1990–2043
- Chart 5: Size of the informal economy as per cent of GDP and per cent of total labour, 2019-2043
- Chart 6: GDP per capita in Current Path forecast, 1990–2043
- Chart 7: Extreme poverty in Current Path as per cent of population and numbers, 2019–2043
-
Chart 8: National Development Plan
Chart 8: National Development Plan
- Chart 9: Urban and rural population in Current Path and Demographics and Health scenario, 1990–2043
- Chart 10: Infant mortality rate in Current Path and Demographics and Health scenario, 2019–2043
- Chart 11: Demographic dividend in the Current Path forecast and the Demographics and Health scenario, 2019–2043
- Chart 12: Import dependence in the Current Path forecast and Agriculture scenario, 2019–2043
- Chart 13: Mean years of education in Current Path and Education scenario, 2019–2043 15 to 24 age group
- Chart 14: Value-add by the manufacturing sector in Current Path and Manufacturing scenario, 2019–2043
- Chart 15: Trade balance in CP and AfCFTA scenario, 2019–2043
- Chart 16: Cookstove usage in Current Path and Infra/Leapfrogging scenario, 2019–2043
- Chart 17: Access to mobile and fixed broadband in Current Path and Infra/Leapfrogging scenario, 2019–2043
- Chart 18: Government revenue in Current Path and Financial Flows scenario, 2019–2043
- Chart 19: Composite governance index in Current Path vs Governance scenario, 2019–2043
- Chart 20: GDP per capita in Current Path and scenarios, 2019–2043
- Chart 21: Poverty in Current Path and scenarios, 2019–2043
- Chart 22: GDP (MER) in Current Path and Combined Agenda 2063 scenario, 2019–2043
- Chart 23: Value added by sector in Current Path and Combined Agenda 2063 scenario, 2019–2043
- Chart 24: Informal sector as % of total economy in Current Path and Combined Agenda 2063, 2019–2043
- Chart 25: Life expectancy in Current Path and Combined Agenda 2063 scenario, 2019–2043
- Chart 26: Domestic Gini in Current Path and the Combined Agenda 2063 scenario, 2019–2043
- Chart 27: Carbon emissions in Current Path and in Combined Agenda 2063 scenario, 2019–2043
- Chart 28: Energy demand and production by type in Current Path forecast and Combined Agenda 2063 scenario, 2019-2043
- Chart 29: Recommendations
-
Chart 30: List of interventions
Chart 30: List of interventions
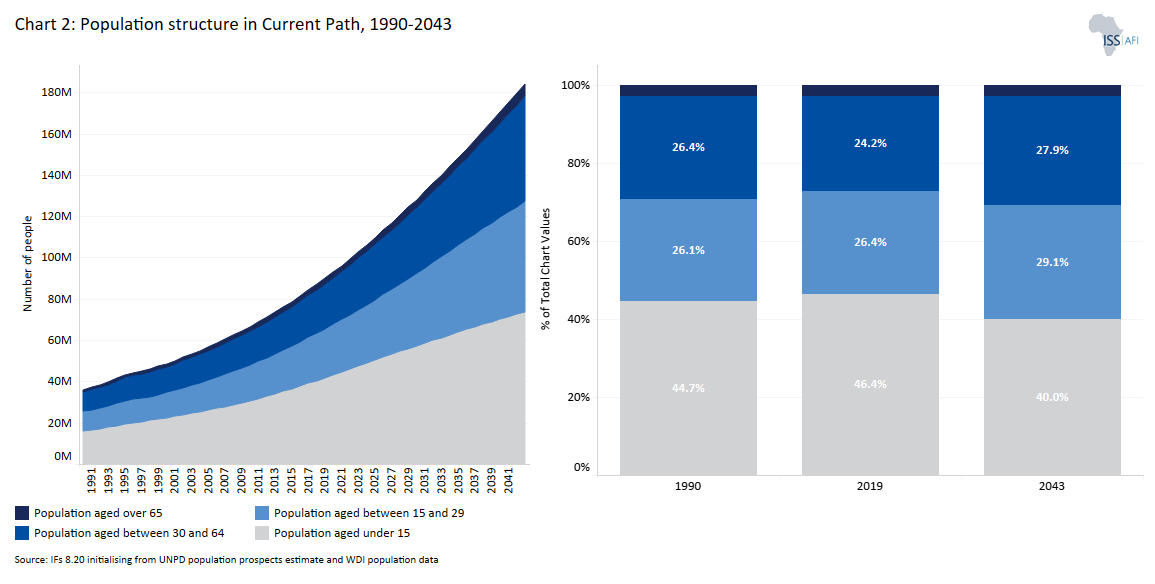
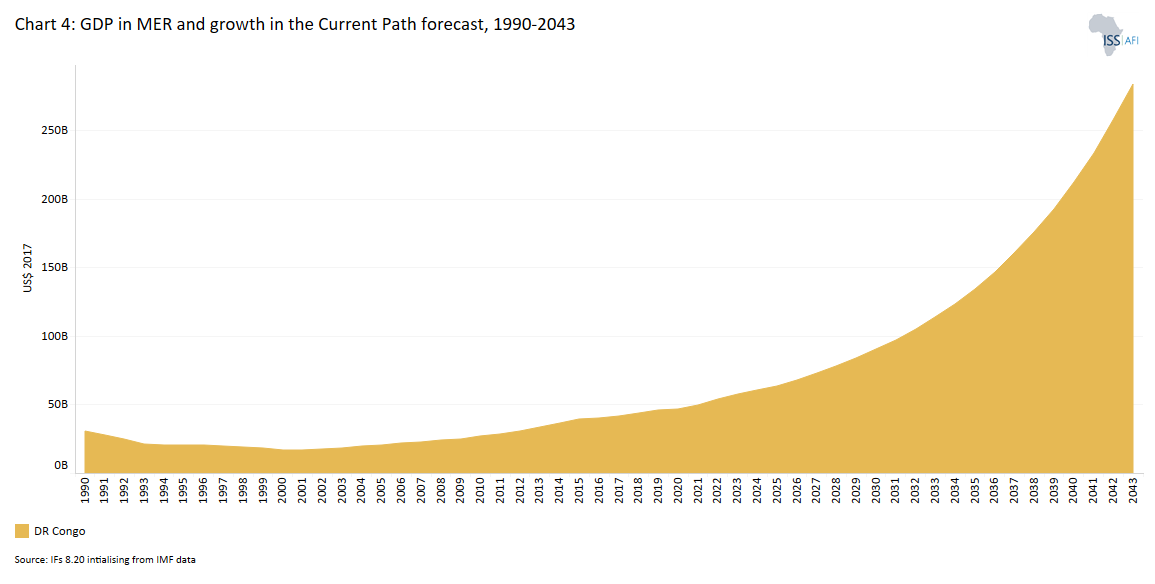
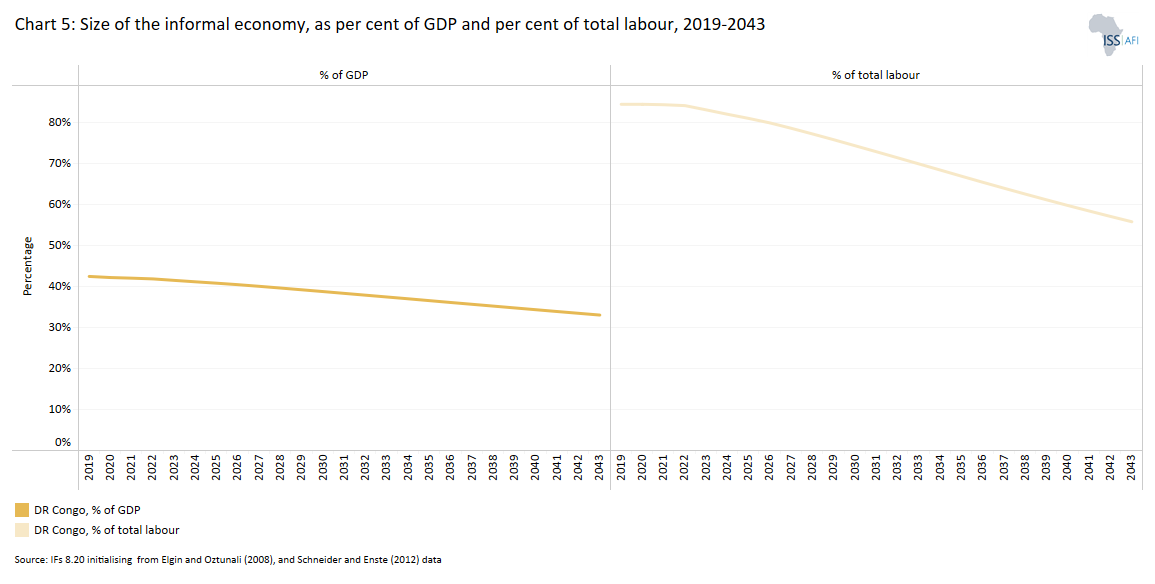
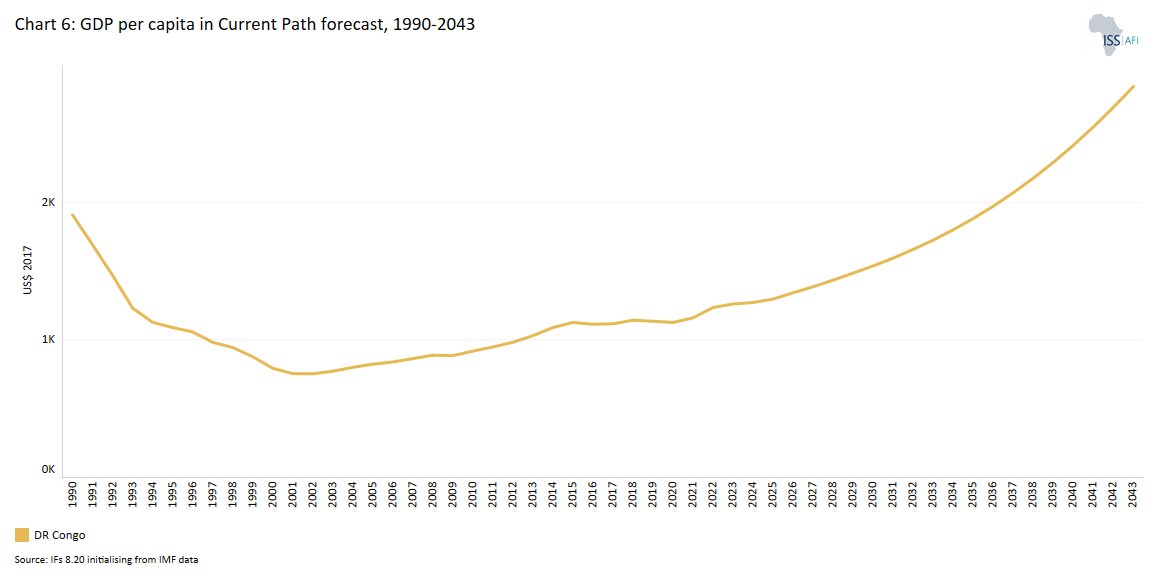
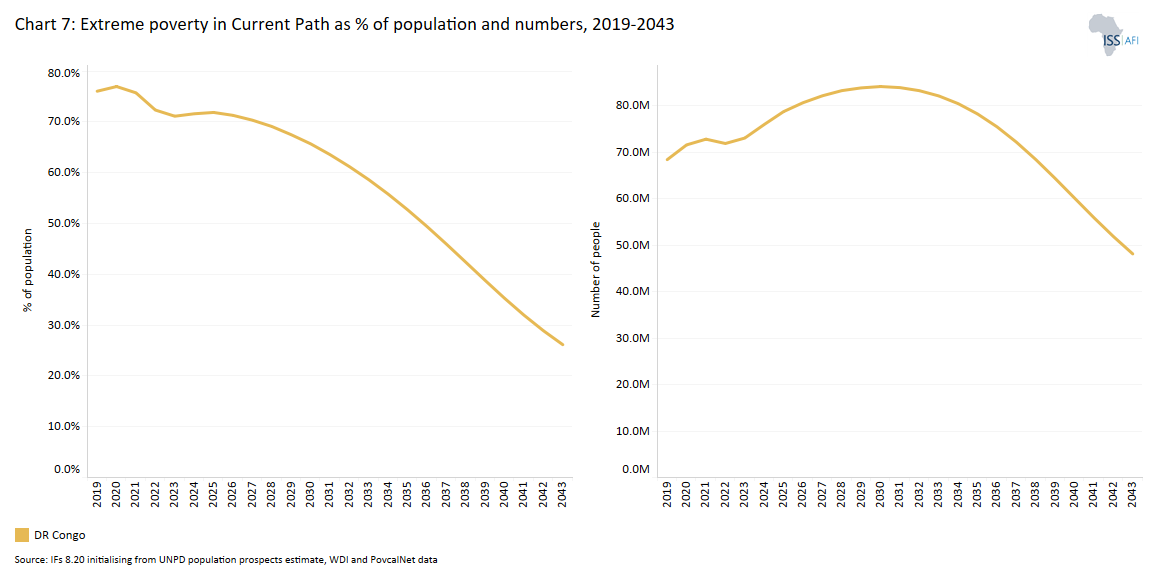
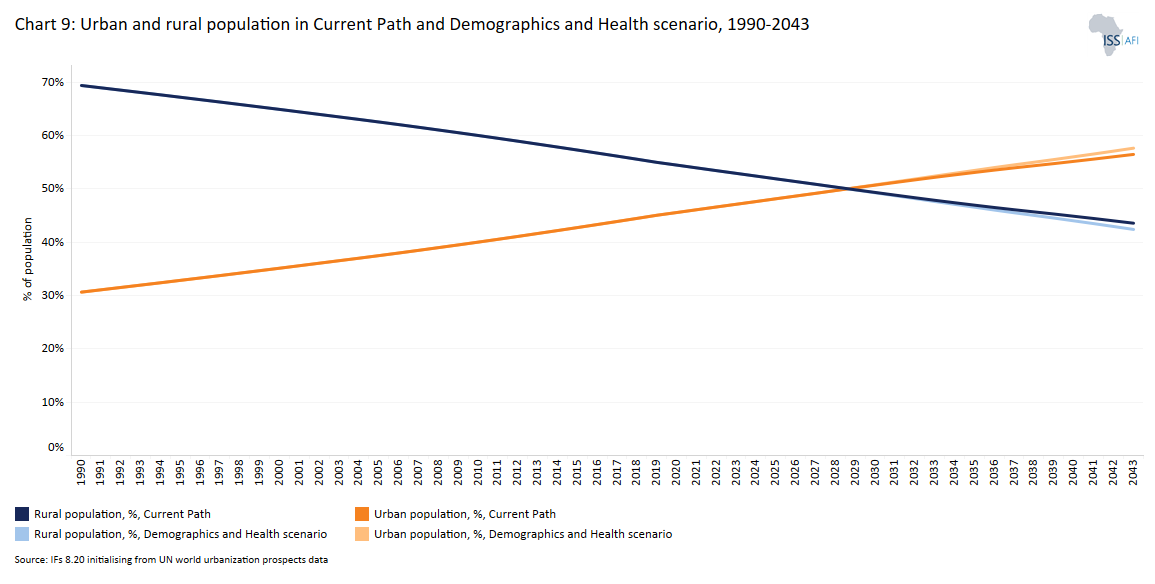
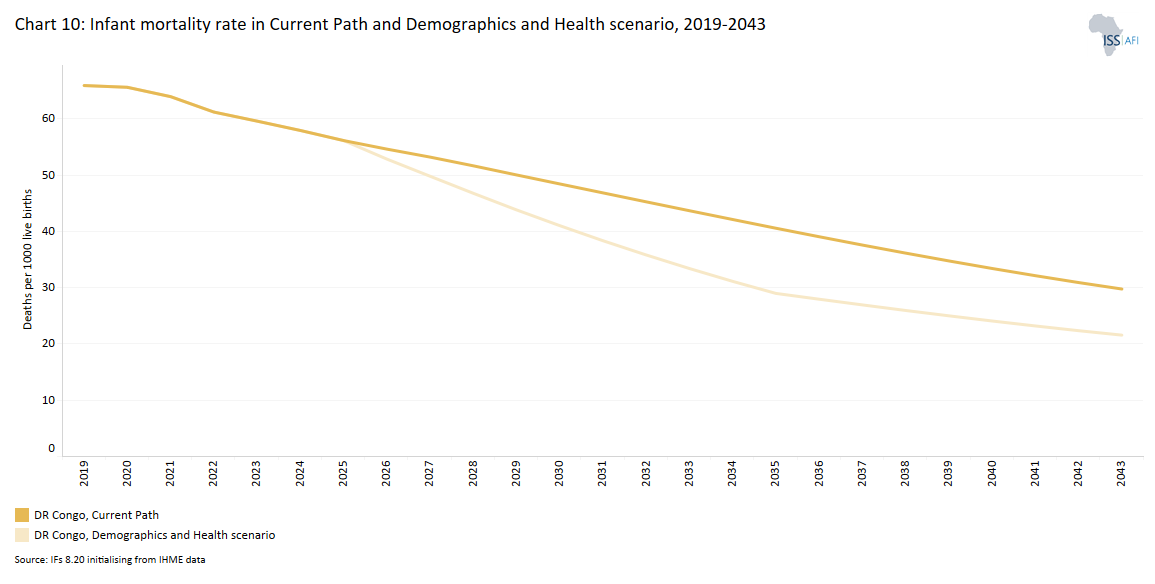
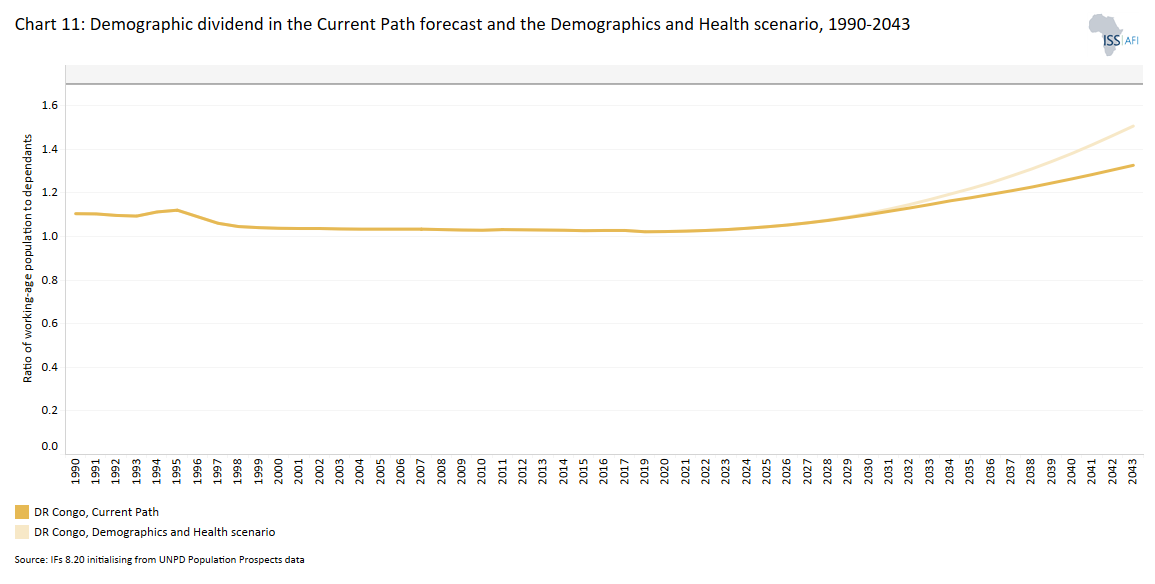
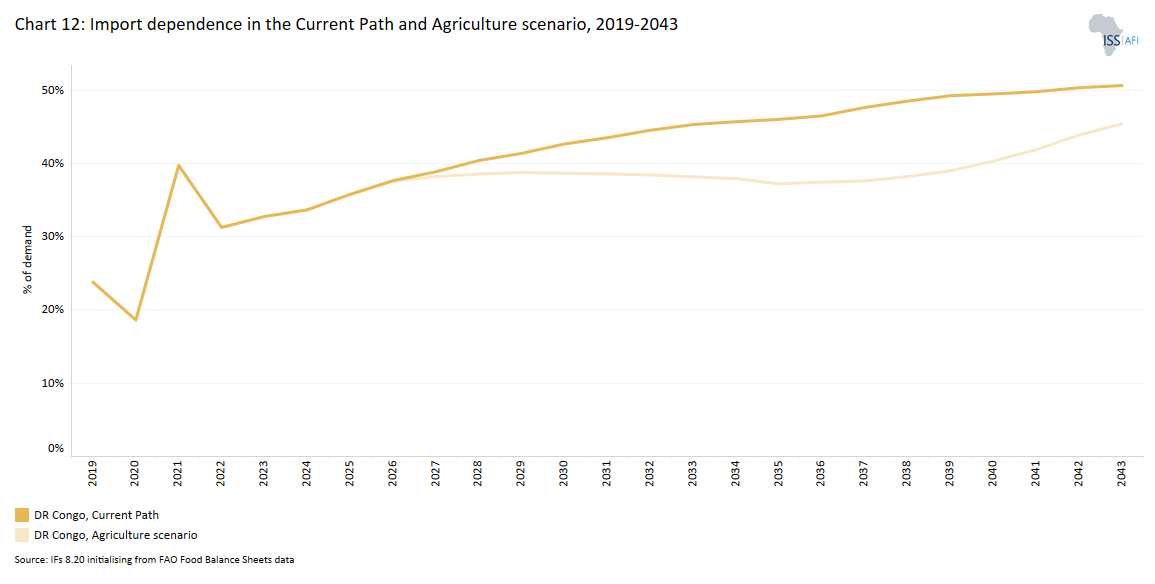
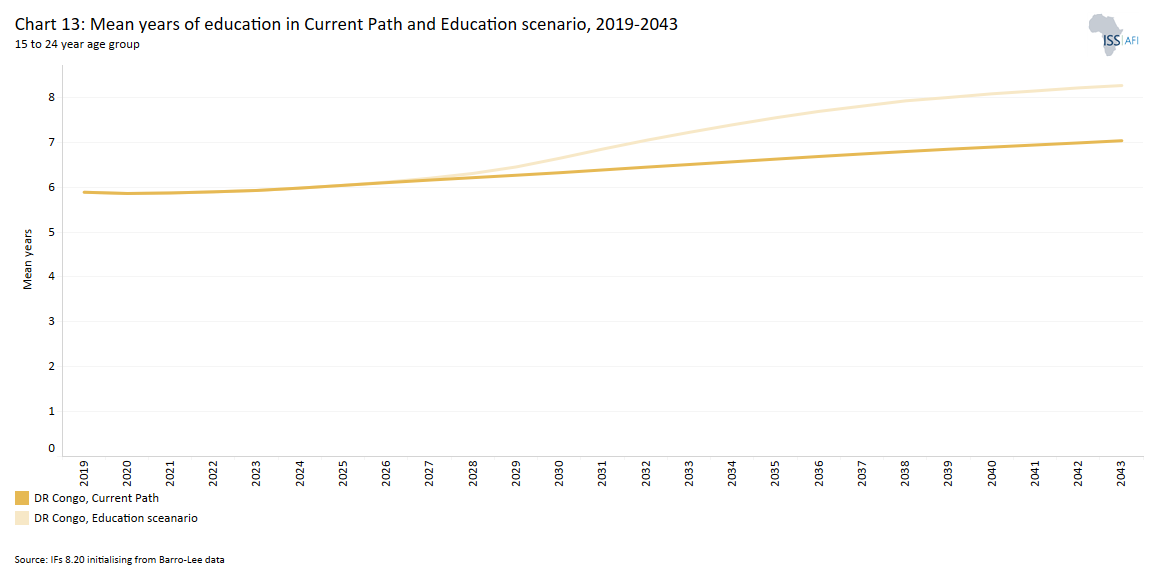
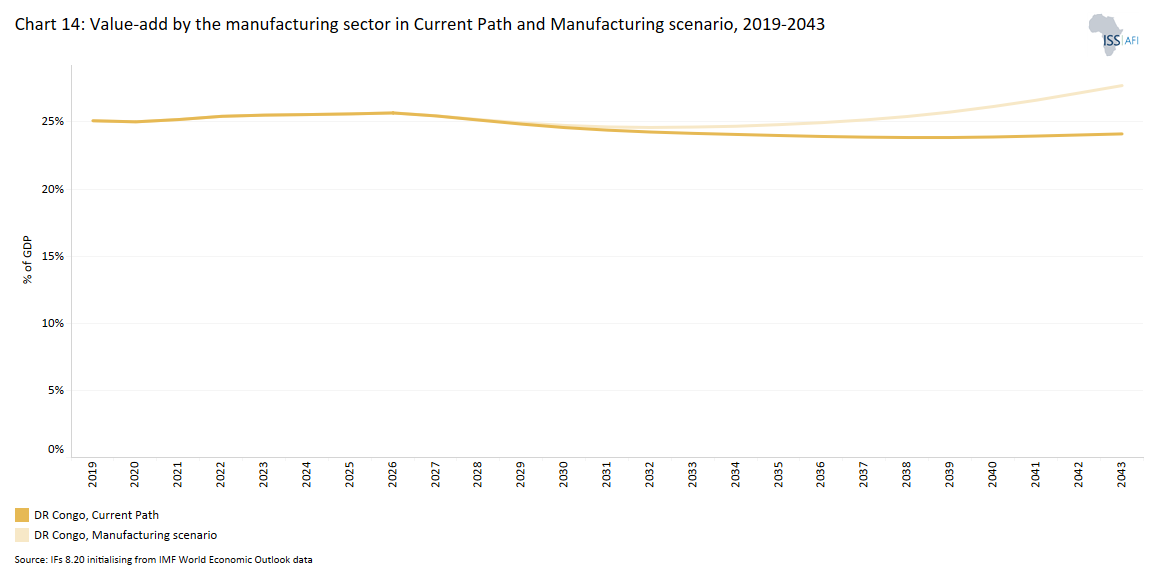
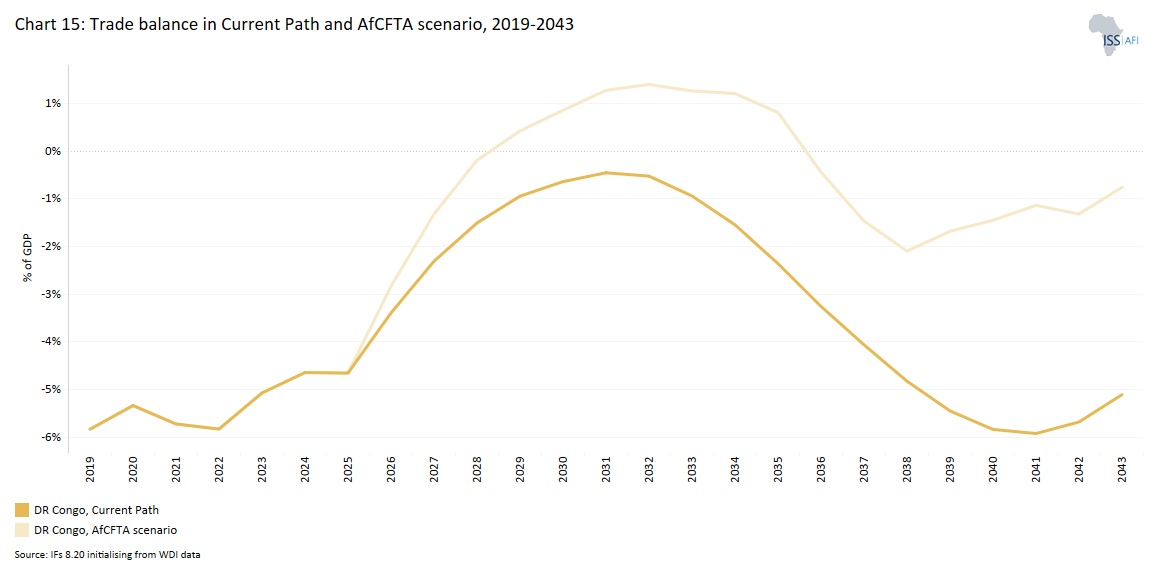
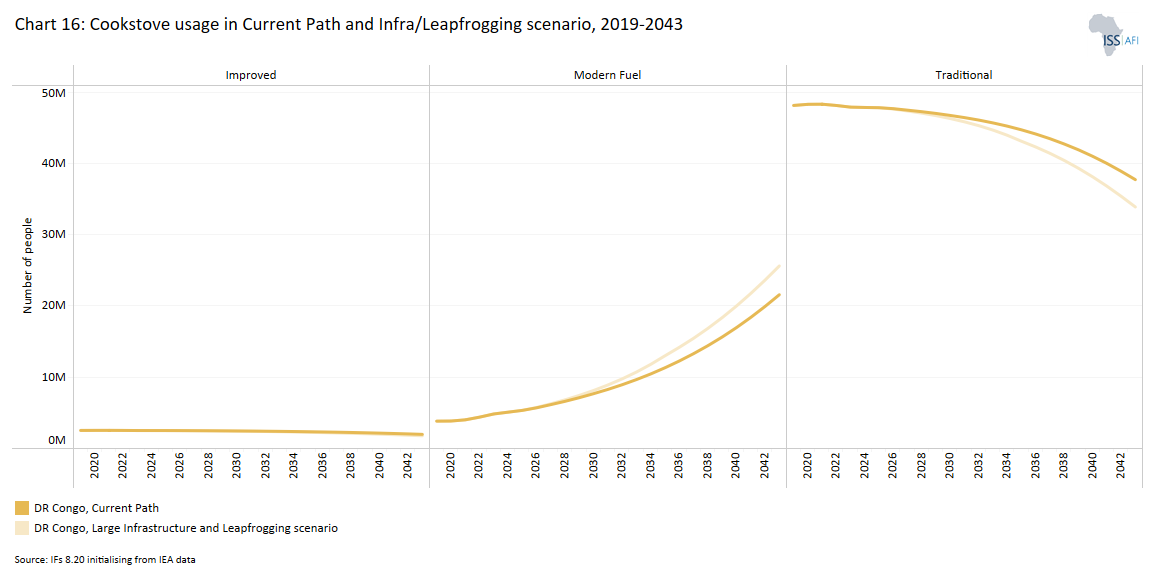
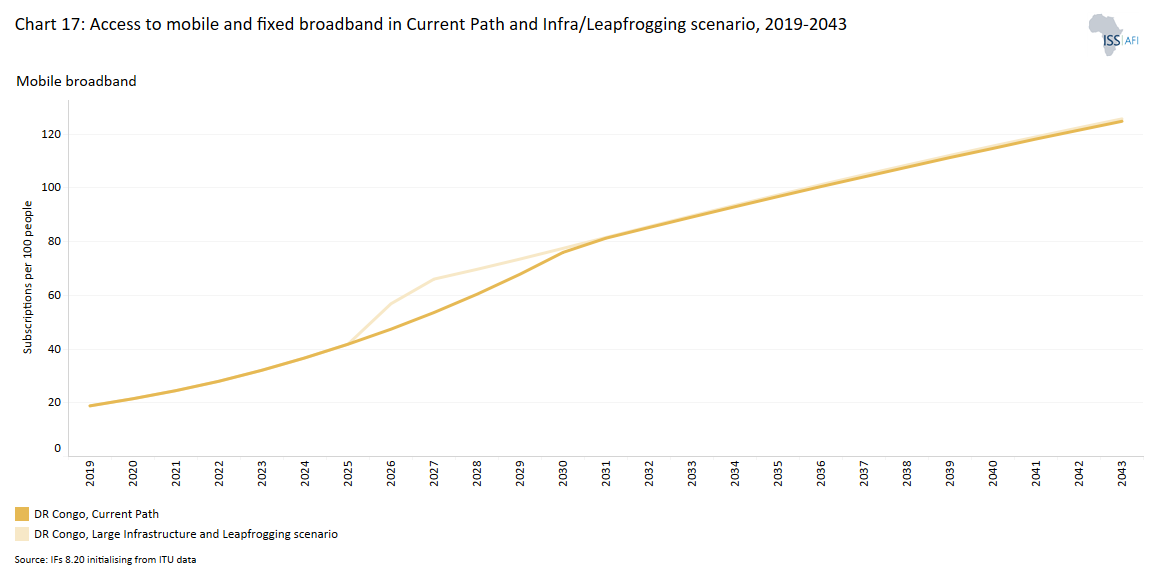
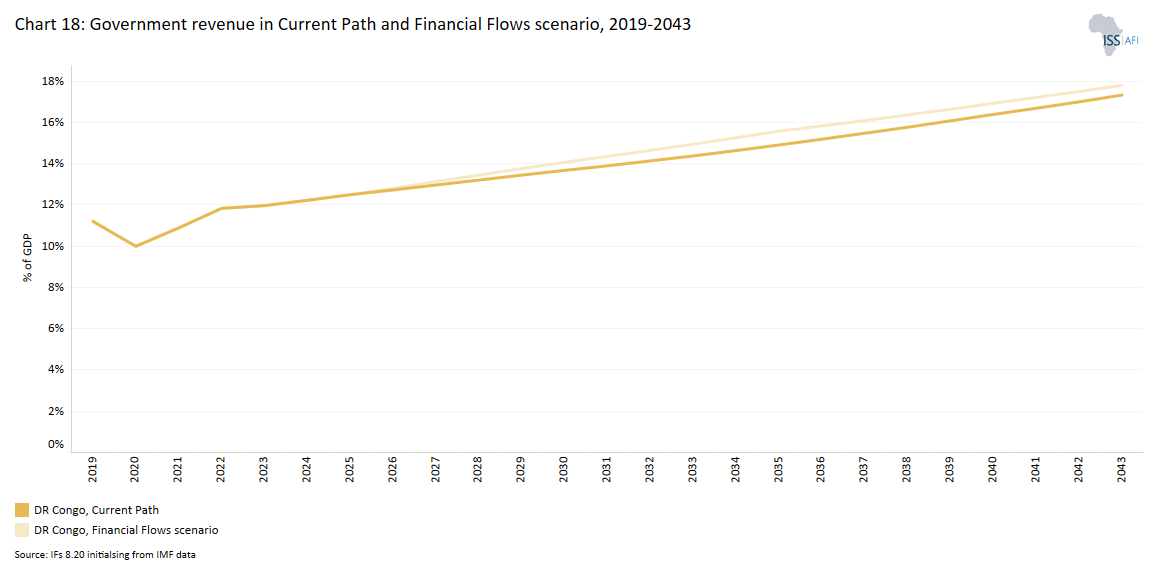
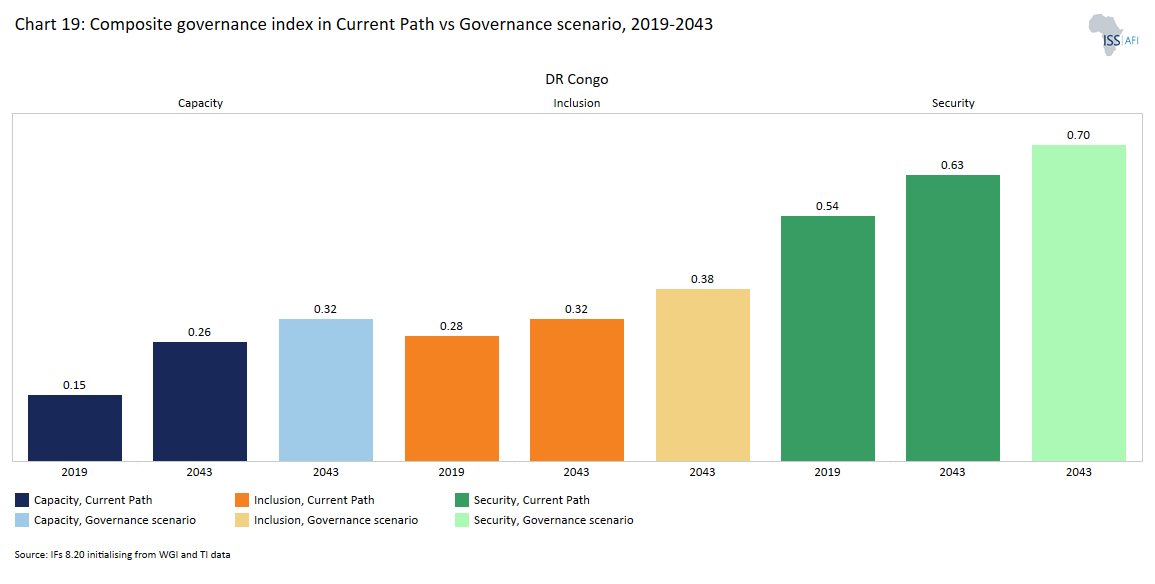
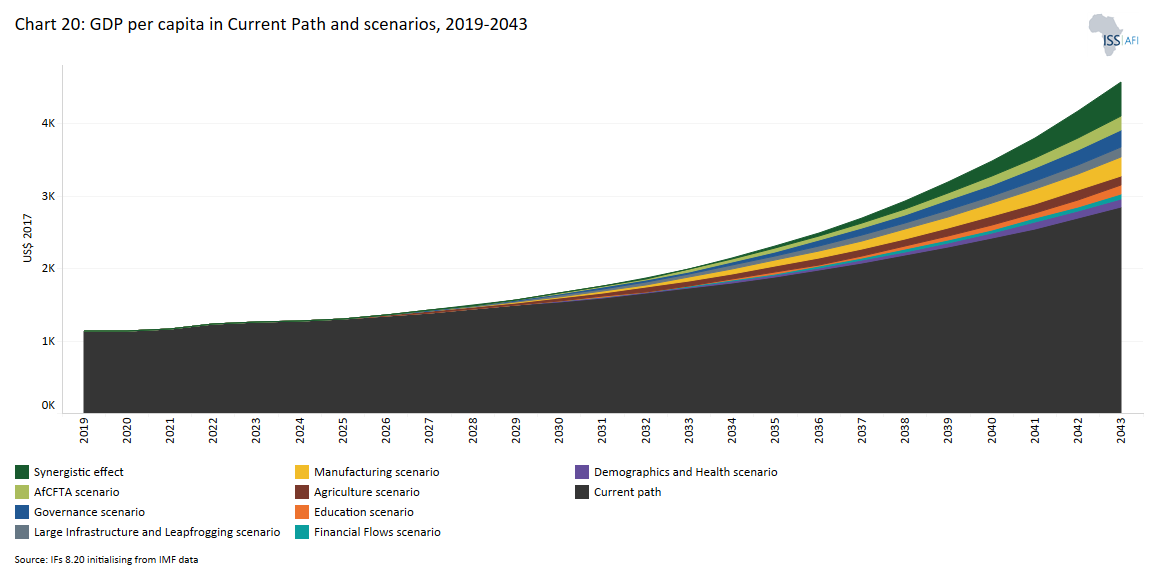
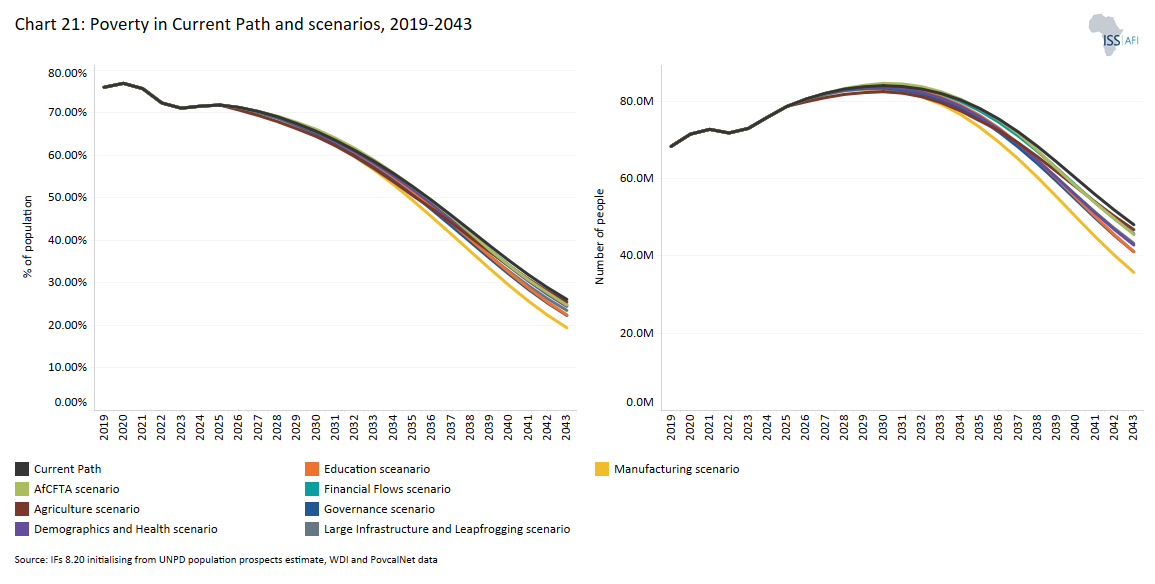
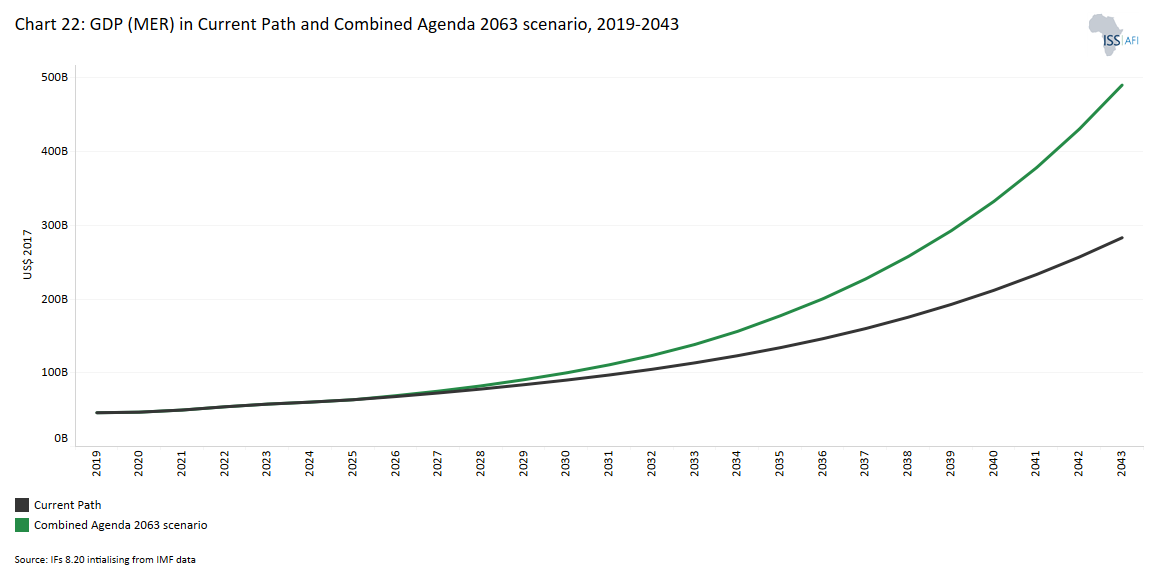
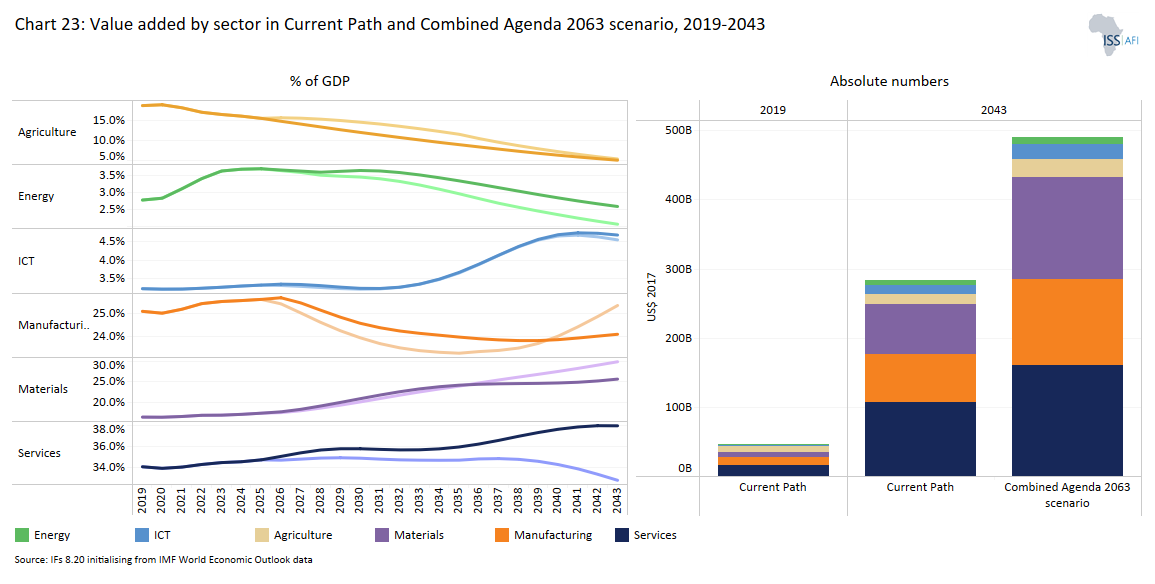
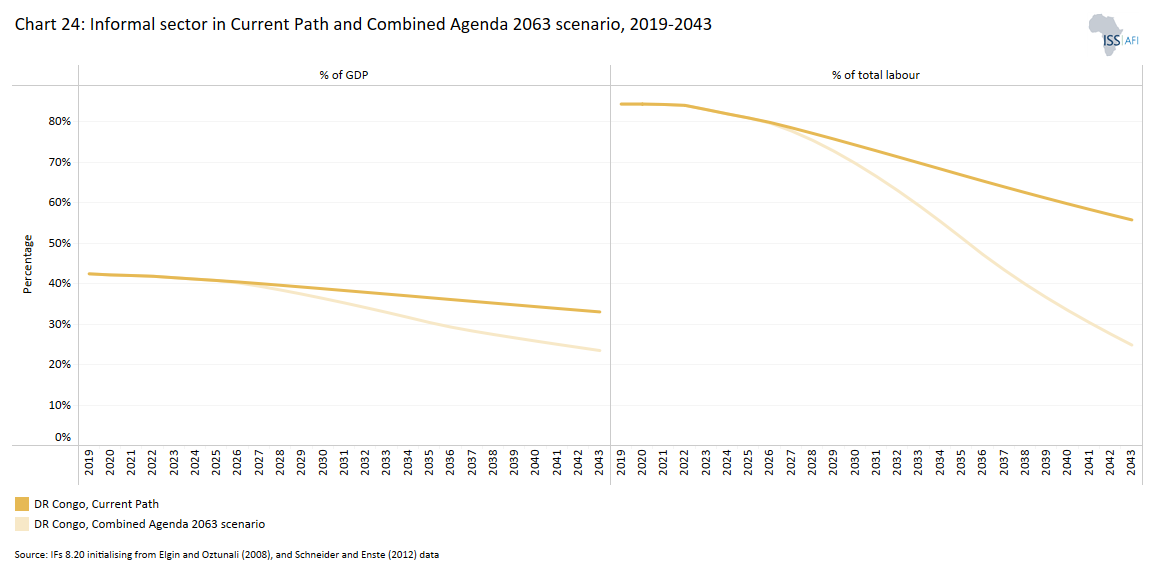
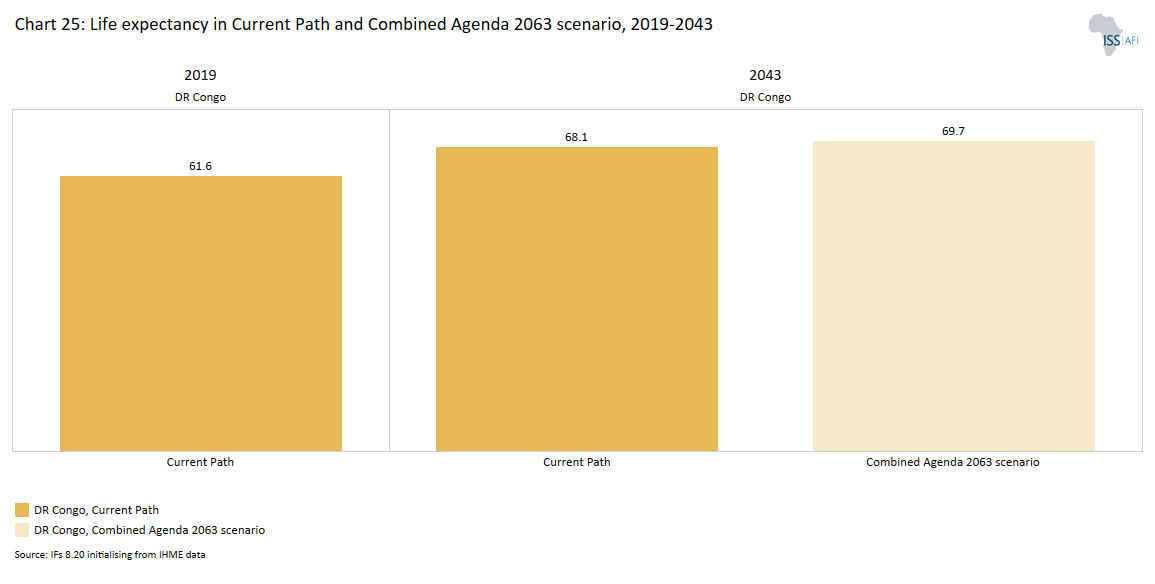
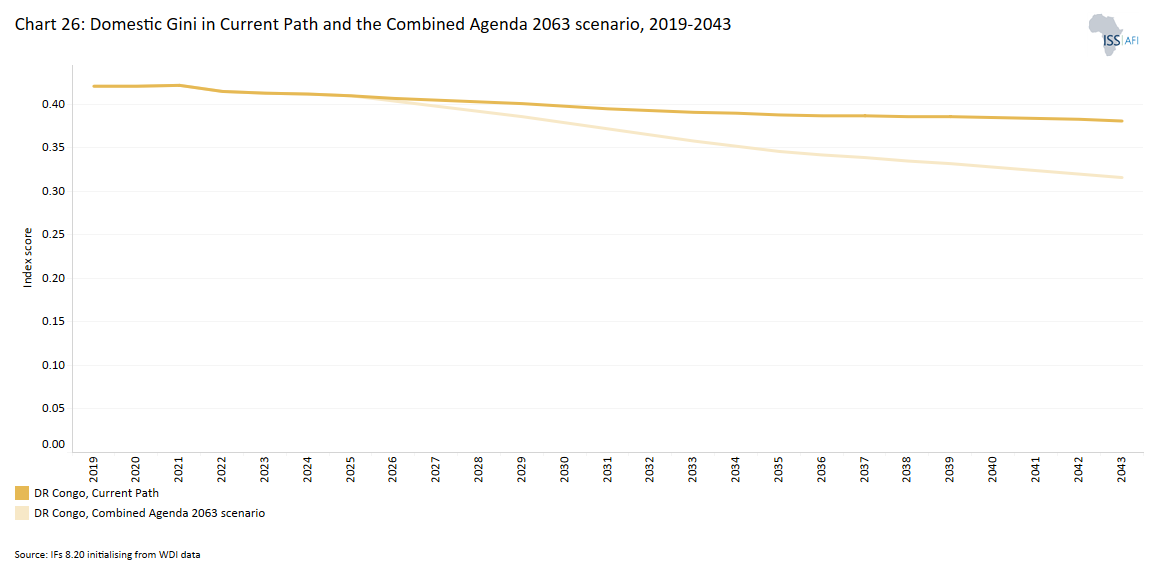
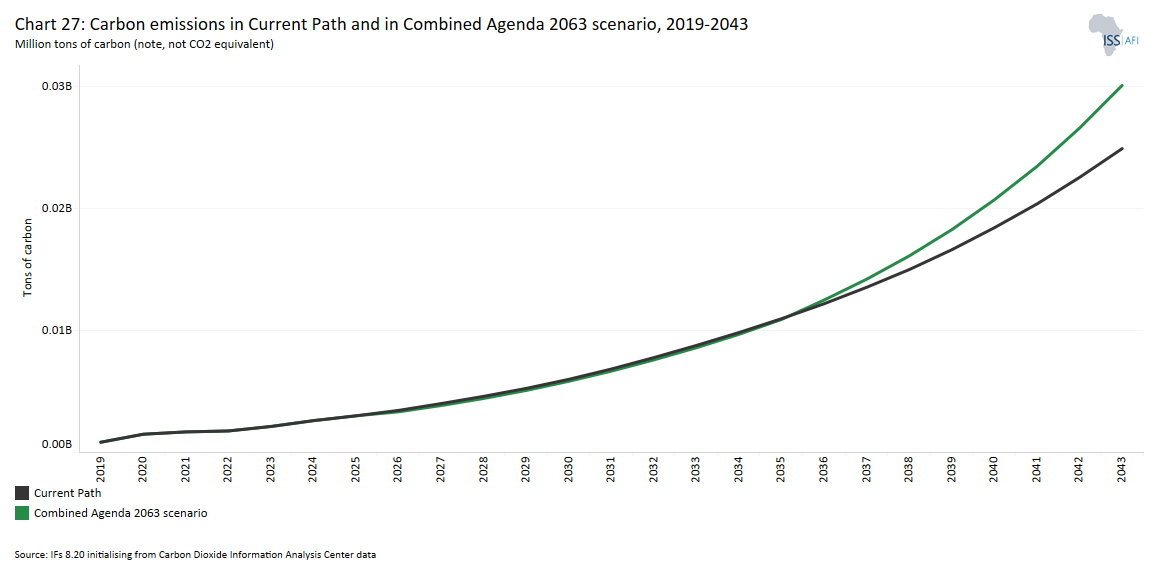
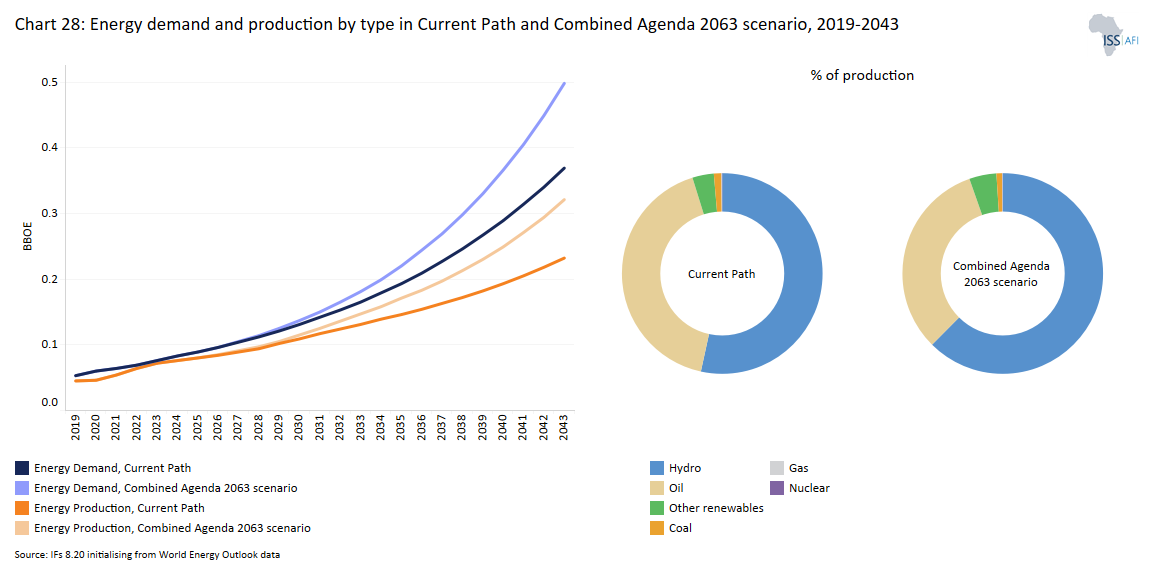
Chart 1 is a political map of DR Congo.
The Democratic Republic of the Congo (DR Congo), also known as Congo-Kinshasa and formerly known as Zaïre, is located in Central Africa. The country is bordered to the north by the Central African Republic and South Sudan, to the east by Uganda, Rwanda, Burundi and Tanzania, to the south-east by Zambia, and to the south-west by Angola. To the west are DR Congo’s short Atlantic coastline and the Angolan enclave of Cabinda and Congo (Brazzaville). Kinshasa is the largest and capital city of DR Congo.
DR Congo is the largest country by land area in sub-Saharan Africa, the second largest in Africa and the 11th largest in the world. Its land area covers approximately 2 344 858 km²—an area approximately the size of Western Europe. The country has the second-largest tropical rainforest (after Brazil) covering more than 992 000 km².
DR Congo is well known for its abundant and diverse mineral resources (mining is its largest industry), extensive navigable waterways, vast hydroelectric potential and arable land, estimated at 80 million hectares. The country possesses about 50% of the global cobalt reserves, 25% of the world's diamond reserves and large reserves of coltan. It is the largest producer of copper in Africa and the world’s largest producer of cobalt.
Despite these abundant natural resources, the country remains among the poorest and least developed in Africa and the world. Most people in DR Congo have not benefited from this wealth. Since gaining its independence in 1960, DR Congo experienced social and political upheavals - conflicts, political instability, authoritarian rule and poor governance have impeded development progress and led to the ongoing humanitarian crisis in the eastern part of the country.
The army mutinied one week after independence and the diamond-rich Kasai and copper-rich Katanga provinces attempted to secede[1World Bank, Democratic Republic of Congo, Systematic Country Diagnostic, Report No. 112733-ZR, 2018.]. Eventually, United Nations and Congolese government forces managed to reconquer Kasaï (in December 1961) and Katanga (in January 1963).
The first republic (1960-1965) was marked by armed conflicts, claiming nearly two million Congolese lives, and ended in a military coup led by Colonel Joseph-Désiré Mobutu on 24 November 1965. Mobutu declared himself president and was unopposed in the 1970 election.[2World Bank, Democratic Republic of Congo, Systematic Country Diagnostic, Report No. 112733-ZR, 2018.]
He reversed the 1964 Luluabourg Constitution’s federal structure,reducing the number of provinces to nine with limited autonomy. Despite efforts for greater regional autonomy,, including administrative decentralisation reforms in 1982, these were never implemented. Mobutu was eventually forced from power in 1997 having effectively mismanaged his country for more than three decades.[3DP Zongwe, Decentralization in the Democratic Republic of the Congo, Autonomy Arrangements in the World, March 2019, 9, DOI:10.13140/RG.2.2.20028.08321]
Economic reforms, driven by high copper prices, spurred growth in DR Congo from 1967 to 1973, but the oil crises of 1973 and 1979 and a drop in copper prices halted this expansion.The situation worsened with Mobutu’s Zairianisation policy in 1973 (a form of indigenisation of the economy) which increased the involvement of the state in the economy.
These policies along with poor public financial management and wanton corruption led to hyperinflation, mounting debt, capital flight, increased poverty, and low agricultural production.[4DR Congo, Agence nationale pour la promotion des investissements, 2020.] By 1975, the country needed IMF help to manage its debt crisis.
From 1983 to 1989, DR Congo partnered with the IMF and the World Bank in a structural adjustment programme that briefly contributed to economic recovery. However, when external conditions improved, the government halted reforms, leading to a marked deterioration in financial performance.[5B Akitoby and M Cinyabuguma, Sources of Growth in the Democratic Republic of the Congo: A Cointegration Approach, IMF Working Paper WP/04/114, July 2004, 5–7.]
The end of the Cold War in 1989 diminished DR Congo’s strategic importance, triggering political instability, hyperinflation, currency depreciation and increased reliance on the United States dollar. The influx of 1.2 million Rwandese Hutus in 1994 due to the Rwandan genocide precipitated the 1996/97 war.
By 1996, Mobutu's international support had dwindled[6G Prunier, Africa's World War: Congo, the Rwandan Genocide, and the Making of a Continental Catastrophe, Oxford: Oxford University Press, 2009.] and the efforts by the IMF and the World Bank had failed.
In May 1997, Mobutu was driven from power by the Alliance of Democratic Forces for the Liberation of Congo (AFDL), a coalition of rebel groups backed by Rwanda and Uganda. Laurent-Désiré Kabila proclaimed himself president, renaming the country from Zaïre to DR Congo. He inherited a dysfunctional country and attempted to carry out limited reforms, notably introduced a new currency, the Franc Congolais, and reduced the decentralised provinces to four.
However, disputes with former allies sparked the Great African War in August 1998, involving several neighboring states. The conflict ended in July 1999 with the Lusaka Ceasefire Agreement, signed by DR Congo, Angola, Namibia, Rwanda, Uganda, and Zimbabwe, and the establishment of the UN Mission in DR Congo (MONUC).
MONUC’s initial mandate was to observe the ceasefire and the disengagement of armed forces but its mandate was substantially expanded over time. The war reportedly killed millions, many of whom were children under the age of five.[7World Bank, Democratic Republic of Congo, Systematic Country Diagnostic, Report No. 112733-ZR, 2018.]
In 2001, President Laurent-Désiré Kabila was assassinated and succeeded by his son, Joseph Kabila Kabange who re-engaged the international community, allowing MONUC to deploy across the country. In 2002, Congolese signed the Accord Global et Inclusif, leading to the 2003 Transition Constitution, a three-year transitional period, and the country’s first free and fair elections in 2006, which Joseph Kabila won.
The Accord and Transition Constitution led to the drafting of a new Constitution, which incorporated contributions from a constituent assembly, provincial consultations, and both foreign and Congolese legal experts. Adopted by referendum in December 2005 and promulgated in February 2006, this Constitution set the stage for ongoing political and security challenges. The subsequent 2008 organic law outlined the administrative organization into provinces and other territorial entities. However, the government's execution lagged, only achieving the 2010 goal of establishing 26 provinces by 2015.[8The breakdown of the Katanga province into several smaller provinces also aimed at stripping the former Katanga governor and then-presidential hopeful Moise Katumbi of a potential electoral base. DP Zongwe, Decentralization in the Democratic Republic of the Congo, Autonomy Arrangements in the World, March 2019, 10–14, DOI: 10.13140/RG.2.2.20028.08321.]
In 2010, MONUC became the United Nations Organisation Stabilisation Mission in the Democratic Republic of the Congo (MONUSCO), now supporting an elected government. Joseph Kabila won re-election in 2011 amid accusations of corruption and electoral fraud.
Subsequent ambiguity about Kabila’s potential third term — from which he was constitutionally barred — coupled with a two-year election delay, sparked sustained and widespread protests and created significant instability. Following international pressure, Kabila announced in mid-2018 that he would not seek re-election. National and provincial elections were eventually held in December 2018 but faced significant disputes by the opposition and civil society.
According to domestic election observers, opposition leader Martin Fayulu won the presidential contest. Félix Tshisekedi was officially declared the winner. His inauguration in spired some hope as it was the first peaceful transition of power in DR Congo since its independence. President Tshisekedi was forced into a governing coaliation with the outgoing President Kabia supporters who at the time maintains a significant grip on power as a result of a substantial majority in parliament. Tshisekedi’s Union pour la Démocratie et le Progrès Social (UDPS), Kabila's Front Commun pour le Congo (FCC), and Tshisekedi’s running mate, Vital Kamerhe's Union pour la Nation Congolaise (UNC) governed the country through a rickety coalition government which collapsed after about four months as Tshisekedi declared that the power-sharing deal was blocking his agenda for reforms and then formed a new government that was known as the ‘Sacred Union of the Nation’.
President Tshisekedi was re-elected in the December 2023 presidential election and the population is still waiting for his new government. His first term in office was defined by three major factors: questions over the legitimacy of his 2019 election victory, violence in the eastern of DR Congo and the state of the country’s economy. Some of his first term in office successes include DR Congo’s joining of the East Africa Community, improved access to education especially for girls and at earlier ages and a modest upturn in economic growth since the Covid-19 pandemic. Much work remains for President Tshisekedi in his second term to improve the lives of Congolese citizens.
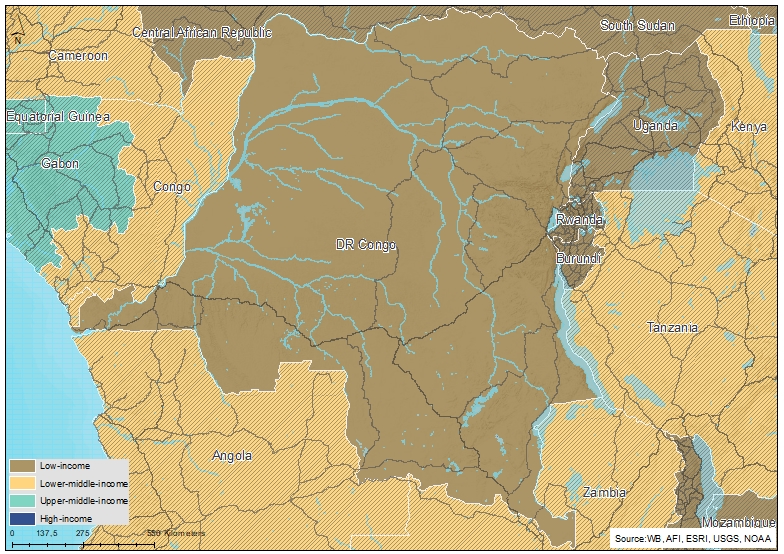
Chart 2 presents the population structure to 2043 in the Current Path forecast.
DR Congo is one of the most linguistically diverse countries in the world, with about 215 distinct ethnic and linguistic groups. French, introduced by Belgian colonists, is DR Congo’s official language. However, most Congolese people are fluent in other languages such as Swahili, Lingala, Kikongo and Tshiluba. The majority of the population in DR Congo is Christian, with nearly 70% belonging to various denominations, followed by African religions, Islam and other beliefs.
With an estimated population of about 99 million in 2022, DR Congo is the fourth most populated country in Africa and the 15th most in the world, after India, China, United States, Indonesia, Pakistan, Nigeria, Brazil, Bangladesh, Russia, Mexico, Ethiopia, Japan, Philippines and Egypt, respectively. The country has one of the fastest growing populations in Africa and globally, with an annual population increase of 3.3% in 2022. This is above the average population growth rate for low-income Africa (2.9%), Africa (2.5%) and the world (0.9%) in the same year.
The country’s rapid population growth has a significant impact on the well-being of its people, exacerbating its high rate of malnutrition, poor education and healthcare services. With a growing population and a very high number of dependents (people younger than 15 years old and older than 65) versus working-age people (15–64 years old), social conditions like poverty and hunger will increase as the effects of rapid population growth hit the poorest first and GDP per capita is reduced. The state’s negligible provision of medical care — along with poverty, violence and endemic disease—has led to a low life expectancy of 62.5 years in 2022. This is below the estimated averages for low-income African countries (63.8 years) and Africa (65.9 years). DR Congo also has a very large youth bulge, with around 49% of its adult population aged 15 to 29 in 2022. By 2043, the proportion will only have declined to about 45%. Generally, a youth bulge above 40% is indicative of potential for instability.
DR Congo’s population will increase by 73.6% between 2024 and 2043 to reach 164 million in the Current Path forecast. The working population (age 15–64 years old) will account for about 57% of the population in 2043. This can be a potential source of growth provided the labour force is well-trained and sufficient jobs are created. The population of 15 years old and younger is expected to decline, constituting about 40% of the population in 2043, while the share of elderly people (65+ years) will be 3%.
Chart 3 presents a population density map.
The population density of DR Congo was 0.44 people per hectare in 2022, which is comparable to the averages of low-income African countries (0.44 people per hectare) and the continent (0.48 people per hectare). In the Current Path forecast, the country’s population density will remain below one inhabitant per hectare by 2043, which is on par with the projected averages for low-income African countries and the continent in the same year.
The country’s population is concentrated on the plateaus, in the savannah near rivers and lakes. The north and the centre of the country, a domain of the jungle, are almost empty. The rural exodus, induced by factors such as avoiding conflict and its attendant risks as well as inadequate rural services, has swollen the population of the cities. The largest cities are Kinshasa, Lubumbashi, Mbuji-Mayi, Kananga, Kisangani and Bukavu.
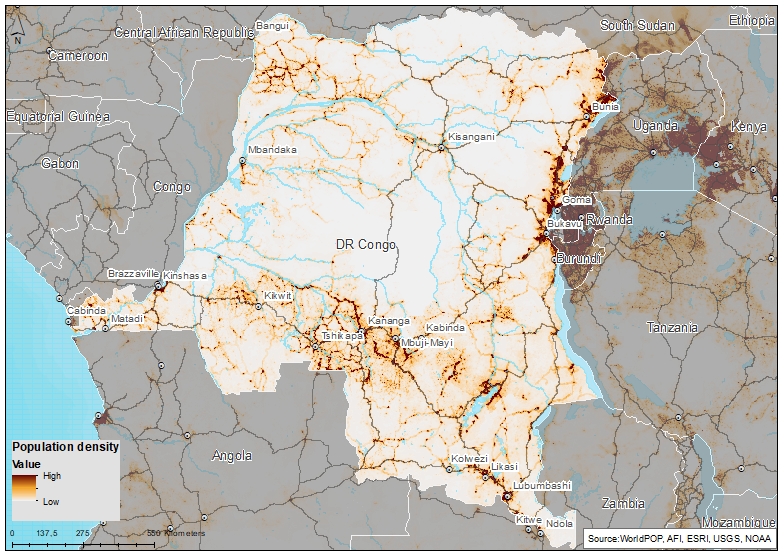
Chart 4 presents the size of DR Congo’s economy from 1990 and a forecast to 2043 including the associated growth rate.
The Congolese economy was particularly hard hit by the series of violent conflicts in the 1990s. For instance, from 1990 to 2003, the size of the economy shrank by about 40%. The mining sector, which was the mainstay of the economy, collapsed.
Following the signing of an all-inclusive peace agreement in 2002, the transition government, led by Joseph Kabila, reengaged with international financial institutions leading to a resumption of support from the World Bank and the IMF. Several reforms and policies implemented under the auspices of the Bretton Woods Institutions, in conjunction with a rebound in post-war economic activity, served to control hyperinflation and revive economic growth. In 2002, after a recession that had lasted a decade, the country returned to growth.
Buoyed by rising commodity prices, DR Congo recorded an average growth rate of 7.9% from 2010 to 2015, compared to an average of 4.3% for sub-Saharan Africa over the same period. However, the subsequent cyclical fluctuations in commodity prices slowed the average growth dynamics to 3.3% from 2016 to 2019 and revealed the country's high exposure to commodity price shocks. During the COVID-19 pandemic year (2020), the country recorded a growth rate of 1.7%—a 2.8 percentage point drop relative to 2019. Overall, the GDP in 2020 increased from US$44.9 billion in 2019 to US$45.7 billion. This was an increase of about US$784.8 million compared to an average increase of around US$1.9 billion between 2016 and 2019.
In 2022, DR Congo’s economy expanded by 8.9%, mainly driven by increased mining production and high global prices of commodity exports. The country is heavily dependent on commodity trade, particularly oils, copper, cobalt, tin, tungsten and tantalum. In the same year, the size of the economy was US$49.4 billion, up from US$42.7 billion in 2020. The hydrocarbon sector has dominated the economy. For the past 15 years, the share of the hydrocarbon sector has fluctuated around an average of 42% of GDP, the service sector about 33% of GDP, while agriculture, forestry and fishing represent 6% of GDP.
By 2043, the size of DR Congo’s economy will grow to US$259.8 billion. The country’s current extractive
industry-driven growth model is fragile and holds little promise for improvements in livelihoods. Without a significant structural transformation of the economy, economic growth will continue to be at the mercy of commodity price shocks. The underinvestment in education, healthcare and physical infrastructure, as well as weak governance institutions, have underscored the limits of extractive industry-driven growth and the importance of economic diversification in DR Congo.[2] With the expected decline in demand for fossil fuels from the global transition to a lower carbon economy, the country’s growth model may have a limited time frame.
Chart 5 presents the size of the informal economy as a per cent of GDP and in absolute terms, as well as the per cent of total labour involved in the informal economy.
The informal sector is a crucial lifeline for many people in DR Congo. According to the country’s Ministry of Labour, employment is dominated by the informal sector, which accounts for about 88.6% of total employment—59.7% in the agriculture sector and 28.9% in the non-agriculture activities.
In 2022, the size of the informal economy represented about 41.8% of the country's GDP, and by 2043 will decline significantly to 33%, which is above the averages of 26.6% and 24.6% for low-income African countries and Africa, respectively. Although the informal economy provides a safety net for the large and growing working-age population in the country, it impedes economic growth and hinders improved economic policies. Reducing informality will allow more people to benefit from better wages and redistributive measures. Therefore, DR Congo needs to reduce the size of its informal economy with the least friction possible by reducing the hurdles to registering a business, tackling corruption and improving access to finance.
Chart 6 presents the average GDP per capita from 1990 and includes the Current Path forecast to 2043.
Although many of the charts in the sectoral scenarios also include GDP per capita, this overview is an essential point of departure for interpreting the general economic outlook of DR Congo. The country failed to fulfil any of the Millennium Development Goals (MDGs) by 2015 and remains a low-income country with one of the lowest GDP per capita in the world. The country ranked 179th of 191 countries on the 2021/2022 Human Development Index.
The series of violent conflicts in the 1990s have had a knock-on effect on economic growth and income. For instance, over the period 1990 to 2003, the GDP per capita declined to nearly 29% of its level at independence in 1960. In 2022, GDP per capita in DR Congo amounted to US$1 133, equivalent to about 61.5% of the estimated African low-income countries average in the same year and about 42.2% less compared to its level in 1960.
The country’s GDP per capita will increase to US$2 605 in 2043, equivalent to 84.2% of low-income African countries’ projected average in the same year.
Chart 7 presents the number of people living in extreme poverty, also expressed as a per cent of the population.
In 2015, the World Bank adopted US$1.90 per person per day (in 2011 prices using GNI), also used to measure progress towards achieving Sustainable Development Goal (SDG) 1 of eradicating extreme poverty. In 2022, the World Bank updated the US$1.90 to US$2.15 in 2017 constant dollars. They are:
- US$3.20 for lower-middle-income countries, now US$3.65in 2017 values.
- US$6.85 instead of US$5.50 for upper-middle-income countries in 2017 values.
- US$22.70 for high-income countries. The Bank has not yet announced the new poverty line in 2017 US$ prices for high-income countries.
DR Congo is one of the five countries in the world with the most people living in extreme poverty, i.e. living on less than US$2.15 per day. In 2022, about 72.3% of DR Congo’s population, equivalent to 71.8 million people, lived in extreme poverty. Thus, approximately one out of four people who lived in extreme poverty in low-income African countries in 2022 lived in DR Congo, and nearly one out of seven in sub-Saharan Africa lived in DR Congo. The country has the second highest number of extremely poor people in Africa after Nigeria and is unlikely to make significant progress towards the SDG target of reducing extreme poverty to less than 3% by 2030. Ways for DR Congo to reduce extreme poverty requires rapid, inclusive economic growth as well as educating children, ensuring basic healthcare, empowering women and preventing child marriage.
In the Current Path forecast, in 2043, DR Congo will be home to the highest number of extremely poor people in low-income Africa and the second highest in Africa, with 48.1 million people (about 26.1% of the population) living on the US$2.15 per day poverty line.
Factors such as armed conflicts, poor governance, high fertility rates, infrastructure shortages and low schooling completion are some of the root causes of the poverty for millions of Congolese people. Policymakers in DR Congo should make growth more inclusive by integrating the most vulnerable segments of the population, especially women, into the economy and enhancing human capital formation to meet the needs of the labour market and hence create more gainful jobs and accelerate poverty reduction.
The long-term development vision of the National Development Plan (2019–2023)[1]of DR Congo is to overcome poverty by building a diversified economy and through inclusive growth to become a middle-income economy
The plan includes five pillars for improvement:
- Human capital development, social and cultural development
- Strengthening good governance, restoration of state authority and consolidation of peace
- Consolidation of economic growth, diversification and transformation of the economy
- Land use planning, reconstruction and modernisation of infrastructure
- Environmental protection, fight against climate change, sustainable development and balance
The eight sectoral scenarios as well as their relationship to the Current Path forecast and the Combined Agenda 2063 scenario (hereafter Combined scenario) are explained in more detail separately. Please read more on the website’s About Page.
The characteristics of a country’s population can shape its long-term social, economic and political foundations. Thus, understanding a nation’s demographic profile indicates its development prospects. A healthy population is a key driver of labour and capital investment and economic growth. It can lead to a higher GDP per capita in the long-term due to its impact on population participation and productivity.
At independence, DR Congo had a relatively well-organised and efficient health system as a result of the mutual efforts of the government, multilateral cooperation and secular and religiously affiliated NGOs. However, subsequent lack of investment, mismanagement and decades of conflict have led to a near-collapse of the system. There is a high presence of non-state actors in the country’s health system. For instance, in 2013, 45% of hospitals in the country were managed by religious organisations, 44% by the government and 11% by private firms.[9B Naughton et al, DRC survey: An overview of demographics, health, and financial services in the Democratic Republic of Congo, START Center, University of Washington, March 2017.]
Congolese have little access to basic healthcare, mainly due to lack of funding, mismanagement and corruption, lack of qualified medical staff, and high costs. For example, healthcare costs are 60%–70% paid by direct contributions from households, compared to a world average of 46%. Also, because there are a limited number of health centres, around 74% of the population live more than 5 km from such centres.[10LS Ho et al, Effects of a community scorecard on improving the local health system in Eastern Democratic Republic of Congo: Qualitative evidence using the most significant change technique, Conflict and Health, 9:27, 2015]
The epidemiological profile of DR Congo is marked by the emergence and re-emergence of several communicable diseases.[11Republique Democratique du Congo, Ministère de la santé publique, Plan national de développement sanitaire 2016–2020, 2016] The country has experienced several epidemic outbreaks such as cholera, yellow fever, measles, Ebola virus and the recent COVID-19. These diseases lead to increased morbidity and mortality among the vulnerable populations, in particular children, women and populations living in isolated areas. Since the mid-2000s, the country has, however, undertaken several reforms in the health sector reflected in multiple strategies. In 2010, the government adopted the National Health Development Plan 2011–2015 which was followed by a second plan for 2016–2020, in 2015.
With the technical and financial assistance of the international community, the health system has registered some recent improvements, reflected in changes in indicators such as life expectancy, infant mortality and maternal mortality rates. Yet, DR Congo still lags behind its peers.
The Demographic and Health scenario consists of reasonable but ambitious reductions in child and maternal mortality ratio, increased access to modern contraception and reductions in the mortality rates associated with both communicable diseases (e.g. AIDS, diarrhoea, malaria and respiratory infections) and non-communicable diseases (e.g. diabetes), as well as improvements in access to safe water and better sanitation.
Visit the themes on Demographics and Health/WaSH for more detail on the scenario structure and interventions.
DR Congo's health sector has been greatly impacted by the country’s own protracted conflicts, as well as by the continued long-standing complex humanitarian crises in the world. This has been worsened by the COVID-19 pandemic and by recurrent disease outbreaks such as cholera, measles and Ebola. There is significant evidence that COVID-19 has had a negative effect on the utilisation of health services in DR Congo since March 2020, with a decline in hospital visits, a decrease in the number of antenatal care visits, a reduction in access to family planning and contraception and increased food insecurity. Nearly 23 million children missed out on routine vaccinations in 2020 due to the COVID-19 pandemic —the highest number in more than a decade, according to WHO/UNICEF data.
Rapid population growth in DR Congo goes hand-in-hand with rapid urbanisation. In 2022, about 46.8% of the population lived in urban areas, up from 30.6% in 1990. This is about 14.3 percentage points more than the estimated average of 32.5% for low-income African countries.
On the Current Path development trajectory, the rate of urbanisation in DR Congo will increase to about 56.5% (nearly 103.9 million people) by 2043, while the rural population will drop from 53.2 (2022) to nearly 43.5% by 2043.
In the Demographics and Health scenario, the urban population in DR Congo will decrease to about 100.7 million people (nearly 59.6% of the total population). This is a reduction of about 3% (equivalent to nearly 3.1 million people) relative to the Current Path forecast in 2043. The size of the urban population in 2043 will be significantly above the projected average of low-income African countries by 15.7 percentage points in this scenario.
Rapid urbanisation in DR Congo is associated with unemployment, poverty, inadequate healthcare, poor sanitation, urban slums and environmental degradation, especially in the main cities such as Kinshasa. Nearly three-quarters of the urban population in DR Congo live in slums, which is 15 percentage points higher than the average for sub-Saharan Africa.
Chart 10 presents the infant mortality rate in the Current Path and the Demographics and Health scenario.
The infant mortality rate is the probability of a child born in a specific year or period dying before reaching the age of one. It measures the survival rate of children born and reflects the social, economic and environmental conditions in which children live, including their healthcare. The rate is measured as the number of infant deaths per 1 000 live births, and it is considered a proxy indicator of general population health. A high rate of infant mortality reflects precarious conditions such as poor nutrition, low access to safe drinking water and inadequate healthcare services.
At 61.2 infant deaths per 1 000 live births in 2021, infant mortality in DR Congo was higher than the estimated average of 49.6 and 46.2 deaths per 1 000 live births for low-income African countries and Africa, respectively. One reason for high infant mortality in DR Congo is its reliance on a physical and healthcare infrastructure that has suffered from lack of investment and fallen prey to decades of protracted conflict, poor governance and economic mismanagement. The Demographics and Health scenario will reduce the infant mortality rate in DR Congo to 21.6 deaths per 1 000 live births by 2043, compared to 29.8 deaths in the Current Path forecast.
When it comes to fertility rates, in 2022, DR Congo had the fourth highest total fertility globally (an average of six births per woman) after Niger, Chad and Somalia, respectively. The fertility rate in DR Congo is mainly driven by cultural values, which encourage people to have large families, and an early start to childbearing, which means more years of giving birth and less use of contraception. The Demographics and Health scenario will reduce the fertility rate from about four births per woman in the Current Path forecast to three births per woman in 2043.
Chart 11 presents the demographic dividend in the Current Path and in the Demographics and Health scenario.
Demographers typically differentiate between a first, second and even third demographic dividend. We focus here on the contribution of the size of the labour force (people between 15 and 64 years of age) relative to dependants (children and elderly people) as part of the first dividend. Thus, the demographic dividend is the window of economic growth opportunity that opens when the ratio of working-age persons to dependents increases to 1.7:1 and higher.
DR Congo has not entered a demographic window of opportunity, meaning that the ratio of working-age persons to dependents is below 1.7:1. In 2022, DR Congo ratio stood at 1.03:1. On the Current Path or business as usual scenario, the ratio will reach 1.3:1 by 2043. The interventions in the Demographic and Health scenario will have a marginal impact on DR Congo’s demographic dividend, the ratio will slightly increase to 1.5:1 by 2043. DR Congo will reach the minimum ratio of 1.7:1 described above by 2047, three years earlier than the average for African low-income countries.
The increasing size of the working-age population in DR Congo can be a catalyst for growth if sufficient education is provided and adequate employment is generated to successfully harness their productive power. Otherwise, it could turn into a demographic 'bomb' as many people of working age may remain in poverty, potentially creating frustration, social tension and conflict.
The Agriculture scenario envisions an agricultural revolution that ensures food security through ambitious yet feasible increases in yields per hectare, thanks to improved management, seed, fertiliser technology, and expanded irrigation and equipped land. Efforts to reduce food loss and waste are emphasised, with increased calorie consumption as an indicator of self-sufficiency and prioritising it over food exports. Additionally, enhanced forest protection signifies a commitment to sustainable land use practices.
Visit the theme on Agriculture for our conceptualisation and details on the scenario structure and interventions.
DR Congo has an estimated 80 million hectares of available arable land but only about 10% of this land is currently being cultivated. The country has the largest untapped agricultural production in Africa, with production potential capable of feeding a quarter of the world’s population. But the country has so far failed to make the required investments and policy changes to make this potential a reality.
DR Congo has not achieved food independence and malnutrition is widespread. According to the Global Hunger Index 2023, DR Congo is one of the world’s most food-insecure countries, ranking 122nd out of 125, with an agricultural extension system that is apparently ineffectual. The main cash crops are coffee, palm oil, rubber, cotton, sugar, tea and cocoa. Food crops include cassava, plantains, corn, peanuts and rice.
The agriculture sector accounts for over 60% of new jobs, and in 2022, the sector accounted for about 17.4% of its GDP—a decline in share from about 56.5% in 1995. The agriculture sector in DR Congo was severely affected by violent armed conflicts from 1996 to 2000. For instance, by 2006, agricultural productivity had fallen to 60% of its level at independence in 1960.
The DR Congo Agriculture Rehabilitation and Recovery Support Project (ARRSP) aims to increase agricultural productivity by smallholder farmers. Other constraints on production include a lack of transport infrastructure, limited access to agricultural inputs and land disputes.
In 2022, crop yields were estimated at about 4.5 metric tons per hectare, a decline of about 0.3 metric tons per hectare in the past decade, however, above the estimated average of 2.9 metric tons per hectare for low-income African countries in 2022. In the Current Path forecast, crop yields will increase to about 5.6 metric tons per hectare in 2043. In the Agriculture scenario, crop yields in DR Congo will improve to nearly 8.9 metric tons per hectare, which would be an increase of nearly 3.3 metric tons per hectare relative to the Current Path forecast in 2043.
Chart 12 presents import dependence in the Current Path forecast and the Agriculture scenario.
Without significant efforts to improve agricultural production, the current low crop yield will continue to make DR Congo a net food importer for the foreseeable future. In 2022, DR Congo’s post-loss agricultural production (crop) stood at 59.9 million metric tons, falling short by 10.3 million metric tons to meet the year’s agricultural crop demand of 68.3 million metric tons.
In the Current Path forecast, by 2043, the gap between agriculture crop production (post losses) and demand will increase to about 47.2 million metric tons. The Agriculture scenario will increase post-loss production (crop) by 35.9 million metric tons relative to the Current Path forecast of 107.1 million metric tons in 2043. Due to improvements in rural road access, crop production losses will decrease by 1.4 million metric tons in 3025 and to 0.2 million metric tons by 2043 relative to the Current Path forecast of about 9.8 million in 2035 and 12.1 million metric tons by 2043.
The Congolese education system is a hybrid. It is made up of public secular schools and religiously affiliated schools. The Catholic Church is by far the most important actor in DR Congo’s education system since the very early stages of the colonial period. The Church organises most of the education and the state provides (at least in theory) the funding.
The duration of compulsory basic education is six years for children between six and eleven years old. Although there is a three-year pre-primary education, it is only available in a few urban areas.
Secondary education has two components (cycle long and cycle court). The cycle long consists of the first stage of two years of general studies called tronc commun or cycle d’orientation. The second stage of four years of specialisation ends with a certificate called the Diplôme d'Etat for those who pass the terminal examination called the Examen d'Etat which grants access to tertiary education. The cycle court concerns vocational education and consists of a four-year course starting immediately after primary education, or a three-year course after the first stage of the cycle long.[12World Bank, Education in the Democratic Republic of Congo: Priorities and Options for Regeneration, World Bank Country Study, Washington, DC: World Bank, 2005] Political instability and conflicts in the 1990s severely affected the educational outcomes in DR Congo. In addition, widespread malnutrition, the difficulty of switching from mother tongue tuition to learning in French, and, in particular, financial constraints continue to hamper educational outcomes. Despite these challenges, DR Congo has recorded a notable improvement in indicators related to education (i.e. literacy and net enrollment rates) in recent years. For example, the literacy rate for people aged 15 years and older improved from 61.2% in 2007 to an estimated value of about 80.3% in 2022.
The regular age for lower secondary education is 12 to 13 years and 14 to 17 years for upper secondary education. Repetition is permitted only once in each stage.[13World Bank, Education in the Democratic Republic of Congo: Priorities and Options for Regeneration, World Bank Country Study, Washington, DC: World Bank, 2005]
Quality education is crucial for economic development. It not only allows the country to increase its current added value but also creates tomorrow's technological innovations. Thus, Congolese authorities should accelerate reforms to improve the quality of education in the country.
The Education scenario represents reasonable but ambitious improved intake, transition and graduation rates from primary to tertiary levels and better quality of education at primary and secondary levels. It also models substantive progress towards gender parity at all levels, additional vocational training at the secondary school level and increases in the share of science and engineering graduates.
Visit the theme on Education for our conceptualisation and details on the scenario structure and interventions.
Chart 13 presents mean years of education in the Current Path forecast and the Education scenario for 15 to 24 age group.
The average years of education in the adult populatio is a good first indicator of the stock of knowledge in society.
The average years of education for adults aged 15 to 24 years was estimated at 5.9 years in 2022, about 0.2 years above the average of low-income African countries.
On the Current Path, the mean years of education (15-24 years of age) in DR Congo is projected to improve to about 7 years by 2043, which will be below the projected average of low-income African countries at 7.2 years in the same year. In the Education scenario, the mean years of education for this cohort will increase to 8.3 years—an increase of about 1.2 years relative to the Current Path forecast in 2043.
Although DR Congo has made significant progress in getting more children into school in recent years, the quality of education they receive is poor and not well suited to the needs of the job market. The main factors explaining this low quality of education are a shortage of teaching staff with the required skills, obsolete equipment and overcrowded classrooms. The education sector is underfunded: government spending on education was estimated at about 2.7% of GDP in 2022, while the average of low-income African countries was 3.4% of GDP.
In the Education scenario, the score for the total quality of primary education will improve from 34.3 out of a possible 100 in the Current Path forecast to 41.4 in 2043—a 20.6% increase compared to the Current Path forecast. The score for the quality of secondary education will improve from 39.5 (Current Path forecast) to 44.6 in the Education scenario by 2043—a 12.5% increase in quality compared to the Current Path forecast.
By investing in the education of its citizens, DR Congo can cultivate a foundation for innovation, economic advancement, and social harmony.
In the Manufacturing scenario, reasonable but ambitious growth in manufacturing is envisaged through increased investment in the sector, research and development (R&D), and improved government regulation of businesses. This aims to enhance total labour participation rates, particularly among females where appropriate and is accompanied by increased welfare transfers to unskilled workers to mitigate the initial rises in inequality typically associated with a low-end manufacturing transition.
Visit the theme on Manufacturing for our conceptualisation and details on the scenario structure and interventions.
In DR Congo, manufacturing contributed about 16.7% of GDP in 2022, but the content is low technology, with limited value-addition. Products include processed foods (particularly flour and sugar), beer and other beverages, cigarettes, textiles and clothing, footwear, processed wood and paper, chemicals, cement and bricks, glassware and metal goods, such as nails and metal furniture.
Chart 14 presents the contribution of the manufacturing sector to GDP in the Current Path and the Manufacturing scenario. The -model uses data from the Global Trade and Analysis Project (GTAP) to classify economic activity into six sectors: agriculture, energy, materials (including mining), manufacturing, services and information and communication technologies (ICT). Most other sources use a threefold distinction between agriculture, industry and services, with the result that data may differ.
In the Current Path forecast, the manufacturing sector's value-added contribution to GDP will reach 24.1% by 2043. The manufacturing scenario will increase the share to 27.7% of GDP by 2043—an increase of 3.6 percentage points relative to the Current Path forecast. Thus, the Manufacturing scenario will increase the size of DR Congo’s economy by U$35.3 billion relative to the Current Path forecast in 2043.
In addition to a larger economy, the Manufacturing scenario also reduces extreme poverty. Instead of 48.1 million people living below US$2.15 in the Current Path forecast in 2043, 35.7 million (in the Manufacturing scenario) will live below the poverty threshold. This is the result of the inclusion of social transfers to unskilled workers and more rapid economic growth, as outlined in the Manufacturing scenario.
The AfCFTA scenario represents the impact of fully implementing the continental free trade agreement by 2034. The scenario increases exports in manufacturing, agriculture, services, ICT, materials and energy. It also includes an improvement in multifactor productivity growth emanating from trade and a reduction in tariffs for all sectors.
Visit the theme on AfCFTA for our conceptualisation and details on the scenario structure and interventions.
International trade can help accelerate growth and improve living standards. In 2022, exports and imports represented 48% and 50.9% of GDP, respectively. The country’s exports are highly concentrated in commodity goods, with the top five exports including refined copper and unwrought alloys, cobalt, unrefined copper, copper ores/concentrated and crude oil. Together these are the top five export products, representing about 92.2% of the total exports.
According to the Observation of Economic Complexity (OEC), in 2022 DR Congo was the world’s biggest exporter of cobalt (US$5.99 billion), cobalt oxide and hydroxides (US$899 million), copper alloys (US$199 million), cobalt ore (US$175 million) and other ores (US$92.7). In the same year, the value of exported refined copper was valued at US16.3 billion, raw copper at US$1.4 million and crude petroleum at US$916 million, destined mostly to China, Singapore, the United Arab Emirates, Hong Kong, and Tanzania. The country's imports were mainly refined petroleum (US$1.1 billion), sulphur (US$979 million), delivery trucks (US$367 million), stone processing machines (US$363 million) and iron structures (US$285) sourced mostly from China, Zambia, South Africa, the United Arab Emirates and India.
DR Congo deposited its instrument of ratification in February 2022 and became the 42nd country to ratify the AfCFTA. The country signed the AfCFTA in March 2018 and the National Assembly approved the treaty in April 2021.
Chart 15 compares the trade balance in the Current Path forecast with the AfCFTA scenario.
Trade openness increases the size of the market available to domestic firms. As for DR Congo, trade openness has led to significant progress in strengthening total trade (export plus imports), which represented 66.9% of its GDP in 2021.
DR Congo’s trade balance is structurally in deficit, and on the Current Path, this trend will continue until at least 2047. DR Congo’s trade deficit will represent about 5.1% of GDP (equivalent to about US$13.3 billion) in 2043.
In the AfCFTA scenario, DR Congo’s trade balance will become positive (a surplus) in the short to medium term (between 2029 -2035), with a trade surplus of US$1.03 billion by 2035, equivalent to 0.8% of GDP, compared to a trade deficit of about US$2.9 billion (2.4% of GDP) in the Current Path forecast. The trade surplus will be driven by the materials sector which includes mining. In the Current Path forecast, DR Congo will continue to have a trade surplus in the material sector.
In the AfCFTA scenario, the country’s materials sector trade surplus will increase to 31.2% of GDP compared to 28.6% of GDP in the Current Path forecast in 2035. By 2043 the materials sector trade surplus will account for 40.5% of GDP relative to 34.5% of GDP in the Current Path.
Due to the increase in exports in the materials sector, DR Congo’s total deficit will be reduced to US$2.2 billion (about 0.8% of GDP) in 2043, compared to a deficit of US$13.3 billion (about 5.1% of GDP) in the Current Path forecast.
With the removal of trade restrictions following the implementation of the AfCFTA, it will become easier to trade across the continent; however, DR Congo firms will likely face intense competition in the continent’s trade market.
The Large Infrastructure and Leapfrogging scenario involves ambitious investments in road and renewable energy infrastructure, improved electricity access and accelerated broadband connectivity. It emphasises adopting modern technologies to enhance government efficiency and the rapid formalisation of the informal sector, incorporating significant investments in major infrastructure projects like rail, ports, and airports while highlighting the positive impacts of renewables and ICT.
Visit the themes on Large Infrastructure and Leapfrogging for our conceptualisation and details on the scenario structure and interventions.
Infrastructure shortage in DR Congo is one of the key impediments to higher productivity and, hence, faster economic growth, particularly transport infrastructure. According to the World Bank, the infrastructure investment needed in DR Congo is among the highest in Africa.
Road transportation has always been a challenge and the country’s vast geography, low population density, extensive forests and meandering rivers further complicate the development of infrastructure networks. Due to a decade of war conflict, networks have been seriously damaged or left to deteriorate. Road and rail infrastructure is dilapidated, and the rail network has fallen into disuse. DR Congo’s share of paved roads is estimated at about 5% of total roads, and the share will increase to 23.5% in 2043. About half of the country is inaccessible by road including the capital city Kinshasa which cannot be reached by road from much of the rest of the country. Only a few provincial capitals are connected to Kinshasa. The country is effectively an 'archipelago' state; the only effective means to travel and trade internally is by air — which is costly — or via the Congo River.
The country has abundant and varied energy resources such as hydroelectricity, biomass, solar, wind and fossil fuels. For instance, the country possesses a huge potential of hydroelectric power estimated at 100 GW, which represents about 13% of the world’s hydroelectric potential. The country also has potential in other sources of energy, estimated at 70 GW for solar and 15 GW for wind power. In sum, DR Congo has the potential to become a leading exporter of electricity in Africa.
Paradoxically, DR Congo has one of the largest deficits in energy access in the world. The energy supply is largely insufficient for the country’s needs and energy consumption comes mainly from biomass. Only 3% is generated by hydroelectric power, and the rest is from charcoal and firewood. Although progress has been made, DR Congo still has one of the lowest rates of electrification globally. The share of the population with access to electricity increased from 6% in 2005 to 21.2% in 2022; far below the estimated 35.9% average of low-income African countries. By 2043, electricity access in DR Congo will increase to 53% of the population.
Access to electricity is heavily skewed toward urban and mining areas, notably Lualaba and Haut Katanga provinces where the copper and cobalt industry is concentrated. In rural areas, electricity is almost non-existent; with only 1% of the rural population connected compared to 42% in urban areas. Access is also uneven across the provinces, ranging from 44% in Kinshasa to 0.5% in Kasaï Occidental.[14African Development Bank, DRC Green Mini-Grid Program, 2019]
Rural households primarily use firewood (traditional cookstoves), leading toenvironment degradation through accelerated deforestation and health risks, such as respiratory issues in infants and children. Additionally, the time spent gathering firewood often limits educational opportunities for children, particularly girls. It is therefore very concerning that the use of traditional cookstoves is still at 59% by 2050.
The power supply is also inadequate and unstable, with frequent shortages and blackouts. For instance, in Kinshasa, about 21% of the population with electricity access receives less than four hours of power daily, and the country averages electricity shortages on 10 days per month.[15Nations Unies, Commission Economique pour l’Afrique, Profile de pays: République démocratique du Congo 2017, Addis Ababa: NU.CEA, 2018–03.] As a result, about 60% of firms in DR Congo have back-up generators, compared to an average of 43% in sub-Saharan Africa.[16World Bank, Increasing access to electricity in the Democratic Republic of Congo: Opportunities and challenges, 2020] These ongoing electricity issues affect economic productivity and growth.
Out of 100 GW hydroelectric potential, only about 2 677 MW have been installed, and only 1 100 MW are exploited. This power is mainly generated by the Inga I and Inga II dams which currently operate at around 50% capacity due to lack of maintenance. The World Bank has been leading efforts to rehabilitate turbines at Inga I and Inga II but the project is not yet complete.
The state power utility, Societe Nationale d'Electricite (SNEL), in charge of electricity production, transportation and distribution is highly inefficient. Almost half of the electricity produced is lost during transmission and distribution due to outdated equipment and maintenance systems.[17V Foster and DA Benitez, The Democratic Republic of Congo's Infrastructure: A Continental Perspective, Washington DC: World Bank, 2011.]
Aside from the national grid, there are a few mini-gridssuch as Synoki, Hydroforce and Virunga with a market share of about 6%.[18African Development Bank, DRC Green Mini-Grid Program, 2019.] According to the International Renewable Energy Agency (IRENA), only 3.66 MW of solar photovoltaics (PV) had been installed by the end of 2017. Off-grid systems are usually easier and less costly to implement and offer a solution to the growing unmet electricity demand.
There are some promising actions to resolve the problem of electricity access such as the Grand Inga Dam, a proposed giant hydroelectric scheme with an expected capacity of 44 000 MW. It could meet the entire need of DR Congo and even supply half of the African continent with electricity. The project will cost US$80 billion and is scheduled for completion in seven phases.[19M Mateso, RD-Congo: la construction d’Inga, le plus grand barrage du monde, peine à démarrer, Geopolis, 16 March 2015.]
The first phase (Inga III), which is estimated to cost US$14 billion, will generate 4 800 MW, initially scheduled for 2024 or 2025[20M Mateso, RD-Congo: la construction d’Inga, le plus grand barrage du monde, peine à démarrer, Geopolis, 16 March 2015.]. However, the project execution has been significantly delayed. In 2016, the World Bank suspended its funding because the then president, Joseph Kabila, decided to bring the project oversight committee into his presidency, lacking transparency. The project is still ongoing, albeit at a very slow pace. It may come on stream in 2030 at the earliest, dependent upon a partnership between South Africa and DR Congo.[21Congo Research Group, I need you, I don't need You: South Africa and Inga III, March 2020, Congo Research Group and Phuzumoya Consulting.]
Authorities in DR Congo have taken several steps to overcome the infrastructure deficit, including entering into contracts with Chinese firms to modernise transport infrastructure. The country is continuing to implement reforms to make the energy and telecommunications sectors more efficient. Public-private partnerships have also been encouraged as a way to increase investment, including foreign direct investment (FDI), in infrastructure-related sectors.
Chart 16 presents cookstove usage in the Current Path and the Large Infrastructure and Leapfrogging scenario.
With the low access to electricity in DR Congo, many households use traditional cookstoves, such as wood-burning and coal stoves. In 2022, it is estimated that about 87.4% of households in DR Congo used traditional stoves for cooking, while only 4.6% used improved cookstoves and about 8% used modern stoves.
In the Current Path forecast, in 2043, 61.6% of households will be using traditional stoves, while 3.2% will be using improved stoves and 35.2% will be using modern stoves. The Infrastructure and Leapfrogging scenario will reduce the use of traditional cookstoves to 55.2%, improved stoves to 2.9% and increase the use of modern stoves to 41.8% of households by 2043.
Chart 17 presents access to mobile and fixed broadband in the Current Path and the Large Infrastructure and Leapfrogging scenario.
Mobile broadband in Africa is expanding very rapidly, but fixed broadband lags.The mobile phone sector is perhaps the most dynamic and reliable infrastructure sector in DR Congo.
DR Congo has a very low fixed broadband rate relative to the average of its peers. In 2022, the country had about 0.3 subscriptions per 100 people, which was below the average of 1.8 subscriptions per 100 people average for low-income African countries. In the Current Path forecast, the subscription rate will increase to 17.4 by 2043—which will still be less than the average projected for its peer African group. In the Large Infrastructure and Leapfrogging scenario, fixed broadband subscriptions are set to increase to 26.5 per 100 people by 2043.
DR Congo had an estimated mobile broadband subscription rate of 26.2 per 100 people in 2022. The rate was significantly below the estimated average of 32.6 subscriptions per 100 people in low-income African countries. Mobile broadband subscriptions in DR Congo will increase rapidly reaching 124.8 subscriptions per 100 by 2043. The Large Infrastructure and Leapfrogging scenario will increase the rate by 0.9 subscriptions per 100 people relative to the Current Path forecast by 2043.
The Financial Flows scenario represents a reasonable but ambitious increase in inward flows of worker remittances, aid to poor countries and an increase in the stock of foreign direct investment (FDI) and additional portfolio investment inflows. We also reduce outward financial flows to emulate a reduction in illicit financial outflows.
Visit the theme on Financial Flows for our conceptualisation and details on the scenario structure and interventions.
Many countries in sub-Saharan Africa are still heavily dependent on foreign aid to provide basic services like education and healthcare. This is the case for DR Congo, despite its immense natural resources. Aid constituted about 5.9% of the country's GDP in 2022 (a decrease from 10.3% in 2012), which was below the average of nearly 7.6% of the GDP of low-income African countries. Foreign aid inflows as a share of DR Congo’s GDP will continuously decline in the business-as-usual scenario (Current Path forecast). In the Financial Flows scenario, foreign aid flows to DR Congo as a percentage of GDP will increase to 3.3% by 2043, a 0.3 percentage points increase relative to the Current Path forecast value of 3%.
The conflicts of the 1990s effectively kept foreign investors away from DR Congo. The government has recently implemented several policies and reforms to attract more FDI. The extractive sector accounts for most of the FDI flowing into DR Congo, followed by the telecommunications sector. In 2022, FDI inflows represented 4.4% of the country’s GDP, which was an increase of about 1.3 percentage points relative to 2020 (the COVID-19 pandemic year). This (4.4%) share was 1.8 percentage points above the average for low-income African countries, which was estimated at about 2.6% of low-income Africa’s GDP in 2022.
In the Financial Flows scenario, FDI inflows in 2043 will represent about 6.8% of GDP compared to nearly 5.7% in the Current Path forecast. FDI can act as a catalyst for economic development as it brings much-needed capital and technology to recipient countries. The Congolese government should continue its reforms to attract more FDI, especially in manufacturing.
Chart 18 presents government revenues in the Current Path and Financial Flows scenario.
Wagner's law, or the law of increasing state activity, is the observation that public expenditure increases as national income rises. It is, therefore, reasonable to expect that government revenues will increase as a per cent of GDP in the Financial Flows scenario compared to the Current Path forecast.
Measured as a per cent of GDP, government revenue in DR Congo stood at 11.8% of GDP (equivalent to about US$5.8 billion) in 2022. In the Current Path forecast, government revenue will reach 17.3% (equivalent to US$45 billion) of its GDP in 2043. In the Financial Flows scenario, however, government revenues will increase by nearly 0.5 percentage points of GDP to about US$47.8 billion (equivalent to 17.8% of GDP) in 2043. Much of the increase is due to foreign aid and the effect of more inward investment on growth.
Despite its vast size, DR Congo, under the 2006 Constitution, transitioned from a highly centralized state with 11 provinces into 26 new territorial units, but the implementation of decentralization has been problematic, according to Zongwe:
‘The timing of the decentralisation policy has been significantly driven by political calculations rather than resource constraints, such as a recent attempt by the ruling government to further divide provinces. The process suffered complications, like delays in electing new governors, which in turn led to litigation before the Constitutional Court in September 2018. These difficulties take place in a broader context of even greater challenges, including insufficient capacity of provincial administrators, fiscal decentralisation, the questionable economic viability of most provinces, and repeated removal or resignation of governors.’[22DP Zongwe, Decentralization in the Democratic Republic of the Congo, Autonomy Arrangements in the World, March 2019, DOI: 10.13140/RG.2.2.20028.08321.]
By starving the provinces of money, Kinshasa effectively manages the country from the centre. Between 2007 and 2013, for example, only 6%–7% of taxes were transferred instead of the 40% prescribed in the Constitution.[23DP Zongwe, Decentralization in the Democratic Republic of the Congo, Autonomy Arrangements in the World, March 2019, DOI: 10.13140/RG.2.2.20028.08321.]
A report by Transparency International[24Transparency International, Overview of corruption and anti-corruption in the DRC, 2010.] points out that, ‘clientelism, rent-seeking and patronage have decimated fair competition, particularly in the sectors of public procurement and extractive industries in DR Congo’. The report notes that, ‘the ruling elite has a direct stake in the country's economy, and often steer economic activities in accordance [with] their own personal opportunities.’ Often these same state officials present themselves as private entrepreneurs or resort to their parents (or other family members) to obtain state contracts.[25See for example: B Akitoby and M Cinyabuguma, Sources of Growth in the Democratic Republic of the Congo: A Cointegration Approach, IMF Working Paper WP/04/114, July 2004; International Monetary Fund, Democratic Republic of the Congo: Staff-monitored program and request for disbursement under the rapid credit facility, Press Release, Staff Report and Statement by the Executive Director for the Democratic Republic of the Congo, 23 December 2019.]
Corruption is endemic in DR Congo and permeates all sectors. It ranges from basic bureaucratic and administrative corruption to grand forms of corruption involving high-ranking members of the government and defence and security forces. The extractive (oil and mining) sector, tax and customs administrations, and the state-run enterprises are among the most affected. Significant amounts of mining revenues and taxes are not channelled to the treasury. Gécamines, the largest state-run company in the mining sector, is often cited as the main facilitator in the diversion of the mining revenue from the government budget.[26Global Witness, Regime cash machine: How the Democratic Republic of Congo's booming mining exports are failing to benefit its people, 21 July 2017.]
As defined by the World Bank, government effectiveness ‘captures perceptions of the quality of public services, the quality of the civil service and the degree of its independence from political pressures, the quality of policy formulation and implementation, and the credibility of the government’s commitment to such policies’.
Poor government effectiveness and the absence of strong institutional and legal mechanisms to ensure accountability hamper economic progress and further deepen corruption. In 2019, DR Congo ranked 168th of 180 countries on the Transparency International corruption perceptions index. This significantly affects domestic revenue mobilisation, and hence compromises the badly needed investment in basic socio-economic infrastructure.
Following pressure from the international community, a legal framework to combat corruption was established under Joseph Kabila’s regime but remains ineffective. It often serves more as a political weapon than an actual indication of political will to tackle corruption. As pointed out by Matti, ‘the rent-seeking elites in DR Congo generally lack the incentives and political will to build strong institutions to curb corruption.’
However, the new president has made a strong commitment to deviate from the inefficiency, corruption and political patronage that have characterised governance since Mobutu’s era. Thus, a new commission to combat corruption has been created — l'Agence de prévention et de lutte contre la corruption (APLC) — and some high-level arrests have been made, such as the president’s chief of staff, Vital Kamerhe, who was found guilty of embezzlement. However, Vital Kamerhe's supporters and some observers perceive his arrest as politically motivated given his presidential ambitions for 2023 rather than a step towards the establishment of the rule of law in the country.
This Goernance scenario assumes better governance consisting of stability, capacity and inclusion. It measures a state’s progress using the average of these three indices. To this end, it includes an index (0 to 1) for each dimension, with higher scores indicating improved outcomes. A combined governance index is the average of these three indices.
Visit the theme on Governance for a full conceptualisation and details on the scenario structure and interventions.
The capacity index indicates that DR Congo had 33.8% less government capacity in 2022 than the average of low-income African countries. In the Current Path forecast, DR Congo will have 18% less capacity in 2043 than the average of its African peers. In the Governance scenario, DR Congo will have 19.3% more capacity than the Current Path forecast in 2043, which will be just 2.2% less than its peers compared to a margin of 18% in the Current Path forecast.
The inclusion index indicates that DR Congo had 37.3% less inclusion in 2022 than the average of low-income African countries. In the Current Path forecast, DR Congo will have 39.9% less inclusion in 2043 relative to its low-income African peers, whereas in the Governance scenario, DR Congo will have 27.5% less inclusion relative to the estimated average for its peers.
Chart 19 presents progress with the three governance dimensions by 2043 in the Current Path and Governance scenario compared to 2019.
The composite governance index is an average of the scores for security, capacity and inclusion. In 2022, DR Congo’s governance index was estimated at 0.3, about 25.5% below the average of low-income African countries, indicating that DR Congo generally is more poorly governed than most low-income African countries. In the Current Path forecast, in 2043, the gap will decrease slightly relative to its peers, and the index will improve to 0.4, which will be 22.2% less than the average of its African peers. In the Governance scenario, at nearly 0.47, the gap will be reduced to 10.4% relative to the estimated average of its low-income African peers in 2043.
Chart 20 presents a stacked area graph on the contribution of each scenario to GDP per capita. The cumulative impact of better education, health, infrastructure, leapfrogging, etc. means an additional benefit in the integrated model that we refer to as the synergistic effect. The synergistic effect of all the scenarios on the GDP per capita is about US$1 593.
The Manufacturing scenario will have the largest impact, increasing GDP per capita by US$283 relative to the Current Path forecast for that year. The second and third largest impact on the GDP per capita will come from the Governance and AfCFTA scenarios, respectively. Each of these two scenarios will increase GDP per capita by US$207 and US$176, respectively. Given the continuous decline in aid flows, the Financial Flows scenario will have the least impact, increasing DR Congo’s GDP per capita by US$60 relative to the Current Path forecast in 2043.
In the short to medium term, the Agriculture scenario will have the greatest positive impact on the GDP per capita, taking it to US$1 809 in 2035, an increase of US$83 relative to the Current Path forecast in that year. The second and third largest impact on GDP per capita in 2035 will come from the Manufacturing and Infrastructure scenarios, respectively. In these two scenarios, GDP per capita will increase by US$70 and US$57 (respectively), relative to the Current Path forecast in 2035.
Chart 21 presents the impact of each scenario on extreme poverty by 2043. The user can select the number of extremely poor people or per cent of the population.
DR Congo is not on track to achieve the SDG goal of eliminating extreme poverty by 2030. In the Current Path forecast, by 2030, 65.7% of the Congolese people (equivalent to about 84.1 million) will be living in extreme poverty using US$2.15 at 2017 prices. The Combined scenario will reduce extreme poverty in DR Congo to 62.7% of the population—a reduction of about 3 percentage points relative to the Current Path forecast in 2030. The Agriculture scenario will have the largest impact in reducing extreme poverty, followed by the manufacturing and infrastructure scenarios by 2030. At the lower end, the AfCFTA scenario results in a modest increase in extreme poverty by about 0.5 percentage points relative to the Current Path forecast in 2030.
The Combined scenario shows that a policy push across all the development sectors is necessary to achieve sustained growth and development in DR Congo.
In the Combined scenario, by 2043 the extreme poverty figure for DR Congo will be reduced to 6.6% of the population (11.2 million people), 36.9 million people fewer people (or 19.6% of the population) relative to the Current Path forecast. The Manufacturing, Governance and Education scenarios (respectively) will have the largest impact on lifting the Congolese out of extreme poverty at US$2.15 a day by 2043. Only in the Manufacturing scenario, about 12.3 million (6.7%) Congolese will be lifted out of extreme poverty relative to the Current Path forecast by 2043.
Chart 22 compares the size of the economy in the Current Path with the Combined scenario at market exchange rates (MER).
The Combined scenario dramatically impacts the expansion of the Congolese economy (GDP). By 2043, the size of the economy will expand to US$449.8 billion compared to US$259.8 in the Current Path forecast in the same year—a 73.1% increase relative to the Current Path forecast.
The Combined scenario shows the transformative power of a comprehensive policy push across all development sectors in achieving sustained growth in DR Congo.
Chart 23 presents the change in the economy's structure, comparing the Current Path forecast with the Combined scenario.
In the Combined scenario, the material, manufacturing and agriculture sectors (respectively) will positively contribute to DR Congo’s GDP relative to the Current Path forecast by 2043. The material sector contribution to GDP will increase by 4.3%, to 30% of GDP. This will translate into an increase in GDP of US$68.2 billion attributable only to the materials sector in 2043 above the Current Path forecast.
Since the service sector is much larger than any other, it will contribute an additional US$48.8 billion to GDP relative to the Current Path forecast in 2043. However, its contribution to GDP will decline from the 2043 Current Path forecast of about 38% to 32.8% in the Combined scenario. DR Congo’s energy sector will contribute the least in 2043, about US$4.4 billion relative to the Current Path forecast in 2024, however, a decline in the share contribution to GDP of 0.6 percentage points compared to the Current Path of 2.6% of GDP.
Chart 24 presents the size of the informal sector as a share of GDP and the size of the informal labour force. Data on the contribution of the informal sector is often estimated and should be treated with care. There are several definitions of an informal economy, but it is generally considered to be a set of economic activities that are not subject to taxation and other regulations.
The informality rate in DR Congo is one of the highest in the world. The size of DR Congo’s informal sector was estimated at 41.8% of GDP (equivalent to US$20.7) in 2022—the largest among the low-income African countries and the third largest in Africa after Zimbabwe (54.5%) and Tanzania (45.6%).
In the Current Path forecast, in 2043 the size of the informal sector will reduce to about 33% of GDP (but increase in value to US$61.9 billion). However, in the Combined scenario, the informal sector as a percentage of GDP will be reduced to 23.5% in 2043. This is a reduction of 9.5 percentage points of GDP relative to the Current Path forecast.
Chart 25 compares life expectancy in the Current Path forecast with the Combined scenario.
In 1960, the average female born in DR Congo could expect to live 42.5 years, while the average male could expect to live 39.6 years. The average total life expectancy was 41.1 years. Since then, life expectancy in DR Congo has improved by 21.3 years for females to 63.7 years and by 21.7 years for males to 61.3 years. In 2022, total life expectancy in DR Congo was estimated at 62.5 years, which was 0.9 years below the average of low-income African countries. In the Current Path forecast, life expectancy in DR Congo will improve to 68.1 years in 2043. In the Combined scenario, however, it will improve to 69.7 years. This will be just 0.1 years below the average of low-income African countries, which will be 69.8 years by 2043.
Chart 26 compares the Gini coefficient in the Current Path forecast with the Combined scenario.
Inequality in DR Congo, using the Gini coefficient index, is historically slightly higher than the average for low-income African countries and significantly higher than the average for Africa. Civil wars and general instability have exacerbated inequality across DR Congo and in 2022 it had a Gini index of 0.42.
In the Current Path forecast, inequality in DR Congo will decrease slightly to about 0.4 in 2043. In comparison, the Combined scenario will reduce inequality in DR Congo by 17.2% relative to the Current Path forecast to 0.32 in 2043.
The materialisation of the Combined scenario would stimulate high economic growth and significantly reduce poverty in DR Congo, but the cost in terms of environmental degradation will be a challenge. To mitigate the environmental impact of the Combined scenario, its implementation should be accompanied by concrete steps to accelerate the green energy transition.
Chart 27 compares carbon emissions in the Current Path forecast with the Combined scenario.
The Combined scenario significantly impacts carbon emissions, albeit from a very low base. In the Current Path forecast, DR Congo’s carbon emissions will increase from about 2 million tons in 2022 to 25 million tons by 2043. The Combined scenario will increase carbon emissions by 5 million tons relative to the Current Path forecast in 2043.
DR Congo has abundant and varied energy resources such as hydroelectricity, biomass, solar, wind and fossil fuels. For instance, the country possesses a huge potential of hydroelectric power estimated at 100 GW, which represents about 13% of the world's hydroelectric potential. The country also has a potential estimated at 70 GW for solar and 15 GW for wind power. In sum, DR Congo can become a leading exporter of electricity in Africa.
Paradoxically, DR Congo has one of the largest deficits in energy access and one of the lowest rates of electrification in the world. The energy supply is largely insufficient for the country's needs and energy consumption comes mainly from biomass. Only 3% is generated by hydroelectric power, the rest is from charcoal and firewood.
The increased economic activity in the Combined scenario will cause elevated energy demand and altered energy production. Chart 28 compares energy demand and production in the Current Path forecast with the Combined scenario. Production is done in six types, namely oil, gas, coal, hydro, nuclear and other renewables. The data is converted into million barrels of oil equivalent (MBOE) to allow for comparisons between different sources. Note that energy production could be for domestic use or export.
DR Congo relies on imported hydrocarbon energy to meet its domestic energy demand. In 2022, the country’s energy production was estimated at about 64 million barrels of oil equivalent, creating an unmet demand of about five million barrels of oil equivalent. On the Current Path, by 2043 DR Congo’s energy production will increase to 232 million barrels oil equivalent and unmet demand will increase to 137 million barrels oil equivalent, pointing to a future of ongoing energy import dependence. In 2043, DR Congo will import 35.7% of its energy requirements in the Current Path forecast. The Combined scenario will increase production to 321 million barrels of oil equivalent and reduce energy import requirements by 2.8 percentage points relative to the Current Path forecast. The contribution of renewable energy will increase from 56.8% (Current Path forecast) to 66.9% of total energy production in 2043.
The positive shift towards sustainability, with the contribution of renewable energy, suggests a potential pathway for DR Congo to enhance energy security and reduce dependency on imports by embracing renewable sources.
Chart 29 summarises the findings and policy recommendations for DR Congo.
This report outlines the current development challenges faced by DR Congo and the strategic opportunities to put the country on a path of inclusive and sustainable growth.
The analysis revealed that despite some signs of improvement, DR Congo is still facing huge development challenges of chronic poverty and underdevelopment, influenced by political instability and ineffective governance. Significant progress is yet to be made in diversifying its economy away from commodity exports which are at the mercy of highly volatile global commodity markets. The Current Path (or business as usual) analysis shows that the country will fail to achieve most of the 2030 SDG targets as it failed to achieve any MDGs by 2015. Unemployment is massive, and millions of Congolese continue to live in extreme poverty, worsened by the impacts of climate change.
The Current Path analysis and the scenario simulations revealed that lack of industrialisation, bad governance, infrastructure shortage, low agricultural productivity, limited export diversification and low stock and quality of human capital are some of the key factors holding back the country's developmental progress. Tackling these issues is crucial to set the country on a path of sustained growth and shared prosperity. Given DR Congo’s complex development challenges, the government must take decisive, targeted actions on the priority policies outlined below:
Agriculture productivity and food security
- Boost agricultural production and productivity by investing in productivity-enhancing technologies and facilitating access to high-yield, disease- and drought-resistant seedlings, fertiliser and credit guarantees for farmers and supporting R&D activities in building resilience and agricultural productivity.
- Protect agricultural production and commercialisation from weather events by investing in climate-resilient infrastructure, particularly the rural road network to facilitate the flow of agricultural produces from the farmers to the market. Other examples are solar power that facilitates irrigation and cooling of food storage could be adopted.
Economic diversification and industrialisation
- Promote downstream beneficiation and undertake reforms in the business environment aimed at reducing business costs and risks by improving the quality of business regulation. Simplifying administrative procedures and formalities makes it easier for firms, specifically small- and medium-sized enterprises (SMEs) to do business, to test new ideas and to grow.
- Encourage citizens to build an entrepreneurial mindset to shift labour from the large informal sector to businesses in the formal economy.
Infrastructure development
- Address infrastructure deficits which undermine private sector development in the country. A reliable electricity supply can be provided through mini-grid and off-grid solutions using renewable energy.
- Improve rural transport networks with reliable and all-weather rural road access to facilitate agricultural commercialisation.
- The government should remedy the infrastructure deficit by first fixing and maintaining its existing infrastructure. This includes the full re-opening of the Congo River, as well as the provision of basic infrastructure such as roads and rail, electricity, safe water supply, and ICT infrastructure.
Education, Health and Demographics
- Curriculums need to be reviewed in collaboration with the private sector and industrialists to match with the needs of the labour market.
- Government must roll out the free primary education programme along with the improvement in access to technical and vocational education, and higher education, especially in sciences and engineering to enhance the country’s capabilities to absorb new knowledge and technologies.
- Investment in education should go hand-in-hand with the improvement in the quality of the health system and access to affordable healthcare.
- Teachers in primary and secondary schools should be properly trained or removed from the education system..
- Invest in human capital and skills development. Availability of skilled labour at a reasonable cost and in abundant supply should be one of the key drivers for FDI attraction and industrialisation
- Continue the roll-out of modern contraceptives by focusing on the underserved, younger, more rural population groups where contraceptive awareness-raising campaigns and uptake remain low.
Good Governance
- The promotion of good governance and strong institutions should be at the centre of government actions. This will increase the country’s ability to mobilise domestic revenues and hence, improve the government's capacity and the quality of spending. Stronger institutions, particularly oversight and monitoring, are crucial for DR Congo to harness fully its immense natural wealth and to improve the living standard of the population. The government must publish all new mining contracts and the audits of state-owned enterprises, including the details regarding its resource agreements with foreign governments. Parliament must be provided with detailed and full access to government spending including within the security agencies. The independence of the judiciary must be confirmed as a key resource to combat corruption.
By implementing these strategies, DR Congo can harness its vast resources to forge a prosperous future for its citizens. However, as DR Congo continues to implement these ambitious plans, it will be crucial to maintain a balanced approach that promotes economic growth while ensuring environmental sustainability and equitable wealth distribution.
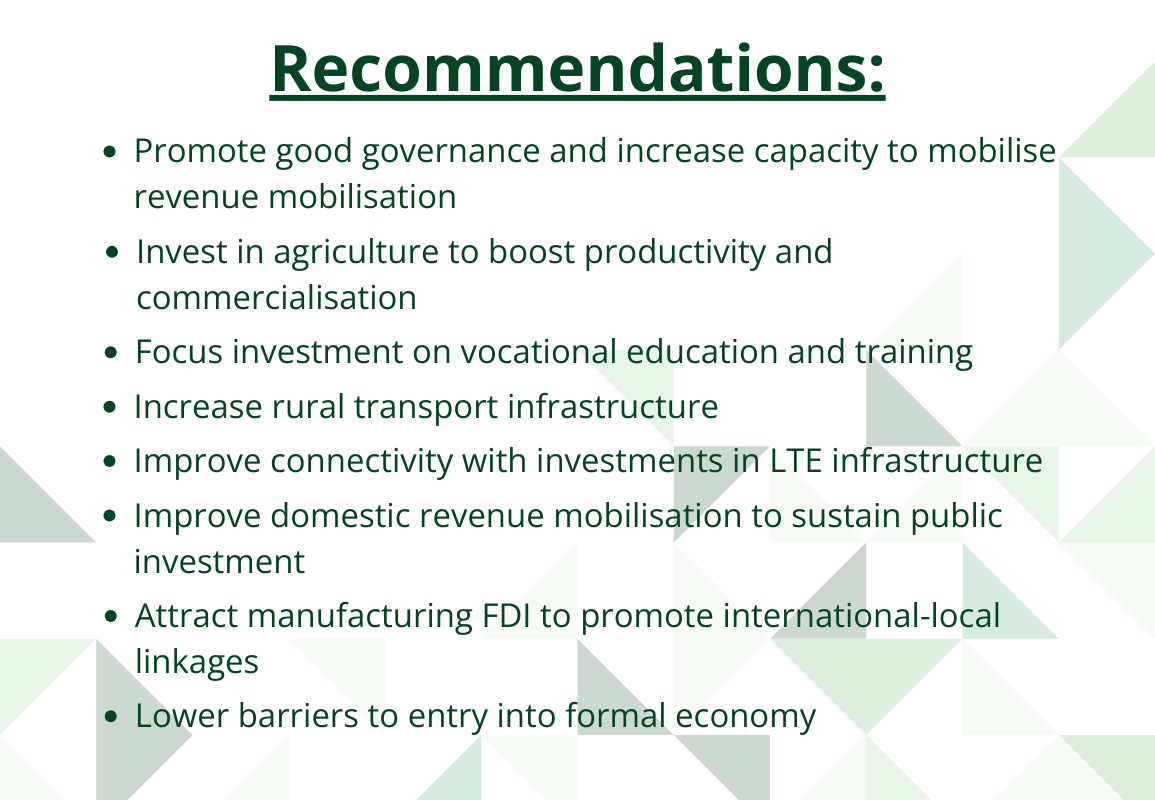
LIST OF INTERVENTIONS WITHIN IFs
All interventions start in 2024 and interpolate to 2033 after which they are maintained at that level, unless indicated otherwise.
|
Name |
Description |
Country or Group |
Adjustments within IFs 7.84 |
Remarks |
|
Governance scenario |
||||
|
democm |
Democracy |
DR Congo |
Interpolate to 1.2 |
Improves average democracy by 18.6% above Current Path forecast in 2043 but average in 2043 still lower than South America and South Asia. |
|
econfreem |
Economic freedom |
DR Congo |
To 1.12 |
Improves average economic freedom by 14.5% above Current Path forecast in 2043. Takes the DR Congo to above average of South Asia and South America in 2031. |
|
govcorruptm |
Government corruption |
DR Congo |
To1.2 |
Improves government transparency by 26% above Current Path forecast in 2043. Average takes Africa to above South Asia in 2028 but remains below South America. |
|
goveffecttm |
Government |
DR Congo |
To1.2 |
Improves |
|
effectiveness (quality) |
government effectiveness 21.2% above Current Path forecast in 2043. Gets to average of South Asia in 2033 still below averages of South America in 2043 |
|||
|
govregqualm |
Government regulatory quality |
DR Congo |
To 1.2 |
Improves average regulatory quality by 24.2% above Current Path in 2043. Takes Africa to above South Asia in 2029 and to the average of South America in 2043. |
|
sfintlwaradd |
State failure/internal war probability (sfintlwaradd) |
DR Congo |
To -0.4 |
Improves IFs government security index. Africa still below average of South Asia and South America. |
|
sfintwarmagm |
State failure through instability – magnitude, multiplier (sfintwarmagm) |
DR Congo |
To 0.8 |
Improves IFs government security index. Africa still below average for South Asia and South America. |
|
Demographics and Health scenario |
||||
|
contrusm |
Contraception use multiplier (contrusm) |
DR Congo |
To 1.35 |
Contraceptive use for DR Congo increases by 16.3 percentage points above Current Path in 2043. Instead of gap of 47.9 percentage points with South America (2019), gap closes to 20 points in 2043 |
|
watsafem (OthImproved) |
Percentage of people with access to other improved safe water (watsafem othimproved) |
DR Congo |
To 1.2 |
In place of reduction in unimproved that is used for other countries. |
|
Sanitation (Improved) |
Per cent of population with access to improved sanitation |
DR Congo |
To 1.5 |
In place of reduction in unimproved that is used for other countries. |
|
malmortatiom |
Maternal mortality ratio multiplier |
DR Congo |
To 0.73 |
Rates in DR Congo is less than for other comparable contries. The intervention moves DR Congo closer to South America. In 2019 maternal mortality was 50.4/100 000 live births in DR Congo compared to 13.8 in South America and 34.7 in South Asia. By 2043 DR Congo gets to 19.3 in the scenario instead of 27.1 in the Current Path forecast. |
|
hlmortcdchldm |
Communicable disease mortality multiplier for children under five |
DR Congo |
To 0.72 |
Rates in DR Congo are much higher than for other comparable countries/regions. The intervention moves DR Congo closer to South America |
|
hlmortm (AIDS) |
Mortality multiplier |
DR Congo |
To 0.6 |
DR Congo has one of the highest AIDS mortality rates globally. |
|
hlmortm (malaria) |
Mortality multiplier |
DR Congo |
To 0.5 |
DR Congo has one of the highest malaria |
|
mortality globally. In 2019 it is 0.488/1 000. On the Current Path it declines to 0.192 in 2043. In the scenario it declines to 0.08 |
||||
|
hlmortm (OthCommumDis) |
Mortality multiplier |
DR Congo |
To 0.9 |
Intervention on mortality rates from other communicable diseases are applied to DR Congo with a higher burden and with slow decline over the forecast horizon. |
|
Education scenario |
||||
|
edseclorvocadd |
Lower secondary, vocational share, additive factor, decimal rate |
DR Congo |
To 4.7 (male) To 4 (female) |
|
|
edsecupprvocadd |
Upper secondary, vocational share, additive factor, decimal rate |
DR Congo |
To 5 (male) To 8 (female) |
|
|
edtersciencshradd |
Tertiary, sci-eng share of graduates, additive factor, decimal rate |
DR Congo |
To 5 |
|
|
edpriintnm |
Primary net intake rate multiplier (total) |
DR Congo |
To 1.12 (male) To 1.22 (female) |
|
|
edprigndreqintn |
Primary gender particy time for intake, years |
|||
|
edprisum |
Primary, survival rate, multiplier (total) |
DR Congo |
To 1.22 (male) To 1.12 (female) |
|
|
edseclowrtranm |
Lower secondary transition rate multiplier |
DR Congo |
To 1.1 (male and female) |
|
|
edseclowrgndreqtran |
Lower secondary gender parity time for transition, years |
|||
|
edsecupprtranm |
Upper secondary transition rate multiplier |
DR Congo |
To 1.1 (male and female) |
|
|
edsecupprgndreqtran |
Upper secondary gender parity time for transition, years |
|||
|
edseclowrgram |
Lower, secondary, graduation rate, multiplier |
DR Congo |
To 1.21 (male) To 1.36 (female) |
|
|
edsecupprgram |
Upper secondary, graduation rate, multiplier (total) |
DR Congo |
To 1.2 (male) To 1.35 (female) |
|
|
edterintm |
Tertiary, intake rate, multiplier, total |
DR Congo |
To 1.22 (male) To 1.2 (female) |
|
|
edtergndreqint |
Tertiary, gender parity time for intake, years |
|||
|
edtergradm |
Tertiary, graduation rate multiplier |
DR Congo |
To 1.6 (male) To 1.3 (female) |
|
|
jedqualpriallm |
Quality, multiplier on primary (total) |
DR Congo |
To 1.2 |
|
edqualsecallm |
Quality, multiplier on secondary (total) |
DR Congo |
To 1.2 |
|
|
Agriculture scenario |
||||
|
ylm |
Yields multiplier |
DR Congo |
To 1.6 |
|
|
landirareaequipm |
Multiplier on land equipped for irrigation |
DR Congo |
To 1.5 |
|
|
aglossprodm |
Loss rate of agricultural production (crop) |
DR Congo |
To 0.8 |
|
|
aglosstransm |
Loss rate of agriculture as moves from producer to consumer multiplier |
DR Congo |
To 0.8 |
|
|
clpcm |
Per capita calorie demand multiplier |
DR Congo |
To 1.12 |
|
|
forestm |
Increased forest protection |
DR Congo |
To 1.01 |
|
|
waterwithdrawalm |
Groundwater withdrawal (cubic km) |
DR Congo |
To 1.06 |
|
|
infraroudraitrgtval |
Road access target, fixed value percent |
DR Congo |
To 95 |
|
|
infraroundraitgtyr |
Road access target, years to reach |
DR Congo |
To 40 |
|
|
Manufacturing scenario |
||||
|
govhhtrnwelm (unskilled) |
Government to household welfare transfers |
DR Congo |
To 1.2 |
|
|
hhtaxrm |
Household tax rate multiplier, by skill level |
|||
|
govbusregindm |
Government regulation of business index multiplier?/ |
DR Congo |
To 0.85 |
|
|
isdm |
Investment in manufacturing sector |
DR Congo |
To 1.05 |
|
|
randdexpm |
Increase research development activities (total) |
DR Congo |
To 1.5 |
|
|
labparm |
Total labour participation rate (male & female), female more aggressive |
DR Congo |
To 1.01 (male) To 1.03 (female) |
|
|
Large Infrastructure/Leapfrogging scenario |
||||
|
qem - Q (OthRenew) |
Capital cost to output ratio in energy |
DR Congo |
To 0.8 |
|
|
enpm (OthRenew) |
Energy production multiplier for other renewables |
DR Congo |
To 1.2 |
|
|
infraelecaccm (urban) |
Electricity access multiplier urban |
DR Congo |
To 1.04 |
|
|
infraelecaccm (rural) |
Electricity access multiplier rural |
DR Congo |
To 1.27 |
|
|
ictbroadmobilm |
ICT mobile |
DR Congo |
To 3 |
|
|
broadband multiplier |
||||
|
ictbroadcostm |
ICT broadband multiplier on cost of adding a connection |
DR Congo |
To 0.8 |
|
|
ictbroadm |
ICT broadband multiplier |
DR Congo |
To 1.5 |
|
|
Infraroadpavedpcntm |
Paved road |
DR Congo |
To 1.2 |
|
|
gdpinformshrm |
Informal sector |
DR Congo |
To 0.95 |
|
|
AfCFTA scenario |
||||
|
mfpadd |
Multifactor productivity growth additive factor |
DR Congo |
To 0.007 |
Free trade unleashed productivity growth. In a study by the IMF, a percentage point decline in input tariffs is estimated to increase total factor productivity growth by about 2% in developing countries. The intervention increased DR Congo’s multifactor productivity growth rate by an average of about 20 percentage points relative to the Current Path forecast over the period 2026-2035. |
|
XSM |
Export multiplier – Manufacturing |
DR Congo |
To 1.22 |
Note: Economic freedom is now part of Governance and not part of the AfCFTA scenario |
|
XSM |
Export multiplier – Agriculture |
DR Congo |
To 1.22 |
|
|
XSM |
Export multiplier – Services |
DR Congo |
To 1.2 |
|
|
XSM |
Export multiplier – ICT |
DR Congo |
To 1.1 |
|
|
XSM |
Export multiplier – Materials |
DR Congo |
To 1.1 |
|
|
XSM |
Export multiplier – Energy |
DR Congo |
To 1.05 |
|
|
xshift |
Export shift as a result of promotion of exports (Manufactures) ratio |
DR Congo |
To 0.008 |
In the World Bank policy research paper , export promotion agencies for developing countries will have an elasticity of 8%. In the World Economy paper, each additional export promotion agency increases exports by 6–10%. |
|
mtarifftaxrm |
Import tariff tax multiplier by country and sector: Agriculture Materials Energy, Service, and ICT sector |
DR Congo DR Congo DR Congo |
LDC: Interpolate from 1 in 2029 to 0.1 in 2042 (13 years) LDC: Interpolate from 1 in 2023 to 0.01 in 2033 (10 years) LDC: Interpolate from 1 in 2023 to 0 in 2033 (10 years) |
Under the AfCFTA, agriculture products are under sensitive products, have a fixed 10% tariff. (See for example, tralac, African Continental Free Trade Agreement.) Non-sensitive products have a 100% tariff reduction under the AfCFTA. Only a few products are under the 3% of the excluded products, for example, corrugated flat-rolled steel. |
Manufacturing sector |
DR Congo |
LDC: Interpolate from 1 in 2023 to 0.05 in 2033 (10 years) |
Few manufactured products are under sensitive and excluded products. |
|
|
Financial Flows scenario |
||||
|
xworkremitinm |
Worker remittances multiplier (positive numbers are receipts) |
DR Congo |
To 1.1 |
|
|
aidrecm |
Aid (foreign) receipts multiplier |
DR Congo |
To 1.15 |
We need to increase the provision of aid from OECD countries and FDI outflows from there and China. |
|
xfdistockm |
Foreign direct investment, stocks of investment from abroad, multiplier |
DR Congo |
To 1.08 |
|
|
xfdistoutm |
Foreign direct investment, stocks of outward investment, multiplier |
DR Congo |
To 0.8 |
|
|
xportfoliom |
Portfolio investment, stocks of investment from abroad, multiplier |
DR Congo |
To 1.5 |
|
|
Combined Agenda 2063 scenario |
||||
|
Combination of all the above |
||||
The adjustment made to the project data file is listed below:
|
IFs Data series |
Updated years |
Source used for update |
|
Labour force size (SeriesLabor) |
2021-2023 |
World Development Indicators |
|
Population (SeriesPopulation) |
2022 |
World Development Indicators |
|
Malaria deaths per 100,000 |
2000-2021 |
WHO- World Malaria report 2022 |
|
Total fertility rate: Children per woman (SeriesTFR) |
2021 |
World Development Indicators |
|
Infant mortality rate (SeriesInfMortRateIHME) |
2010-2021 |
World Development Indicators |
|
Level of corruption (SeriesCorruption) |
2012-2023 |
Transparency International |
|
Economic freedom level on scale of 1 to 10 (most free) (SeriesFreedomEcon) |
2020-2021 |
Fraser Institute |
|
Civil and political freedom level (SeriesFreedom) |
2021–2024 |
Freedom House |
|
Government expense as per cent of GDP (SeriesGovExpense%GDP) |
2005-2022 |
IMF |
|
Size of informal sector as per cent of GDP (SeriesGDPInformal%Blended) |
2009–2020 |
World Bank |
|
Labour force size (SeriesLabor) |
2021-2023 |
WDIs |
Endnotes
World Bank, Democratic Republic of Congo, Systematic Country Diagnostic, Report No. 112733-ZR, 2018.
World Bank, Democratic Republic of Congo, Systematic Country Diagnostic, Report No. 112733-ZR, 2018.
DP Zongwe, Decentralization in the Democratic Republic of the Congo, Autonomy Arrangements in the World, March 2019, 9, DOI:10.13140/RG.2.2.20028.08321
DR Congo, Agence nationale pour la promotion des investissements, 2020.
B Akitoby and M Cinyabuguma, Sources of Growth in the Democratic Republic of the Congo: A Cointegration Approach, IMF Working Paper WP/04/114, July 2004, 5–7.
G Prunier, Africa's World War: Congo, the Rwandan Genocide, and the Making of a Continental Catastrophe, Oxford: Oxford University Press, 2009.
World Bank, Democratic Republic of Congo, Systematic Country Diagnostic, Report No. 112733-ZR, 2018.
The breakdown of the Katanga province into several smaller provinces also aimed at stripping the former Katanga governor and then-presidential hopeful Moise Katumbi of a potential electoral base. DP Zongwe, Decentralization in the Democratic Republic of the Congo, Autonomy Arrangements in the World, March 2019, 10–14, DOI: 10.13140/RG.2.2.20028.08321.
B Naughton et al, DRC survey: An overview of demographics, health, and financial services in the Democratic Republic of Congo, START Center, University of Washington, March 2017.
LS Ho et al, Effects of a community scorecard on improving the local health system in Eastern Democratic Republic of Congo: Qualitative evidence using the most significant change technique, Conflict and Health, 9:27, 2015
Republique Democratique du Congo, Ministère de la santé publique, Plan national de développement sanitaire 2016–2020, 2016
World Bank, Education in the Democratic Republic of Congo: Priorities and Options for Regeneration, World Bank Country Study, Washington, DC: World Bank, 2005
World Bank, Education in the Democratic Republic of Congo: Priorities and Options for Regeneration, World Bank Country Study, Washington, DC: World Bank, 2005
African Development Bank, DRC Green Mini-Grid Program, 2019
Nations Unies, Commission Economique pour l’Afrique, Profile de pays: République démocratique du Congo 2017, Addis Ababa: NU.CEA, 2018–03.
World Bank, Increasing access to electricity in the Democratic Republic of Congo: Opportunities and challenges, 2020
V Foster and DA Benitez, The Democratic Republic of Congo's Infrastructure: A Continental Perspective, Washington DC: World Bank, 2011.
African Development Bank, DRC Green Mini-Grid Program, 2019.
M Mateso, RD-Congo: la construction d’Inga, le plus grand barrage du monde, peine à démarrer, Geopolis, 16 March 2015.
M Mateso, RD-Congo: la construction d’Inga, le plus grand barrage du monde, peine à démarrer, Geopolis, 16 March 2015.
Congo Research Group, I need you, I don't need You: South Africa and Inga III, March 2020, Congo Research Group and Phuzumoya Consulting.
DP Zongwe, Decentralization in the Democratic Republic of the Congo, Autonomy Arrangements in the World, March 2019, DOI: 10.13140/RG.2.2.20028.08321.
DP Zongwe, Decentralization in the Democratic Republic of the Congo, Autonomy Arrangements in the World, March 2019, DOI: 10.13140/RG.2.2.20028.08321.
Transparency International, Overview of corruption and anti-corruption in the DRC, 2010.
See for example: B Akitoby and M Cinyabuguma, Sources of Growth in the Democratic Republic of the Congo: A Cointegration Approach, IMF Working Paper WP/04/114, July 2004; International Monetary Fund, Democratic Republic of the Congo: Staff-monitored program and request for disbursement under the rapid credit facility, Press Release, Staff Report and Statement by the Executive Director for the Democratic Republic of the Congo, 23 December 2019.
Global Witness, Regime cash machine: How the Democratic Republic of Congo's booming mining exports are failing to benefit its people, 21 July 2017.
Page information
Contact at AFI team is Blessing Chipanda
This entry was last updated on 10 May 2024 using IFs v8.18.
Donors and sponsors


Reuse our work
- All visualizations, data, and text produced by African Futures are completely open access under the Creative Commons BY license. You have the permission to use, distribute, and reproduce these in any medium, provided the source and authors are credited.
- The data produced by third parties and made available by African Futures is subject to the license terms from the original third-party authors. We will always indicate the original source of the data in our documentation, so you should always check the license of any such third-party data before use and redistribution.
- All of our charts can be embedded in any site.
Cite this research
Blessing Chipanda (2024) DR Congo. Published online at futures.issafrica.org. Retrieved from https://futures.issafrica.org/geographic/countries/dr-congo/ [Online Resource] Updated 10 May 2024.