Background note on Africa’s Current Path Energy Future to 2043
Contact at AFI team is Jakkie Cilliers
This entry was last updated on 9 November 2023.
Summary
Note on methodology and energy comparisons
The energy module within the International Futures (IFs) forecasting platform is driven by demand and supply dynamics within an equilibrium-seeking system that involves prices, trade, and investment. The size of the economy, population and energy intensity of the economy shape demand. While economic size and population are self-explanatory, the energy intensity in a country is calculated based on the energy usage per unit of gross domestic product (GDP). It is influenced by the country’s development level, the advance of technology, and energy prices.
To allow for comparisons between different sources of energy, such as from oil versus renewables, energy production is converted into millions or billions of barrels of oil equivalent (MBOE or BBOE) in six categories, namely oil, gas, coal, hydroelectric, nuclear, and other renewable energy.
Carbon emissions are presented in billion or million tons of carbon, not CO2 equivalent. It, therefore, consists of the mass of the carbon component of each greenhouse gas.
The forecast horizon is 2043, the end of the African Union’s third ten-year implementation plan of its long-term vision, Agenda 2063.
The data that follows is taken from IFs 8.10, which initialises its forecasts from IEA World Energy Balances in 2020 and includes selected Current Path adjustments for Egypt (nuclear), Angola (hydro), Mozambique (gas), Nigeria (hydro), Tanzania (gas and hydro), Ghana (gas reserves).
The IFs model uses a pooled approach to trade. Therefore exports and imports do not capture trade within regions or countries since each country trades with the rest of the world. As a result the data on energy imports and exports from IFs presented below, needs to be interpreted according.
All charts for Background note on Africa’s Current Path Energy Future to 2043
- Chart 1: Energy production by type: 2000-2043
- Chart 2: Forecast of energy demand: 2019-2100
- Chart 3: Energy demand vs production: 2019 to 2043
- Chart 4: Energy exports vs imports in US$: 2019 to 2043
- Chart 5: Barrels of oil equivalent per person, 2023 and 2043
- Chart 6: Carbon emissions from fossil fuels: 2019-2100
Energy demand and production (at the global level, they are essentially the same) continue to increase more rapidly than the global population even as the demand relative to GDP (energy intensity) declines slowly, reflecting greater energy efficiencies.
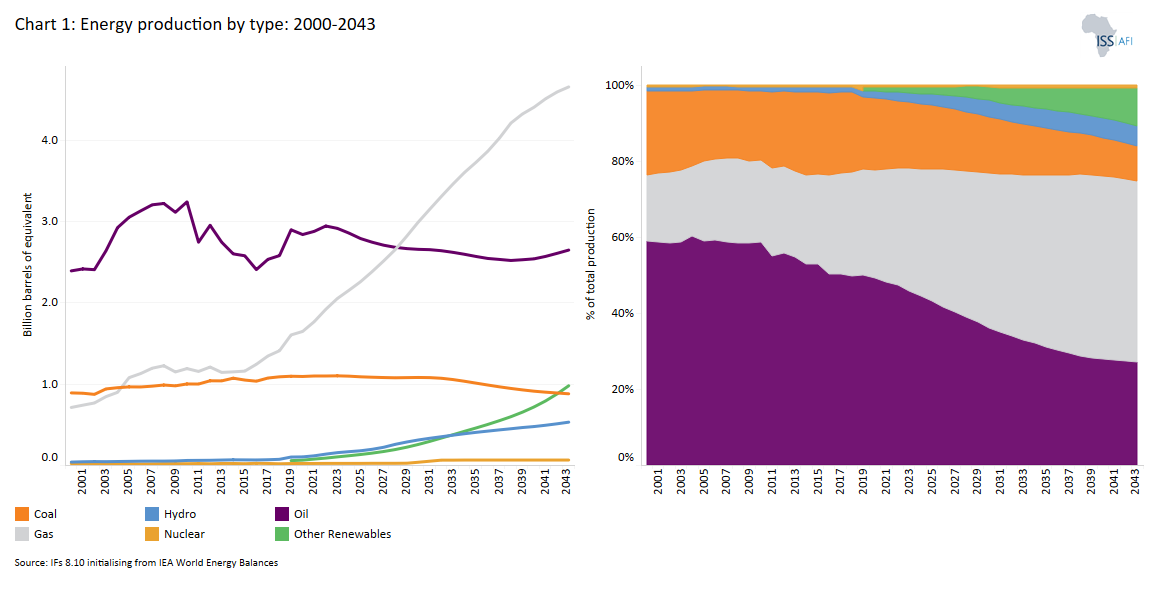
The historical picture since 2000 is presented in Chart 1, with a forecast to 2043. The trend of increased energy demand is evident when considering a world population that is set to increase from 8 billion in 2023 to 9.2 billion in 2043 (i.e. by 15%), while energy demand will increase from 94.8 BBOE, to 124.1 BBOE in 2043 (i.e. by more than double the population increase at 31%), reaffirming the strong relationship between energy availability and development. The data is available for various global groups, key countries, African regions and all African countries.
In 2023, only about 4.8% of global energy production came from ‘other renewables’, mostly sun and wind (equivalent to 4.6 BBOE). The share from oil was at 31%, gas at 27%, coal at 29%, and the remainder from nuclear (5.4%) and hydro (2.9%). The share of oil, coal and gas production, the three components of fossil energy in the global energy mix, has remained above 80% for the last two decades and is declining much more slowly than required to avoid rapid climate change.
Globally, the following important energy production transition points to 2043 are evident from Chart 1:
- Global gas production overtakes coal in 2026 and oil in 2031.
- The share from other renewables in global energy production overtakes nuclear in 2024, coal in 2040, oil in 2044, and gas in 2049.
In 2023, only about 1.6% of Africa’s energy production came from ‘other renewables’ equivalent to 0.1 BBOE. The share from oil is 45.8%, gas at 32.3%, coal at 17.3%, hydro at 2.5% and other renewables at 1.6%
In Africa, the following important energy production transition points to 2043 are evident from Chart 1:
- Gas overtakes oil in 2028
- Other renewables overtake hydro in 2033 and coal in 2042
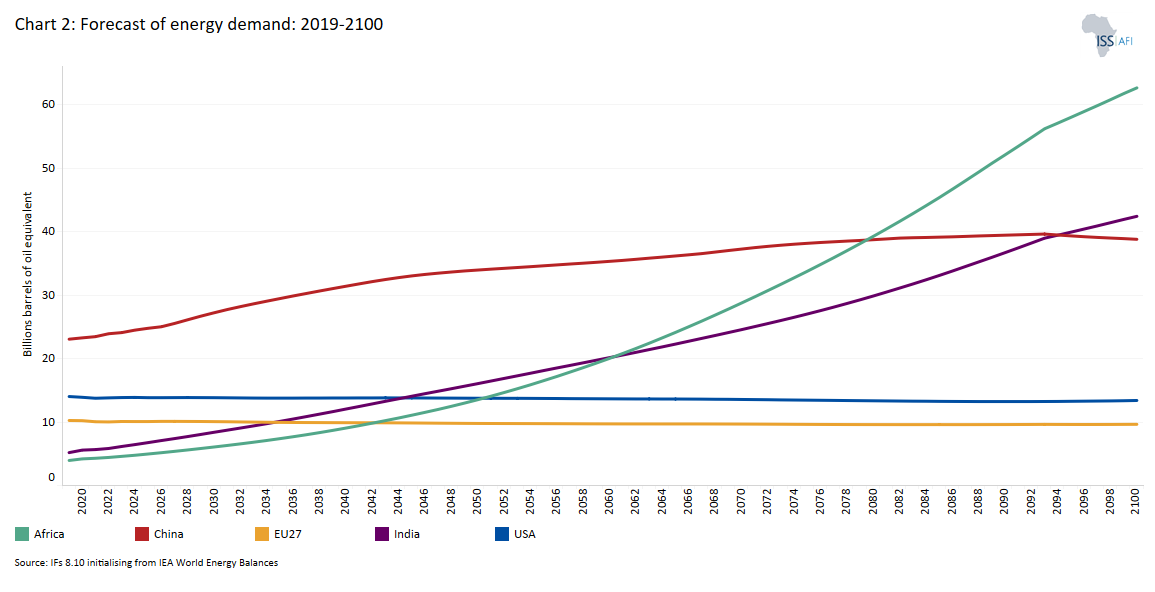
Because of a growing population and economy, Africa’s portion of the world energy demand will increase from 4.35% in 2019 to 14.82% by 2063. On the Current Path forecast, Africa’s energy demand will overtake the EU27 in 2043, the USA in 2050, India in 2050, and China in 2079.
The main reason for Africa’s increase in its energy demand is its growing population. In 2023, Africa’s population surpassed that of India and China. It will continue increasing rapidly after that.
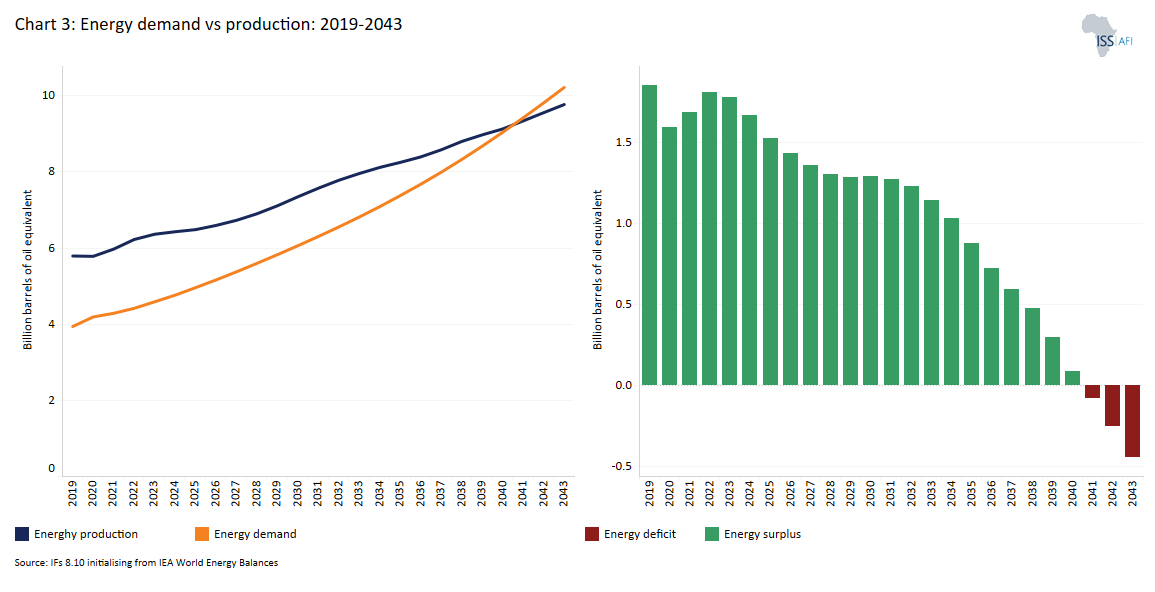
Africa is a net energy exporter, with much of its coal, unrefined oil and gas being produced locally is then subsequently exported to markets in Europe and Asia. Chart 2 presents energy production vs demand on the Current Path forecast for all African regions and countries. At the continental level, Africa’s total energy demand only exceeds production in 2039.
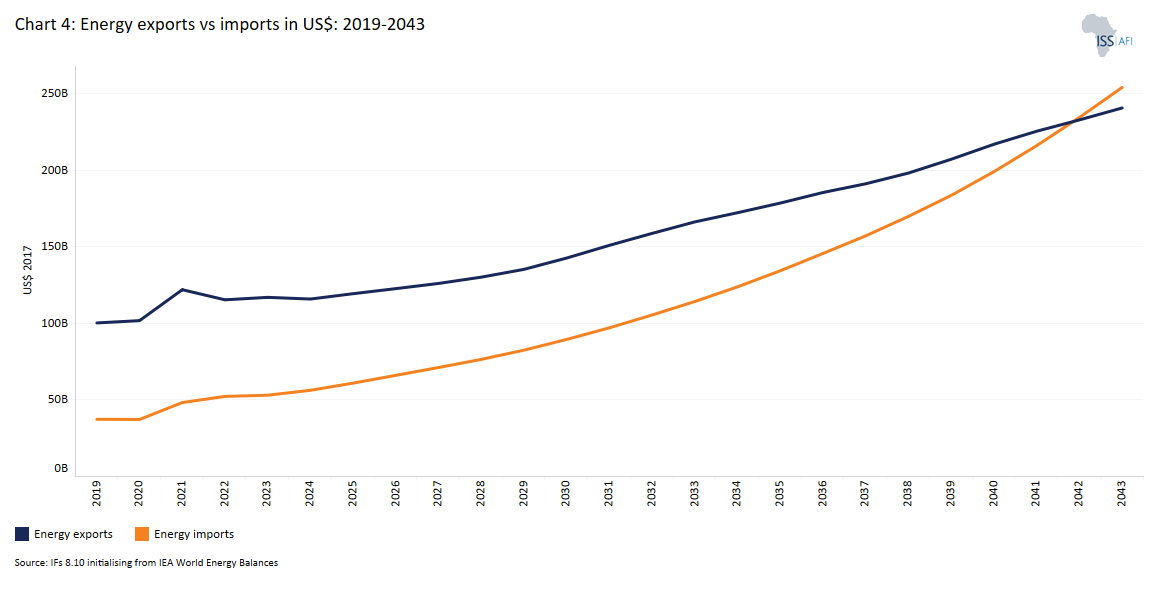
A different way to consider Africa’s energy situation and forecast is to compare energy exports vs imports in US$ (see Chart 4). In 2023, the value of energy exports from Algeria, Nigeria, Angola and Libya all exceeded imports by more than ten billion dollars. Energy imports by Morocco, on the other hand, amounted to more than US$5 billion. Other large energy importers (by value) are Egypt, Ethiopia, Kenya, Tunisia, Uganda, Senegal and Tanzania, all of whom imported more than one billion US$ worth of energy in 2023. The annual changes from year to year can be substantial, however.
By 2043, Algeria (at US$70.2 billion) will be exporting more energy than the combined total of Nigeria (US$32 billion), Angola (US$24.2 billion) and Mozambique (US$14.5 billion) - the second, third and fourth largest energy exporters in Africa. South Sudan (US$5.9 billion), the Republic of the Congo (US$5.7 billion), Chad (US$3.9 billion) and Gabon (at US$2.7 billion) will constitute a second tier of African exporters. Most African countries will be dependent on energy imports, however.
Considering energy imports minus exports, relative to demand, in 2023, several countries are dependent upon energy imports for more than 50% of their domestic demand, ranging from Senegal (for 95% of its demand), Morocco, Benin, Mauritania, Mauritius, Eritrea, Tunisia, Uganda, Mali and Togo (for 59% of its demand). By 2043 some additional countries will have joined this group, namely Burkina Faso, Mauritius, Eritrea, Cote d’Ivoire, Uganda, Zambia, Ethiopia, Egypt, Niger, Madagascar, Sudan, Rwanda, Libya, Cameroon and Djibouti.
Because the population of Africa will increase from 18% in 2023 to 23% of the world's total in 2043, and development is dependent on energy, Africa’s total energy demand will increase from 4.589 BBOE to 10.26 BBOE.
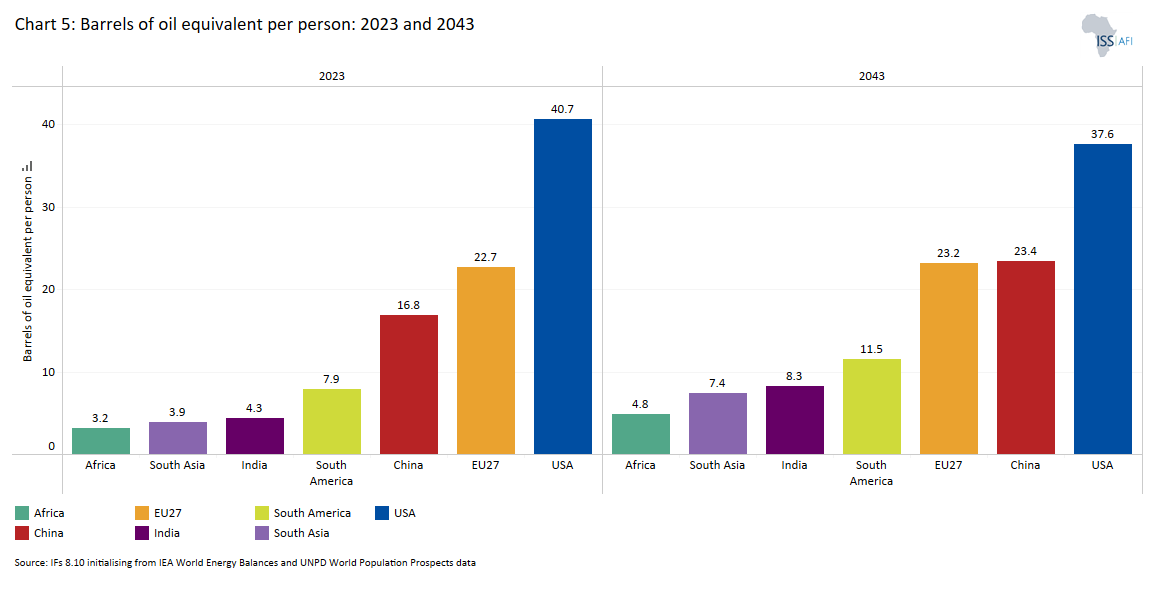
Annual energy use in Africa for 2023 differs between countries and ranges from Libya (18.4 barrels of oil equivalent per person), and Mauritius (16.1) to the Central African Republic (0.6) and Burundi (0.5). On the Current Path forecast, Africa’s energy demand will increase to 4.8 barrels per person in 2043.
The average American uses 40.7 barrels of oil equivalent in 2023 and 4.3 in India. By 2043, average US demand will decline to 37.7 barrels, reflecting modest improvements in energy efficiencies.
According to the BP Statistical Review of World Energy 2023, the top five African countries with 90% of Africa’s proven coal reserves are:
- South Africa (11 BBOE)
- Nigeria (2.5 BBOE)
- Zimbabwe (0.6 BBOE)
- Botswana (0.2 BBOE)
- Mozambique (0,2)
According to BP, Africa has 111.4 BBOE of proven oil reserves, currently 5% of the global total. The top 5 African countries with 80% of Africa’s proven oil reserves are:
- Libya (48.39 billion barrels of oil equivalent)
- Nigeria (36.9 billion barrels of oil equivalent)
- Algeria (12.2 billion barrels of oil equivalent)
- Egypt (3.3 billion barrels of oil equivalent)
- Angola (7.8 billion barrels of oil equivalent)
In its Global LNG Outlook 2023-2027, the Institute for Energy Economics and Financial Analysis (IEEFA) indicated that global demand for LNG is slowing. The institute “expects that sustained high global LNG prices; weak LNG demand growth and elevated price sensitivity in Asia; declines in gas consumption in Europe; and a multi-year string of global capital investments in cost-competitive energy alternatives will undermine global LNG demand growth over the next several years.”
Nigeria, Algeria, Mozambique, Egypt, Tanzania and Libya have considerable proven natural gas reserves, but there is very little installed gas infrastructure that would allow for domestic use. Instead, since the demand for gas is expanding particularly rapidly in Asia, the vast majority of Africa’s natural gas production will likely end up as exports to feed demand in China, India and elsewhere, Under the European Climate Law, for example, the EU aims to reduce gas demand by 35% compared to 2019 labels by 2030. The European Commission’s REPowerEU proposal could also imply a 52% reduction in EU gas demand by 2030 compared to 2019.
The IEEFA anticipates that the global LNG market will see a large number of new projects come online starting in mid-2025 and in 2026, giving way to a potential supply glut with lower-than-anticipated prices, smaller netbacks, tighter margins, and lower profits for LNG exporters.
Nigeria, Egypt, Libya, and Algeria account for almost 80% of Africa’s gas reserves. However, most new discoveries are in recent entrants to Africa’s gas market, namely Mozambique, Senegal, Tanzania, Mauritania, South Africa, Ethiopia, and Morocco.
According to the BP Statistical Review of World Energy 2023, proven gas reserves in Africa totalled 55.6 BBOE (around 10% of the global total). The ten countries with the largest reserves, collectively representing more than 80% of the total, are as follows :
|
Country |
Proven gas reserves (BBOE) |
|
Nigeria |
11.5 |
|
Algeria |
5.6 |
|
Egypt |
8.5 |
|
Mozambique |
5.6 |
|
Libya |
5.4 |
|
Angola |
5.3 |
|
Ghana |
3.8 |
|
Tanzania |
3.2 |
|
Senegal |
3 |
|
South Africa |
2.98 |
Amongst these countries, investment decisions have been made as follows:
- Nigeria has several major gas projects underway, including the Train 7 project at the Nigeria LNG plant and the AKK gas pipeline.
- Algeria - various, including the Sonatrach-Eni joint venture to develop the Berkine gas field.
- Egypt - Egypt's gas reserves are concentrated in the Mediterranean Sea, particularly in the Zohr field, which is expected to boost gas production significantly in the coming years. Egypt also invests in new gas exploration and production projects in the Red Sea and the Nile Delta.
- Libya's gas reserves are concentrated in the Ghadames Basin, located in the northwestern part of the country. The largest gas field in Libya is the Wafa field, which has an estimated 2.5 trillion cubic feet of gas in place, but production has been negatively affected by the war in the country.
- Mozambique has several major LNG projects underway, including the Mozambique LNG project led by TotalEnergies and the Rovuma LNG project led by ExxonMobil. The country has an estimated 180 trillion cubic feet of natural gas reserves, making it one of the most gas-rich countries in the world. In its Energy Outlook 2023, BP forecasts that Mozambique's gas production will reach 41.6 bcm in 2032 (0.224224 BBOE). The ongoing insurgency in Cabo Delgado province delayed the start of the project, now reported to restart in 2024 or 2025..
- The Tanzania LNG project could cost up to US$42 billion project develop and export liquefied natural gas (LNG) from Tanzania's offshore gas reserves. Talks on developing the LNG plant have been held intermittently since 2017 but have moved ahead more rapidly, with construction beginning around 2026, with first exports forecast for 2028.
Africa has the highest untapped hydropower potential worldwide, with only 37GW of installed capacity – roughly 11% of its potential. In 2023, only 2.5% of Africa’s energy production came from hydro (equivalent to 0.16 BBOE). An important reason for low implementation is the need for long transmission networks to transport electricity, often in unstable areas.
On the Current Path forecast, hydro will contribute 5.3% of the continent's production in 2043, equivalent to less than 0.5 BBOE. Several large hydroelectric schemes are currently being built in Africa. For example, Ethiopia recently completed the US$5 billion Grand Ethiopian Renaissance Dam (GERD) on the upper reaches of the Blue Nile close to its border with Sudan, the third-largest hydroelectric facility in the world in terms of installed capacity, capable of generating almost 6.5 GW in peak operating conditions. With the completion of GERD, Ethiopia is now the largest source of hydroelectric power in Africa, having overtaken the DR Congo.
There are also several other large projects underway, such as the Julius Nyerere Hydropower Plant and Dam in the Rufiji River basin in Tanzania that would deliver 2.1 GW.[1Xinhua, Tanzania allocates over 600 mln USD for mega hydropower project in 2020/2021, xinhuanet.com, 9 May 2020. Also see: The Arab Contractors, Julius Nyerere Hydropower Plant and Dam – Tanzania.]
In the DR Congo, the first two dams of the Grand Inga scheme, Inga l and ll, are built, and Inga lll is imminent. But the larger Grand Inga has been in planning since the 1950s, held back by poor planning, inefficiencies, corruption – and the need to lay transmission lines over several thousand kilometres to South African and Nigerian markets.
Several African countries have expressed interest in building nuclear power stations. Currently, only South Africa has a commercial nuclear power plant, the Koeberg station near Cape Town, that accounts for around 6% of its electricity production, with a capacity of 1 940 MW. The first unit was synchronised to the grid in 1984 and originally scheduled to be decommissioned in 2024, but its lifespan is now being extended to 2044. Plans for South Africa to procure an additional 2 500 MW of nuclear power were approved by the National Energy Regulator of South Africa in 2021.[2Koeberg nuclear power station, ESKOM, National Energy Regulator of South Africa, 18 December 2021.]
Elsewhere in Africa, Egypt has embarked upon a nuclear build program, awarded a US$25 billion contract to Russia’s Rosatom company for a 4.8 GW power plant at El-Dabaa along the Mediterranean coast, with the first unit expected to enter into service in 2028 and all four units operational by 2030[3D Procto, Russia says construction of Egypt’s first nuclear plant ahead of schedule, 20 November 2022, Power]. Other African countries that are exploring a nuclear power option include Ghana, Morocco, Uganda and Rwanda, but none have started construction.[4J Kincer and J Lovering, 2023 Update: Who in Africa is Ready for Nuclear Power? Energy for Growth Hub, 7 February 2023]
The potential development of small-scale nuclear plants, so-called small modular reactors (SMRs) with 100 MW capacity, has the potential to be ratcheted up or down to help balance the grid alongside surging renewable output in a decade or so. Larger units providing 1 GW would provide substantial additional base-load capacity.
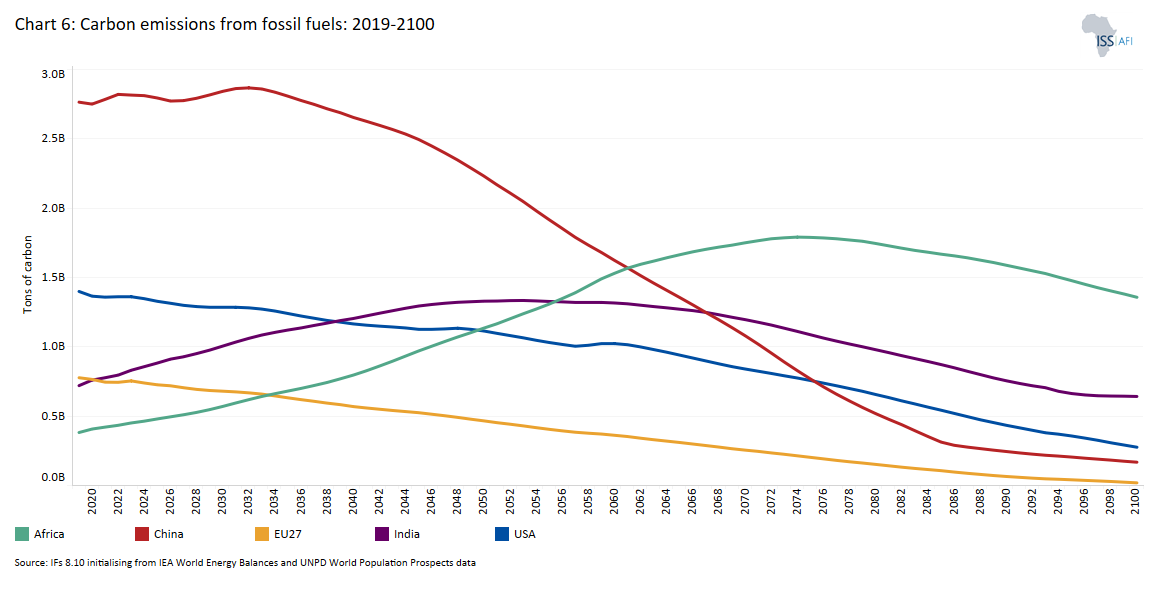
On its current development trajectory, Africa will eventually emerge as the major source of carbon emissions from fossil fuels globally. Its carbon emissions from fossil fuels will overtake the EU in 2034, the USA in 2049, India in 2055 and China in 2061
Endnotes
Xinhua, Tanzania allocates over 600 mln USD for mega hydropower project in 2020/2021, xinhuanet.com, 9 May 2020. Also see: The Arab Contractors, Julius Nyerere Hydropower Plant and Dam – Tanzania.
Koeberg nuclear power station, ESKOM, National Energy Regulator of South Africa, 18 December 2021.
D Procto, Russia says construction of Egypt’s first nuclear plant ahead of schedule, 20 November 2022, Power
J Kincer and J Lovering, 2023 Update: Who in Africa is Ready for Nuclear Power? Energy for Growth Hub, 7 February 2023
Reuse our work
- All visualizations, data, and text produced by African Futures are completely open access under the Creative Commons BY license. You have the permission to use, distribute, and reproduce these in any medium, provided the source and authors are credited.
- The data produced by third parties and made available by African Futures is subject to the license terms from the original third-party authors. We will always indicate the original source of the data in our documentation, so you should always check the license of any such third-party data before use and redistribution.
- All of our charts can be embedded in any site.
Cite this research
Jakkie Cilliers (2024) Background note on Africa’s Current Path Energy Future to 2043. Published online at futures.issafrica.org. Retrieved from https://futures.issafrica.org/special-reports/other/Energy/ [Online Resource] Updated 9 November 2023.